Zining Yang, Ruiqian Li (2024). Quantitative Approach of Policy Drivers in Clean Energy Transition: Unveiling the Interconnected Pathway. In: Human Factors and Simulation. AHFE Open Access, vol. 139, pp. 46–53. https://doi.org/10.54941/ahfe1005023
As the global community grapples with the imperative of transitioning to clean energy sources, policymakers, utilities, and other stakeholders face the challenge of navigating a complex landscape of interrelated factors. The situation necessitates a comprehensive examination of the various factors, and the interaction of those factors, which shape the clean energy transition. This paper presents a quantitative approach to better understand clean energy transition, to uncover the critical pathways and variables at play. Drawing upon our experience in data analytics and computational modeling, this research delves into the intricate web of influences that impact the adoption and diffusion of clean energy technologies. We collect data from multiple sources, including Residential Energy Consumption Survey, and Pew’s American Trends Survey to drive insights. Policy levels including Inflation Reduction Act are analyzed, and simulations are conducted to test different scenario. Preliminary result indicates recipient of energy assistance policy for low-income households significantly predicts energy consumption, and solar panel installations. Viewing the transition to clean energy as part of an interconnected system, the paper offers insights into how interactions between key factors correlates with the adoption of clean energy, ultimately shedding light on the most effective policy strategies. The findings aim to provide policymakers, utilities, stakeholders, and researchers with a comprehensive understanding of the quantitative aspects of clean energy transition, facilitating informed decision-making in the pursuit of a sustainable energy future.
The 2022 Inflation Reduction Act seeks to accelerate the process of resi- dential clean energy consumption transitioning and environmental justice. In particular, the legislation aims at increasing clean energy accessibility for low income and social minority families in the United States (US EPA, 2022). The act involves a set of financial incentives such as income tax credits and direct reimbursement of installation fees of rooftop solar photovoltaics (panels). However, many scholars and policy makers have very limited knowledge about whether and if yes how such policy would help achieve the goal of clean
Quantitative Approach of Policy Drivers in Clean Energy Transition 47
energy transition. Part of the reason is the lack of relevant nationally repre- sentative data that contains sufficient information about household energy consumption and demographic features (Bednar and Reames, 2020; Carley and Konisky, 2020).
Following methodological development in research research (Zhang et al., 2018; Jin et al., 2023), this study is one of the first that utilizes machine learning methods to analyze two national data issued by the US author- ity: the 2020 Residential Energy Consumption Survey and 2020 one-year American Community Survey. Specifically, our analysis is of two steps. First, we trained an elastic net regression model using the 2020 RECS data to predict roof-top solar panel installation with household features and sim- ulated the likelihood with 2020 one-year ACS which has the identical set of household feature indicators as in RECS. Second, we test if household socio- economic status and race moderate the effects of financial incentive policy at state level on predicting solar panel installation propensity score. Our find- ings are twofold: 1) stronger policy incentives increase lower income family’s adoption rate of roof-top solar panel; 2) stronger policy incentives increase non-white households’, specifically black households’ likelihood of roof-top solar panel installation. We will discuss in detail about the policy implication of our findings in the last section of the paper.
LITERATURE REVIEW
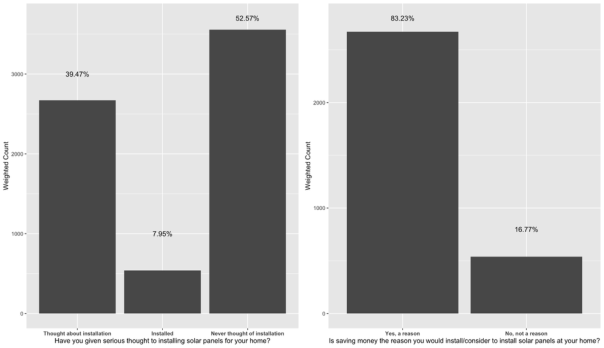
According to a recent Pew report (Leppert and Kennedy, 2022), residential solar panel adoption has risen at a drastic rate in the past few years but remains low. Figure 1 provides a clear description of the data. Less than eight percent of homeowners reported that they have installed roof-top solar panels. On the contrary, over one third of them were “seriously consider- ing” possible installation amongst whom 83 percent said saving money is a major factor of consideration. It indicates that financial incentive policy should increase the installation rate of households.
Figure 1: Residential solar panel adoption proportion and factors for consideration (weighted data from pew ATP wave 102, 2022).
48 Yang and Li
Additionally, past research suggests that socio-economic factors such as social class and ethnicity are important moderators for the effect of clean energy policy on residential panel installation. However, most studies inves- tigate either cases at state level in the United States or national level cases over- seas, such as those in Asia and Europe (Bednar and Reames, 2020; Lee and Shepley, 2020; Wolske, 2020; Bórawski, Holden and Bełdycka-Bórawska, 2023; Zhang et al., 2023). It is not certain whether these moderation effects still hold within the American context. Empirically testing the assumption with America’s national survey data provides researchers, policy makers, energy providers and other stakeholders valuable insights on clean energy transition.
STRATEGY OF ANALYSIS AND DATA SIMULATION As said, past literature fails to discuss American residential customers’ clean energy transition because of the lack of quality national survey data. Carley and Knoisky (2020) have noted that while surveys such as American Hous- ing Survey or RECS contain measures of residential solar energy transitions, these are relatively small hence not representative samples. On the other hand, several studies also suggest data like RECS do not contain sufficient demo- graphic and socioeconomic indicators. The lack of data causes difficulty for scholars to accurately investigate structural and cultural reasons that affect residential clean energy installation. Therefore, Zhang et al. (2018) proposes a machine learning based method to fill the gap. Specifically, they synthe- size RECS and ACS data with Elastic Net Regression algorithm in statistical learning as the two samples contain an identical set of household feature mea- surements. More importantly, while it collects little information about clean energy transitioning, ACS dataset is much larger, more nationally represen- tative, and contains more socio-demographic factors that RECS and other energy consumption samples do not. It is reasonable to impute residential solar panel installation propensity as well as other energy related indicators based on household features such as household size, room numbers, and bed- room numbers. The simulation was validated with regional samples collected in 2017.
Strategy of Analysis Developing the strategy of data-matching simulation in Zhang et al. (2018), we propose a three-step strategy of analysis. First, we use RECS 2020 data to train a model of Elastic Net Logistic Regression to predict the propensity score for residential solar panel installation based on household features. We choose this model as it has good performance in predicting household energy- related behaviors (Zhang et al., 2018; Satre-Meloy, 2019; Hu et al., 2021). Second, we apply the trained model to ACS 2020 data and predict household solar panel installation likelihood. Third and last, we utilize linear regression modeling to examine if the effect of financial incentive policy varies by race and socio-economic status of the household.
Quantitative Approach of Policy Drivers in Clean Energy Transition 49
Selection of Data and Variables Following past literature, we select the most recent RECS data (RECS 2020). The RECS 2020 is collected and released by the US Energy Information Administration (EIA) every three to five years. To match the year, we select the 2020 one-year American Community Survey data (ACS 2020). We then draw subsamples of single family buildings (detached and attached) only because other household types’ solar panel installation (e.g., apartment complex) do not always reflect individual decisions. As a result, our subsample of anal- ysis from RECS includes 14,070 cases and that from ACS has 1,947,592 cases.
Household features for Statistical Simulation: RECS and ACS data share a range of household indicators that we select for model training and predic- tion: 1) household type (single family attached vs detached), 2) year of built, 3) number of total rooms, 4) number of bedrooms, 5) household size (how many people in the household), and annual electricity bill.
Dependent variable: RECS contains a binary indicator asking if the household installed solar panels for electricity that we will use to estimate solar panel installation likelihood later. Overall, 4.48 percent of our RECS subsample reported solar panel installation.
Socio-demographic predictors: As RECS data contains little sociologi- cal indicators, we rely on ACS 2020 for regression analysis. Using similar methods from literature, we select several socio-demographic variables as predictors: a four category variable of household owner’s race (white, black, Asian, and other races), a continuous variable of socio-economic status (ratio of household income against census poverty threshold), a binary variable of sex of household owners (male vs female), a nine-category census geo- graphic division, and age. Race and income-poverty-ratio are our predictors of interest and others are demographic controls. And we reversely code income-poverty-ratio so that a higher score on the new scale indicates lower socio-economic status of a household.
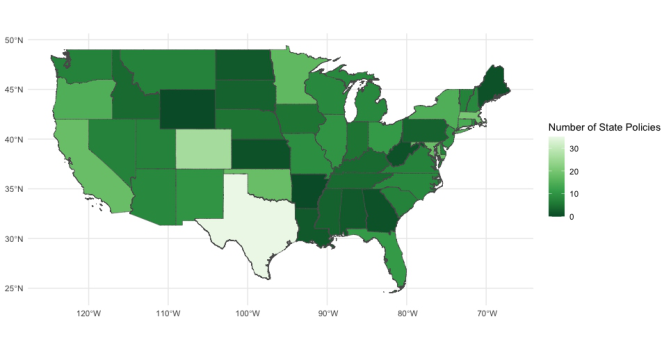
Moderator: There is no direct and straightforward measurement of finan- cial incentive that US households receive for solar panel installation, due to the lack of accurate and comprehensive data. For our purpose, we use the number of financial incentives for residential solar panel installation issued by each state as the proxy for both magnitude and complexity of policies to which a household has access. We gather the data from a database of North Carolina State University’s Clean Energy Technology Center (DSIRE, 2023). Figure 2. shows the mapping of the number of policy distributions by US state. The state of Texas tops the list with 35 different policies for residential solar panel installation while Wyoming and Arkansas have none of such policies. Unsurprisingly, states in the East Coast tend to have fewer policies.
50 Yang and Li
Figure 2: Mapping of state-level financial incentive policy distribution in mainland USA (gathered data from the website of DSIRE, 2023).
ANALYSIS AND FINDINGS
Table 1 shows our model training result. The best (minimal) lamba for the regulation penalty is calculated based on cross-validation. The left column is household feature predictors and the right column is regularized coefficient estimations. The larger the absolute value in the right column indicates higher predictive power of the corresponding variable. Similar to findings in Zhang et al. (2018), we find that household type, household size, and the number of bedrooms are key predictors.
Table 1. Elastic net logistic regression results based on RECS 2020.
Table available in the original PDF paper.
Household Feature (Predictors) Logged Odds Ratio of Solar Panel Installation (Regularized) Household Type (Single Family Detached) 1.095043707 Year of Built 0.084212832 Number of Bedrooms 0.143713726 Number of Total Rooms 0.071557260 Household Size 0.268077603 Annual Electricity Cost −0.001528021 Intercept −4.240861568 Best Lamda 0.0003095636
We then impute the residential solar panel installation propensity score with the ACS 2020 data and run regression models. Model 1 and 2 show how race and the number of state policies predict residential solar panel installa- tion likelihood and model 3 and 4 show association with socio-economic status. First, we find that across models, the number of state policies is neg- atively associated with the likelihood of residential solar panel installation. Second, model 1 shows that black households are the only minority house- holds who are less likely to install solar panels than whites. Model 3 shows
Quantitative Approach of Policy Drivers in Clean Energy Transition 51
the lower a household’s SES, the higher probability to install solar panels to alleviate the burden of electricity bills.
Table 2. Regression results using ACS 2020.
Table available in the original PDF paper.
Socio-Demographic Features Model 1 (Coef) Model 2 (Coef) Model 3 (Coef) Model 4 (Coef) # of State Policies −0.006∗∗∗ −0.012∗∗∗ −0.003∗∗∗ 0.009∗∗∗ Black (white as ref.) −0.325∗∗∗ −0.439∗∗∗ Asian (white as ref.) 1.145∗∗∗ 0.971∗∗∗ Other Races (white as ref.) 0.268∗∗∗ −0.059∗∗∗ Low socioeconomic status 0.027∗∗∗ −0.022∗∗∗ State Policy * Black 0.011∗∗∗ State Policy * Asian 0.013∗∗∗ State Policy * Other 0.024∗∗∗ State Policy * Low SES 0.004∗∗∗ Intercept 4.099∗∗∗ 4.170∗∗∗ 4.112∗∗∗ 4.192∗∗∗ N 1,907,966 1,907,966 1,907,966 1,907,966
Note: * p<0.05, ** p<0.01, *** p<0.001 for two-tailed test; Demographic controls like sex and census division are included in modeling but not included in the table.
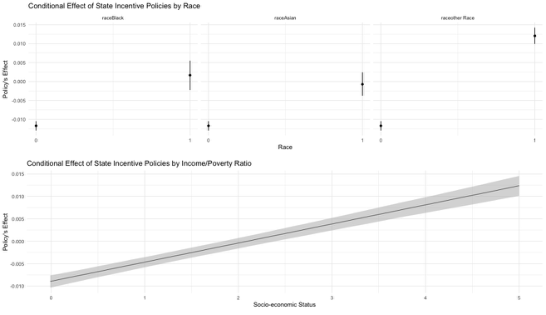
Figure 3. visualizes findings in model 2 and 4 in Table 2 regarding how the effect of state policies is moderated by household race and socio-economic status. Overall, we find that state policy variable performs well amongst racial minority and lower income households respectively. In particular, the upper panel in Figure 3 shows the interaction between state policy and race. It clearly shows the state policy has negative impact amongst white households while has positive effects amongst black and other racial minority house- holds. The lower panel shows the interaction between state policy and low SES. As the household income is getting lower (approaching 5 on x-axis), the policy effect is stronger; while higher household SES (approaching 0 on x-axis), the policy has negative effects.
Figure available in the original PDF paper.
Figure 3: State-level financial incentive policy effect on solar panel installation by household race and SES.
52 Yang and Li
CONCLUSION AND POLICY IMPLICATION This is one of the first few studies that systematically investigates how the effects of governmental financial incentive policies vary by household’s racial and socio-economic status. The use of advanced statistical simulation meth- ods provides valuable insights for clean energy transition (Zhang et al., 2018; Yang and Li, 2021; Leppert and Kennedy, 2022). One key contri- bution of this work is the integration of multiple data sources to gain a comprehensive understanding of the relationship between household char- acteristics, policy incentives, and rooftop solar panel adoption. By leveraging both the RECS and ACS data sets, the study enhances the robustness of its analysis and provides insights into the nuanced interactions between socio-economic status, race, and clean energy adoption. The methodologi- cal contribution suggests researchers and other stakeholders to invest in data collection and analysis capabilities to better understand the impact of pol- icy interventions and tailor them to address specific demographic needs and preferences.
This paper suggests that financial incentives provided by the 2022 Infla- tion Reduction Act may have a significant impact on increasing the adoption of rooftop solar panels, particularly among lower-income and racial minor- ity families. Policymakers should consider allocating resources to ensure that these incentives are effectively targeted towards low-income and minor- ity households to maximize their impact on clean energy adoption. Our research also highlights the importance of considering environmental jus- tice in clean energy transition policies. The findings indicate that stronger financial incentives are associated with increased likelihood of rooftop solar panel installation among non-white households, particularly black house- holds. Policymakers should prioritize policies that address the needs of marginalized communities to promote equity in clean energy access. In addi- tion, since the effectiveness of financial incentive policies may vary across states and be influenced by household characteristics, policymakers should consider state-level variations in policy implementation and customize strate- gies to ensure equitable access to clean energy resources across diverse communities.
This work contributes to the growing body of environmental justice lit- erature by empirically examining disparities in rooftop solar panel adoption among different demographic characteristics. By highlighting the differential impacts of policy incentives on clean energy adoption across socio-economic and racial lines, the research sheds light on the potential barriers and oppor- tunities for promoting environmental justice in the context of clean energy transition.
Given the evolving nature of clean energy transition and environmen- tal justice goals, researchers and policymakers should establish mechanisms for continuous monitoring and evaluation of policy effectiveness. This will enable timely adjustments and optimizations to ensure that policy objectives are met and equitable outcomes are achieved.
Quantitative Approach of Policy Drivers in Clean Energy Transition 53
REFERENCES
Bednar, D. J. and Reames, T. G. (2020) ‘Recognition of and response to energy poverty in the United States’, Nature Energy, 5(6), pp. 432–439. Available at: https://doi.org/10.1038/s41560-020-0582-0. Bórawski, P., Holden, L. and Bełdycka-Bórawska, A. (2023) ‘Perspectives of pho-
tovoltaic energy market development in the european union’, Energy, 270, p. 126804. Carley, S. and Konisky, D. M. (2020) ‘The justice and equity implications of the clean energy transition’, Nature Energy, 5(8), pp. 569–577. Available at: https://doi.org/10.1038/s41560-020-0641-6. DSIRE (2023) Database of State Incentives for Renewables & Efficiency®, DSIRE.
Available at: https://www.dsireusa.org/ (Accessed: 28 January 2024). Hu, Z. et al., (2021) ‘Decision-adjusted modeling for imbalanced classification: Predicting rooftop solar panel adoption in rural virginia’, in. Proceedings of the 2019 International Conference of The Computational Social Science Society of the Americas, Springer, pp. 381–399. Jin, X. et al., (2023) ‘A review and reflection on open datasets of city-level building
energy use and their applications’, Energy and Buildings, p. 112911. Lee, J. and Shepley, M. M. (2020) ‘Benefits of solar photovoltaic systems for lowincome families in social housing of Korea: Renewable energy applications as solutions to energy poverty’, Journal of Building Engineering, 28, p. 101016. Leppert, R. and Kennedy, B. (2022) ‘Home solar panel adoption continues to rise in
the US’. Satre-Meloy, A. (2019) ‘Investigating structural and occupant drivers of annual residential electricity consumption using regularization in regression models’, Energy, 174, pp. 148–168. US EPA, O. (2022) Summary of Inflation Reduction Act provisions related to renew-
able energy. Available at: https://www.epa.gov/green-power-markets/summary-in flation-reduction-act-provisions-related-renewable-energy (Accessed: 28 January 2024). Wolske, K. S. (2020) ‘More alike than different: Profiles of high-income and lowincome rooftop solar adopters in the United States’, Energy Research & Social Science, 63, p. 101399. Yang, Z. and Li, R. (2021) ‘Feature Selection Modeling on Predicting EV Charging
Station Coverage Rate in Southern California’, in. Advances in Simulation and Digital Human Modeling: Proceedings of the AHFE 2020 Virtual Conferences on Human Factors and Simulation, and Digital Human Modeling and Applied Optimization, July 16-20, 2020, USA, Springer, pp. 94–99. Zhang, W. et al., (2018) ‘Estimating residential energy consumption in metropolitan areas: A microsimulation approach’, Energy, 155, pp. 162–173. Available at: https://doi.org/10.1016/j.energy.2018.04.161. Zhang, Y. et al., (2023) ‘Regional disparity of residential solar panel diffusion
in Australia: The roles of socio-economic factors’, Renewable Energy, 206, pp. 808–819.
LISTED IN THE AHFE DIGITAL BOOKSTORE CATALOGUE
Explore the complete digital volume
Human Factors and Simulation
Read this individual research paper free through the original publisher, or explore the full digital proceedings book.
ISBN 978-1-964867-15-1
Explore this ISBN in the AHFE Bookstore ↗Listed in the July 2026 bookstore catalogue; search by ISBN to confirm current availability · Digital book purchase optional