Aaron Gardony, Andrew Whitig, Kana Okano (2024). Visualizing Uncertain Real Time Threat Information in Augmented Reality Aided Target Recognition: Lessons Learned from Virtual Reality Simulation. In: Human Factors and Simulation. AHFE Open Access, vol. 139, pp. 86–95. https://doi.org/10.54941/ahfe1005027
1 U.S. Army Combat Capabilities Development Command Soldier Center, Natick, MA 01760, USA; Center for Applied Brain and Cognitive Sciences, Medford, MA 02155, USA ↗
2 Center for Applied Brain and Cognitive Sciences, Medford, MA 02155, USA ↗
Recent advancements in artificial intelligence (AI), edge computing, and head-worn augmented reality (AR) technology are bringing the prospect of sophisticated aided target recognition (AiTR) systems from sci-fi to reality. Future AI algorithms could augment AiTR with real-time threat assessments (RTAs) that augment Soldier decision making by providing a binary threat assessment alongside an estimate of epistemic algorithmic uncertainty through the fusion and interpretation of multiple data sources. Yet, visual representations of probability are often misinterpreted, which could have consequences when relying on uncertain RTAs. To investigate, we designed simulated uncertain RTAs in virtual reality (VR) using emerging probabilistic visualization techniques, such as hypothetical outcome plots (HOPs; Hullman et al., 2015) and discrete-outcome framing (Franconeri et al., 2021), and quantified their impact on lethal force decision making. Specifically, we extended a VR decision making task from our previous work (Gardony et al., 2022; Frontiers in VR), in which participants categorized a Soldier target advancing towards them as friendly or enemy based upon their worn camouflage pattern, overlaying continuous- and discrete-outcome framed uncertain RTAs and introducing gamification elements to encourage rapid decision making. We found that when targets were easy to distinguish, participants were more conservative when categorizing targets as enemy vs. friendly, reflecting a learned decision-making heuristic. Importantly, under conditions of relatively low perceptibility (i.e., for far-away targets), our findings suggest trust in and reliance on RTAs increased, as evidenced by attenuated conservativity that deviated from the default heuristic. These findings contribute to the emerging literature on trust in AI and have implications for the design and deployment of effective military human-AI interfaces.
The United States Army is developing Soldier systems that integrate artificial intelligence and machine learning (AI/ML) to aid in the automatic detec- tion, classification, recognition, and identification of potential threats. Such
Visualizing Uncertain Real Time Threat Information 87
Aided Target Recognition (AiTR) systems can speed warfighter decision mak- ing across a range of mission sets by providing real-time threat assessments (RTAs) in heads-up augmented reality displays while reducing engagement timelines and cognitive workload (Schachter, 2020). Yet, current target clas- sification algorithms perform poorly in open-set conditions characterized by complex, dynamic environments that can be difficult or impossible to fully capture and represent by a training dataset (Dhamija et al., 2020). Imperfect AiTR can impair human performance by increasing false alarms and atten- tional tunnelling and decreasing situational awareness (Geuss et al., 2019; Matzen et al., 2020). A promising approach to mitigate these issues is to analyse the AiTR algorithm’s epistemic uncertainty, or its uncertainty due to lack of knowledge, and leverage it to either automatically reject classifi- cation labels or visualize the degree of algorithmic uncertainty to the user (Miller et al., 2021), which has been shown to reduce attentional tunnelling (Cunningham et al., 2017). Thus, future Soldier AiTR systems could incor- porate real- (or near-real) time estimates of algorithmic uncertainty in their RTA visualizations to optimize human-AI integration. In the present study, we developed a novel AiTR uncertain RTA visualization in a simulated aug- mented reality (AR) display based on data visualization best-practices and evaluated its impact on lethal force decision making in virtual reality (VR).
A central challenge to depicting uncertainty within AiTR visualizations is that the concept of uncertainty is itself difficult to understand (Franconeri et al., 2021; Matzen et al., 2023). Much research has demonstrated that map- ping uncertainty to different visual encoding channels can lead to varying interpretations (Franconeri et al., 2021; Padilla et al., 2021). For example, MacEachern and colleagues (2012) found that fuzziness, location, colour value, arrangement, size, and transparency were rated in descending order of intuitiveness. However, depicting uncertainty within an AiTR bounding box using these encodings is not straightforward and could affect the AiTR’s visibility and perceptibility in ways that reduce its effectiveness.
Alternatively, an AiTR bounding box could be augmented with an adja- cent uncertainty visualization, but this could increase visual clutter and/or difficulty of interpretation. For example, common uncertainty visualizations like density, box, and violin plots require prior experience with the visualiza- tion and/or statistical training to accurately interpret and simple error bars are frequently misunderstood even by experts (Hofman et al., 2020; Potter et al., 2010). Hypothetical outcome plots (HOPs; Hullman et al., 2015) are a promising alternative visualization technique accessible to general users that present uncertainty as a set of animated frames that each depict a sample from a probability distribution. HOPs improve estimation of distributional information better than violin plots and error bars and can be applied flexibly across real-world applications (Kale et al., 2019).
Another best practice approach to communicate probabilistic uncertainty is through frequencies (e.g., 1 out of 10). Discrete-outcome (or frequency) framing allows the viewer to interpret probabilities by counting discrete visual elements and has been shown to more effectively communicate uncer- tainty than percentages, especially for low numeracy individuals (Franconeri
et al., 2021; Peters et al., 2011). For example, in hurricane visualiza- tion, ensemble plots improve risk assessment (Liu et al., 2019) and icon arrays effectively communicate probability in health-care contexts (Garcia- Retamero and Cokely, 2017). Taken together, this research suggests uncertain RTAs implementing HOPs with discrete-outcome framing could be a promis- ing approach to depict real-time epistemic algorithmic uncertainty in an AiTR system that improves decision making and human-AI integration.
In the present study, we extended a VR lethal force decision making (LFDM) scenario from our previous work (Gardony et al., 2022; Frontiers in VR), in which participants categorized a single animated Soldier avatar advancing towards them as friendly or enemy based upon their worn cam- ouflage pattern. We overlayed uncertain RTAs modelled after HOPs, above a simulated AiTR bounding box using continuous- and discrete-outcome framing and introduced gamification elements to encourage realistic and rapid decision making. We predicted introducing uncertain RTAs would improve lethal force decision accuracy and that discrete-outcome RTAs would perform best overall.
METHODS
Participants Thirty-six active-duty Soldiers (Mage = 23.28, SDage = 5.28, 7 Female) vol- untarily participated. Human use approvals were reviewed and approved by the United States Army Combat Capabilities Development Command Soldier Center Human Research Protection Program Office and the Tufts Univer- sity Institutional Review Board. Written informed consent for participation was not required for this study in accordance with the national legislation and the institutional requirements. All participants possessed 20/30 binocu- lar distance visual acuity or better as determined by the Snellen eye chart and normal colour vision as determined by the Colour Vision Testing Made Easy test (Cotter et al., 1999).
Materials
For full details of our virtual reality (VR) LFDM scenario, including technolo- gies used and metrics collected, we refer the interested reader to our previous publication (Gardony et al., 2022). Below we provide a brief overview of the scenario and describe modifications we implemented for the present study.
A LFDM trial consisted of a single Soldier avatar (i.e., target) briskly walk- ing toward the participant in an urban corridor in VR. The target emerged from the corridor’s left or right side from either a far starting (spawn) location (75m) or a near location (50m), which manipulated its perceptibility. Par- ticipants discriminated between friendly/enemy targets based on their worn camouflage pattern which was parametrically mixed between a friendly and enemy pattern, affecting the informational content of the target stimulus. Par- ticipants also monitored the windows of nearby buildings for the appearance of a single non-combatant civilian, a secondary task designed to increase cog- nitive load. During each trial, a simulated AR bounding box surrounded the
Visualizing Uncertain Real Time Threat Information 89
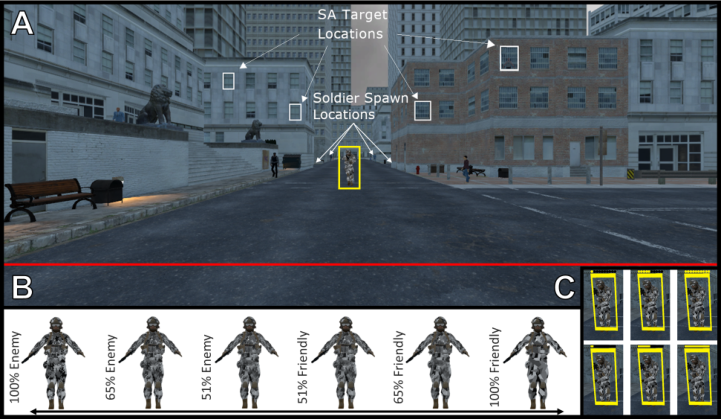
Soldier target. Depending on the (within-participants) experimental block, participants either saw this baseline “Box” AiTR alone or with an uncer- tain RTA visualization included above it. Across blocks, bounding boxes also erroneously overlayed some civilians but these spurious overlays did not include RTA visualizations. Figure 1 depicts an example trial from the LFDM scenario (A) and example Soldier targets with mixed camouflage patterns (B).
Figure 1: Example LFDM scenario trial from the box (baseline) condition. Arrows depict the four possible soldier target spawn locations and the four possible secondary target spawn locations. (B) Example soldier targets in the six possible blended camou- flage patterns (left to right: 100% enemy, 65% enemy, 51% enemy, 51% friendly, 65% friendly, 100% friendly. (C) Example uncertain RTA visualizations (top row: discrete framing, bottom row: continuous framing).
In the present study, we modified the LFDM scenario to address three lim- itations. First, we increased secondary task difficulty by removing movement jitter of the peripheral non-combatant civilian. Second, we modified the sce- nario and introduced gamification to encourage rapid and realistic decision making by (1) reducing the far spawn location distance from 100m to 75m, (2) including a low-probability (0.5%) of any trial ending prematurely (i.e. enemy Soldier shoots, friendly Soldier disappears), (3) displaying onscreen accrued points that reflected primary and secondary task performance.
AiTR Conditions In addition to the baseline “Box” condition, we evaluated two simulated uncertain RTA visualizations. These visualizations dynamically displayed an uncertain real-time threat estimate of the Soldier target, ranging from 0 (“100% friendly”) to 100 (“100% Enemy”). The visualization was updated and displayed continuously (10 Hz) based on an underlying stochastic algo- rithm that increased the accuracy and decreased the uncertainty of the current RTA as the target advanced. In the continuous-outcome framing condition, a horizontal progress bar was filled in proportion to the current RTA. For
example, if the current RTA was 75% then 3/4 of the bar would be filled. The discrete-outcome framing condition displayed a row of 10 dots. The current RTA was rounded to the nearest 10% and the corresponding number of dots was filled in proportion. For example, RTA = 75% would translate to 8/10 dots full while RTA = 33% would translate to 3/10 dots full. Figure 1, panel C presents example uncertain RTA visualizations.
Procedure The procedure was identical to our previous study. Participants completed three blocks in a single study session, box (baseline), continuous-outcome framing, and discrete-outcome framing, in counterbalanced order. The study took about 1.5 hours to complete.
RESULTS
Data Filtering and Analysis Prior to data analysis, we removed poor quality datasets in a principled manner. We first removed four participants due to experienced discomfort, very poor task performance, or incomplete data collection. Next, using the eye tracking data, we removed data blocks where participants were notice- ably drowsy. Extant research shows that percentage of time with eyes closed (PERCLOS) is associated with drowsiness (Ftouni et al., 2013) so we approx- imated PERCLOS using the VR headset’s gaze status metric and removed blocks where participants’ gaze was invalid for > 10% (6s) of any 1-minute time window. This procedure removed 16 blocks, including three additional participants. 29 (Mage = 23.65, SDage = 5.31, 6 Female) participants were ultimately included in the analysis. Lastly, again leveraging our eye track- ing data, we removed individual trials where participants did not look at the advancing Soldier target within the first 5 seconds of the trial (< 0.1% of trials).
We used R to conduct all statistical analyses. Specifically, we fit a Bayesian generalized linear mixed models (GLMMs) using the brms R package (Bürkner, 2017) and used the emmeans package (Lenth, 2020) for follow-up pairwise comparisons. For statistical inference, we report the Region of Prac- tical Equivalence (ROPE), Probability of Direction (PD), and 95% Highest Density Intervals (HDI).
Categorization Error Analysis We examined categorization error of the advancing Soldier target in the LFDM scenario with a Bernoulli family GLMM using the default priors in brms and set the ROPE to ±1%. The model included four fixed effects: Camo Clarity (CC: 51CC, 65CC, 100CC), Spawn Distance (SD: Far, Near), Par- ticipant Response (PR: Enemy, Friendly), and Real-Time Threat Assessment (RTA: Box, Continuous, Discrete) with by-participant random intercepts.
Categorization error differed between the CC and SD conditions (see Tables 1 and 2). The analysis provided strong evidence that error rates were highest for 51CC targets relative to 65 and 100CC and were higher for far spawning targets relative to near. There was little evidence that RTA
Visualizing Uncertain Real Time Threat Information 91
condition or participants’ responses themselves influenced categorization error.
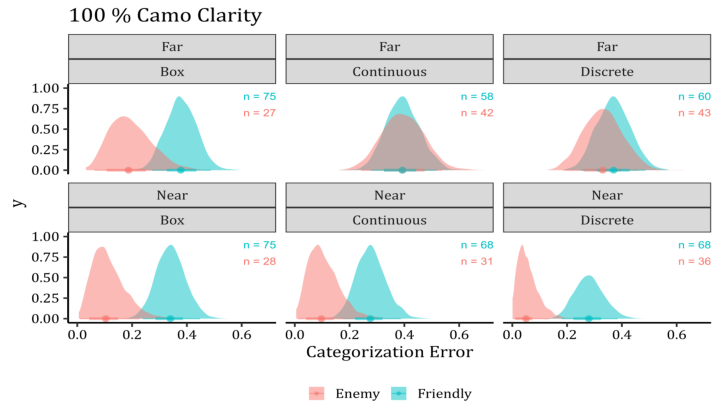
We next examined interactions, which revealed a conservative enemy cat- egorization bias (CECB) where participants committed fewer errors when categorizing enemy vs friendly targets with high informational content (i.e., 100CC, see Table 3). The observed response trends in each CC condition corroborated this finding. Overall, participants responded enemy 34% of the time (66% friendly) for 100CC targets, 55% enemy (45% friendly) for 65CC targets, and 41% enemy (59% friendly) for 51CC targets. Further analysis provided strong evidence that a CECB was evident for near but not far spawning 100C targets. Specifically, we found that for near-spawn 100CC targets, the CECB was consistent across all RTA conditions. However, for far- spawns, both RTAs eliminated the CECB effect which persisted in the Box condition (see Figure 2).
Table 1. Categorization error estimated marginal means (EMMs) by camo clarity (CC) and pairwise contrasts with 95% HDIs, % in ROPE (%R), and probability of direction (PD).
Table 2. Categorization error estimated marginal means (EMMs) by spawn distance (SD) and pairwise contrasts with 95% HDIs, % in ROPE (%R), and probability of direction (PD).
Table 3. 100% camo clarity categorization error estimated marginal means (EMMs) by participant response ([E]nemy, [F]riendly), spawn distance ([F]ar, [N]ear), and RTA ([B]ox, [C]ontinuous, [D]iscrete) and interaction pairwise contrasts with 95% HDIs, % in ROPE (%R) and probability of direction (PD).
Table available in the original PDF paper.
PR SD × RTA EMM 95% HDI Contrast SD × RTA 1 95% HDI %R PD E N, B 0.10 [0.01, 0.22] F N, B 0.34 [0.24, 0.44] E-F* N, B −0.23 [−0.38, −0.06] 0 99 E N, C 0.10 [0.02, 22] F N, C 0.27 [0.17, 0.29] E-F* N, C −0.14 [−0.32, −0.01] 0 98 E N, D 0.05 [0, 0.14] F N, D 0.28 [0.18, 0.39] E-F* N, D −0.23 [−0.36, −0.10] 0 100 E F, B 0.18 [0.06, 0.34] F F, B 0.38 [0.28, 0.49] E-F* F, B −0.19 [−0.36, 0.01] 1 97 E F, C 0.39 [0.01, 0.22] F F, C 0.39 [0.23, 0.44] E-F F, C 0.00 [−0.18, 0.20] 9 51 E F, D 0.33 [0.20, 0.47] F F, D 0.37 [0.25, 0.49] E-F F, D 0.04 [−0.21, 0.15] 7 66
Figure 2: Kernel densities of the estimated marginal means of the expected values of the categorization error posterior predictive distribution by spawn distance, RTA, and participant response for 100% camo clarity targets. Median point estimates (dots) and 66% and 95% highest density intervals (HDIs) are also depicted. Inset frequencies denote the number of observed responses for each response type.
DISCUSSION
In the present study, we investigated how uncertain real-time threat assess- ments (RTAs) influence lethal force-decision making (LFDM) using virtual reality. Participants categorized advancing Soldier targets as either friendly or enemy based on their worn camouflage pattern that varied in perceptual discriminability. Building on our previous study (Gardony et al., 2022), we incorporated RTA displays that presented real-time uncertain threat informa- tion using continuous- and discrete-outcome framing and introduced gamifi- cation to encourage rapid decision making that better reflected real-world LFDM. We found that under conditions of relatively high informational content but low target perceptibility, both discrete- and continuous-framed uncertain RTAs reduced conservative enemy categorization bias suggesting trust in AI-enabled RTAs increases when targets are difficult to perceive.
To manipulate target perceptibility, we used two Soldier target spawn dis- tances (far, near). As the Soldier advanced toward the participant, their camo pattern became more perceptible (and thus less uncertain). To manipulate the target’s informational content, we used three levels of camo clarity (CC; 51%, 65%, 100%) with greater CC having more informational content (and less uncertainty). As expected, participants more accurately categorized 100CC and 65CC targets relative to 51CC. Similarly, participants more accurately categorized near vs far targets. Taken together, these findings demonstrate that both stimulus perceptibility and informational content impacted decision accuracy.
Visualizing Uncertain Real Time Threat Information 93
Upon further inspection, we discovered an interaction where participants tended to categorize high informational content (i.e., 100CC) targets as friendly more often than enemy but this conservative enemy categorization bias (CECB) was not evident for lower informational content targets (i.e., 65CC and 51CC). This suggests that with greater informational content, par- ticipants were more conservative when categorizing targets as enemy (i.e., greater CECB), reflecting a learned decision-making heuristic from their mil- itary training (e.g., avoid friendly fire). Further investigation revealed that this CECB effect was observed for both the near- and far-spawns for the Box con- dition, suggesting that Soldiers exhibited the CECB when making decisions based solely on their visual perception. However, when assisted by an uncer- tain RTA, CECB was eliminated when target perceptibility was relatively low (i.e., far-spawn targets). This suggests that when a potential target has high informational content and high perceptibility, participants place greater trust in their perception than the uncertain RTA visualization. However, when they interrogate a high informational content target with low perceptibility, their trust in the RTA increases, leading to deviation from default decision-making heuristics (i.e., CECB). These findings contribute to the emerging literature on trust in AI and have implications for the design and deployment of effective military human-AI interfaces.
Limitations of our findings should be noted. In our effort to encourage realistic and rapid decision making, we introduced several gamification ele- ments which successfully reduced average response time (RT) in the LFDM task from 15.7s (SD = 7.7, range = 2.8–29.3) in our previous study to 3.3s (SD = 2.7, range = 0.2 – 18.56) in the present. Introducing gamification also substantially reduced RT variability, indicating that participants’ RTs were much more consistent. However, due to a regrettable coding error, far-spawn target RTs had a ∼1s variable delay while no such delay was observed for the near-spawn targets. This made RT analyses difficult to inter- pret and were therefore omitted from analysis. Lastly, we acknowledge that despite the introduction of gamification, laboratory research like the present study cannot fully replicate the real-life lethal force decision making of real- world military operations so the generalizability of our findings should be interpreted with care.
CONCLUSION
The present study contributes to the growing literature on how aided target recognition (AiTR) visual designs impact perception, cognition, and deci- sion making. We explored how two simulated uncertain real-time threat assessments (RTAs) designed to aid Soldiers in detecting threats when using AiTR systems impacted lethal force decision making. Our findings suggest that under conditions of relatively high target perceptibility, users preferen- tially trust their own visual perception over uncertain RTAs. However, under conditions of relatively low perceptibility, trust in RTA increases, leading to decision making that deviates from default conservative heuristics. Further investigation and refinement of AiTR visual designs will become increas- ingly important as future Soldier AiTR systems are developed, refined, and implemented for military applications.
ACKNOWLEDGMENT
We thank Daniel Grover and James Garijo-Garde for programming the VR scenario and Alex Kim, Gregory Hughes, Hannah Hart-Pomerantz, and Kai Renshaw for assistance with data collection.
DISCLAIMERS This work was supported by the United States Army Combat Capabilities Development Command Soldier Center under a cooperative agreement with Tufts University (W911QY-19-02-0003) and Draper (W911QY-20-C-0078). The views expressed in this article are solely those of the authors and do not reflect the official policies or positions of the Department of Army, the Department of Defense, or any other department or agency of the United States Government. The primary author prepared this work as part of their official duties as an employee of the United States Government. Pursuant to section 105 of the Copyright Act of 1976, this work is not entitled to domestic copyright protection under U.S. law.
REFERENCES
Bürkner, P.-C., 2017. brms: An R Package for Bayesian Multilevel Models Using Stan.
Journal of Statistical Software 80, 1–28. https://doi.org/10.18637/jss.v080.i01 Cotter, S., Lee, D., French, A., 1999. Evaluation of a new color vision test: “color vision testing made easy.” Optometry and vision science : Official publication of the American Academy of Optometry 76, 631–636. https://doi.org/10.1097/ 00006324-199909000-00020 Cunningham, C. A., Drew, T., Wolfe, J. M., 2017. Analog computer-aided detection
(CAD) information can be more effective than binary marks. Attention, Percep- tion, & Psychophysics 79, 679–690. https://doi.org/10.3758/s13414-016-1250-0 Dhamija, A., Gunther, M., Ventura, J., Boult, T., 2020. The Overlooked Elephant of Object Detection: Open Set, in: Proceedings of the IEEE/CVF Winter Conference on Applications of Computer Vision (WACV). Franconeri, S. L., Padilla, L. M., Shah, P., Zacks, J. M., Hullman, J., 2021. The
science of visual data communication: What works. Psychol Sci Public Interest 22, 110–161. https://doi.org/10.1177/15291006211051956 Ftouni, S., Sletten, T. L., Howard, M., Anderson, C., Lenné, M. G., Lockley, S. W., Rajaratnam, S. M. W., 2013. Objective and subjective measures of sleepiness, and their associations with on-road driving events in shift workers. Journal of sleep research 22, 58–69. https://doi.org/10.1111/j.1365-2869.2012.01038.x Garcia-Retamero, R., Cokely, E. T., 2017. Designing Visual Aids That Pro-
mote Risk Literacy: A Systematic Review of Health Research and Evidence- Based Design Heuristics. Human Factors 59, 582–627. https://doi.org/10.1177/ 0018720817690634 Gardony, A. L., Okano, K., Hughes, G. I., Kim, A. J., Renshaw, K. T., Sipolins, A.,
2022. Aided target recognition visual design impacts on cognition in simulated augmented reality. Frontiers in Virtual Reality 3. Geuss, M. N., Larkin, G., Swoboda, J., Yu, A., Bakdash, J., White, T., Berthiaume, M., Lance, B., 2019. Intelligent squad weapon: Challenges to displaying and inter- acting with artificial intelligence in small arms weapon systems. Presented at the Proc. SPIE. https://doi.org/10.1117/12.2518405
Visualizing Uncertain Real Time Threat Information 95
Hofman, J. M., Goldstein, D. G., Hullman, J., 2020. How Visualizing Inferential Uncertainty Can Mislead Readers About Treatment Effects in Scientific Results, in: Proceedings of the 2020 CHI Conference on Human Factors in Computing Systems, CHI ‘20. Association for Computing Machinery, New York, NY, USA, pp. 1–12. https://doi.org/10.1145/3313831.3376454 Hullman, J., Resnick, P., Adar, E., 2015. Hypothetical Outcome Plots Outperform
Error Bars and Violin Plots for Inferences about Reliability of Variable Ordering. PLOS ONE 10, 1–25. https://doi.org/10.1371/journal.pone.0142444 Kale, A., Nguyen, F., Kay, M., Hullman, J., 2019. Hypothetical Outcome Plots Help Untrained Observers Judge Trends in Ambiguous Data. IEEE Transactions on Visualization and Computer Graphics 25, 892–902. https://doi.org/10.1109/TV CG.2018.2864909 Lenth, R., 2020. Emmeans: Estimated marginal means, aka least-squares means. Liu, L., Padilla, L., Creem-Regehr, S. H., House, D. H., 2019. Visualizing Uncertain
Tropical Cyclone Predictions using Representative Samples from Ensembles of Forecast Tracks. IEEE Transactions on Visualization and Computer Graphics 25, 882–891. https://doi.org/10.1109/TVCG.2018.2865193 MacEachren, A. M., Roth, R. E., O’Brien, J., Li, B., Swingley, D., Gahegan, M.,
2012. Visual semiotics & uncertainty visualization: An empirical study. IEEE Transactions on Visualization and Computer Graphics 18, 2496–2505. https: //doi.org/10.1109/TVCG.2012.279 Matzen, L. E., Rogers, A., Howell, B. C., 2023. Visualizing Uncertainty in Different Domains: Commonalities and Potential Impacts on Human Decision-Making, in: Szafir, D. A., Borgo, R., Chen, M., Edwards, D. J., Fisher, B., Padilla, L. M. (Eds.), Visualization Psychology. Springer Cham, pp. 331–369. Matzen, L. E., Stites, M. C., Howell, B. C., Gastelum, Z. N., 2020. Effects of
the accuracy and visual representation of machine learning outputs on human decision making (No. SAND2020-11021C). Sandia National Lab. (SNL-NM), Albuquerque, NM (United States). Miller, D., Sünderhauf, N., Milford, M., Dayoub, F., 2021. Uncertainty for identifying open-set errors in visual object detection. IEEE Robotics and Automation Letters 7, 215–222. Padilla, L. M., Kay, M., Hullman, J., 2021. Uncertainty visualization, in: Balakrish-
nan, N., Colton, T., Everitt, B., Piegorsch, W., Ruggeri, F., Teugels, J. L. (Eds.), Wiley StatsRef: Statistics Reference Online. Peters, E., Hart, P. S., Fraenkel, L., 2011. Informing Patients: The Influence of Numeracy, Framing, and Format of Side Effect Information on Risk Percep- tions. Medical Decision Making 31, 432–436. https://doi.org/10.1177/0272989X 10391672 Potter, K., Kniss, J., Riesenfeld, R., Johnson, C. R., 2010. Visualizing Summary Statis-
tics and Uncertainty. Computer Graphics Forum 29, 823–832. https://doi.org/10. 1111/j.1467-8659.2009.01677.x Schachter, B. J. (Bruce J., 2020. Automatic target recognition, Fourth edi- tion. ed, Automatic target recognition, Tutorial texts in optical engineering ; volume TT120. SPIE, Bellingham, Washington (1000 20th St. Bellingham WA 98225–6705 USA).
LISTED IN THE AHFE DIGITAL BOOKSTORE CATALOGUE
Explore the complete digital volume
Human Factors and Simulation
Read this individual research paper free through the original publisher, or explore the full digital proceedings book.
ISBN 978-1-964867-15-1
Explore this ISBN in the AHFE Bookstore ↗Listed in the July 2026 bookstore catalogue; search by ISBN to confirm current availability · Digital book purchase optional