Yu-jie Chen, Yung-ching Liu (2024). How the Interface of Self-driving Cars Influences the Road-crossing Behavior and Subjective Evaluation of Pedestrians of Different Ages. In: Advances in Human Factors of Transportation. AHFE Open Access, vol. 148, pp. 254–262. https://doi.org/10.54941/ahfe1005215
As self-driving technology progresses, there's a crucial need to ensure safe interactions between pedestrians and vehicles. This study delves into how pedestrians of varying ages respond to different vehicle speeds and communication interfaces. The experiment encompasses three age groups (older adults, young adults, children), two vehicle speeds (40 km/hr, 60 km/hr), and six interface variations. Findings highlight those older adults exhibit poorer crossing behaviors, while children's decision times mirror those of young adults, albeit with slower walking speeds impacting safety. Notably, all age groups favor interfaces over no interface, with text-based or text combined with symbols interfaces emerging as the most effective in subjective evaluations and crossing behaviors. These insights offer invaluable guidance for optimizing pedestrian safety in the realm of autonomous vehicles.
The Global Status Report on Road Safety (WHO, 2018) indicates pedestrians make up approximately 310000 (23%) of the 1.35 million annual road traf- fic fatalities. Taiwan’s Ministry of Transportation data (2018–2023) shows pedestrians aged 65 and above account for roughly 70% of yearly deaths, while children under 12, with a mortality rate of around 1%, contribute about 6% of annual injuries.
The emergence of autonomous vehicles (AVs) necessitates safe interactions among AVs, conventional vehicles, and vulnerable road users like pedestrians. With increased vehicle automation, traditional communication methods like gestures and eye contact may diminish, posing risks of confusion and acci- dents (SAE, 2021). Pedestrians seek clear communication from AVs about their detection and yielding intentions (Schieben et al., 2019; Tabone et al., 2021). Based on the aforementioned, the study aims to examine potential inter- action effects on road-crossing behavior and subjective evaluations among pedestrians from three age groups under different communication interface designs between AVs and pedestrians at varying vehicle speeds.
How the Interface of Self-Driving Cars Influences the Road-Crossing Behavior 255
LITERATURE REVIEWS Dunbar (2012) analyzed UK pedestrian casualty data from 1990 to 2009, noting higher casualties among children aged 10–14 and individuals aged 85 and above. Among three age groups (30–45 years, 60–69 years, over 75 years), over 75s made significantly more unsafe decisions (76.9%) com- pared to younger counterparts (Oxley et al., 2005). Research on three age groups (20–35 years, 60–67 years, 70–84 years) found older adults took significantly longer to decide when crossing two-way streets than younger adults (Dommes et al., 2013). These studies underscore the higher risk of road crossing among the elderly.
Children, due to their undeveloped judgment, face significant risks while crossing roads. Studies focused on children’s road-crossing behavior (Meir et al., 2013; Tapiro et al., 2020). Participants aged 7–9 years demonstrated significantly shorter decision times for crossing roads, indicating lower risk awareness (Meir et al., 2013). Additionally, research examined the impact of age groups (22–29 years, 11–13 years, 9–10 years) on remaining time after road crossings, showing significantly shorter remaining times for child groups compared to adults (Tapiro et al., 2020).
As AV technology advances, self-driving cars are poised to become a primary mode of transportation, promising to reduce driver errors and result- ing accidents (NHTSA, 2017). However, pedestrians interacting with AVs may exhibit unsafe road-crossing behaviors due to their lack of experience, potentially leading to erroneous decisions (Vissers et al., 2017). Surveys inves- tigating pedestrians’ willingness to cross roads found that they were less inclined to do so when drivers were distracted, highlighting the importance of eye contact for reassurance (Lundgren et al., 2017). Pedestrians prefer clear communication from AVs, as they cannot rely on traditional forms of inter- action like eye contact or gestures, thereby increasing the risk of accidents (Merat et al., 2018).
A field study assessed pedestrians’ willingness to cross roads when encoun- tering traditional and AVs. Participants were hesitant to cross when drivers were distracted or absent, underscoring the significance of eye contact (Lagström & Lundgren, 2016; Habibovic et al., 2016). Research using car seat costumes revealed pedestrians’ reliance on vehicles meeting expecta- tions for safe interaction (Rothenbücher et al., 2016). Research indicates drivers’ signals impact pedestrians, with 84% seeking eye contact (Sucha et al., 2017). AVs may impede interpersonal communication, complicating pedestrian crossing decisions. Thus, clear communication with pedestri- ans is vital. Studies on 144 participants’ interface preferences favor visual over auditory presentation to prevent confusion with other traffic sounds (Deb et al., 2016).
Studies exploring AV interface effectiveness for pedestrians found sil- houettes and text safest, with text preferred (Hochman et al., 2020; Wang et al., 2021). Virtual reality studies revealed that simple cues like a green “WALK” signal or pedestrian icon effectively communicated safety (Fridman et al., 2019). Another study using virtual reality introduced “eye” icons in car headlights, reducing pedestrian decision time (Chang et al., 2017).
256 Chen and Liu
However, conflicting results arise from other studies. One study examining 50 participants found no significant difference in decision time when pre- sented with different walking-related interfaces, with only 12% influenced by the interface (Clamann et al., 2017). These findings underscore AV inter- faces’ importance for pedestrian safety and highlight inconsistent interaction outcomes based on presentation methods.
METHODS
Participants This study recruited 98 participants, including 34 children (aged between 11–12 years, mean age: 11.41, SD = 0.99), 33 young adults (aged between 20–26 years, mean age: 22.64, SD = 2.25), and 31 older adults (aged 65 years and above, mean age: 68.81, SD = 3.90). All participants had nor- mal or corrected-to-normal vision of 16/20 or above, were not color blind, and were able to walk outdoors without assistance. Older adults underwent the Mini-Mental State Examination (MMSE), scoring above 25 out of 30 to indicate normal cognitive function. This study was approved by the Institu- tional Review Board of the National Cheng Kung University Hospital (IRB No. B-ER-112-098).
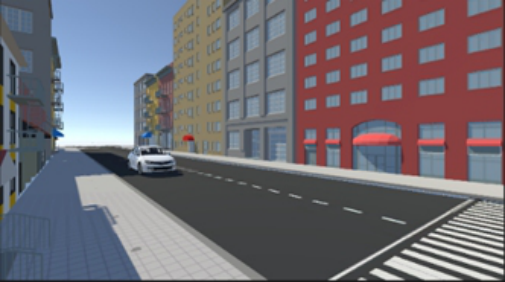
Experimental Scene By using the HTC Vive Pro Eye, this study utilized the 3D Unity game engine to construct virtual environments. The environment depicted a sunny urban setting (Figure 1) with road and sidewalk widths set at 3.5 meters and 1.5 meters, respectively, based on Taiwan Ministry of Transportation regulations. When participants reached the trigger point before the pedestrian crossing, Vehicles approached from the left side of the participants at speeds of either 40 km/h or 60 km/h, with each speed appearing 12 times. The starting point for vehicles traveling at 40 km/h was 105 meters from the pedestrian cross- ing, while for vehicles traveling at 60 km/h, it was 158 meters away. The pedestrians will cross six intersections sequentially.
Figure 1: An example of the road scene.
How the Interface of Self-Driving Cars Influences the Road-Crossing Behavior 257
Experimental Design and Procedures This study employed a factorial design with three age groups (children vs. young adults vs. older adults; between-group design), six AV inter- faces (no interface, speedometer, text, graphic, animation, text + graphic; within-group design), and two speeds (40 km/hr, 60 km/hr; within-group design).
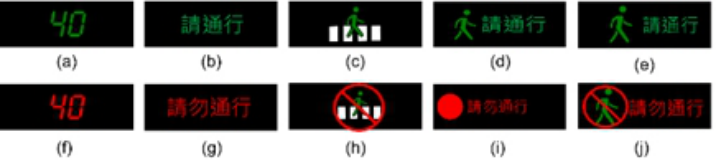
For the six AV interfaces, except for the no interface, when pedestrians can pass, the speedometer interface presents the speed in green digits; the text interface displays “Please proceed” in Chinese; the graphic interface shows an icon of “a green figure walking on a zebra crossing”; the animation inter- face presents “a green figure moving rightward, interspersed with text”; the “text + graphic”interface uses “a green figure and the text “Please proceed”. In contrast to the above five types of passable messages, when passage is not allowed, red replaces green, the word “cannot” replaces “can,” and a red prohibition symbol is added to the original green figure (Figure 2). Interface messages are all displayed on the car’s front grille.
Figure 2: Examples of the 5 interfaces, among which (a) to (e) display passable information; (f) to (j) represent non-passable messages.
Upon participants’ arrival at the experimental site, the purpose and pro- cedure of the study were explained. After participants fully understood the experiment, visual acuity and color blindness tests were conducted. If partici- pants met the requirements and voluntarily agreed to participate, they signed a consent form. Subsequently, their normal walking and brisk walking speeds were measured using a stopwatch. Before the experiment, participants prac- ticed for about 5 minutes to get familiar with the experimental equipment, and completed a simulator sickness questionnaire to check for symptoms in the virtual environment.
Participants in the experiment used HTC controllers to move forward upon entering the virtual scene. Upon nearing the pedestrian crossing, a vehi- cle appeared from the left side of the road, traveling at a constant speed (40 or 60 km/hr). Participants pressed the controller button upon seeing the vehicle for the first time. After understanding the interface, they pressed the button again and verbally responded to what they saw. When deciding to cross the road, they pressed the button for the third time. After each crossing, par- ticipants verbally rated their confidence and perceived risk on a scale from extremely low (1) to extremely high (10).
258 Chen and Liu
After each of the 24 road crossings, participants rated their understanding, preferences and confidence of the experienced interface using a Likert 10- point scale. Four experiments were completed per participant, with breaks provided every 6 crossings for a simulator sickness questionnaire and inter- face rating. Participants’ crossing behaviors and subjective ratings were collected as the dependent variables for this study. The crossing behaviors include (1) Decision time (s): The time it takes for participants to decide to cross the road after seeing the vehicle; (2) Remaining time (s): The time it takes for vehicles to pass through the intersection when participants decide to cross the road; (3) Safety index (s): The difference between the remaining time and the time it takes for participants to walk 3.5 meters. If the safety index is less than or equal to zero, it indicates a potential collision with the vehicle, while subjective ratings covered confidence level, risk level, comprehensive level, and preference level, all assessed on Likert scales.
RESULTS
Due to space constraints, only the significant effects of the interaction between age and vehicle interface on decision time (F(10,475) = 7.201, p = 0.000), remaining time to cross the road (F(10,475) = 9.378, p = 0.000), safety index (F(10,475) = 7.978, p = 0.000), and confidence level in crossing the road (F(10,475) = 6.429, p = 0.000) are detailed.
In decision time, younger individuals had shorter times with text (3.932s) and text + graphic (4.169s) interfaces, longest with no interface (5.407s) and speed-only (5.418s). Older individuals also had shorter times with text (4.518s) and text + graphic (4.62s) interfaces, longest with no interface (6.362s). For children, times were shorter with text (4.1s), text + graphic (4.28s), and animation (4.29s) interfaces, longest with no interface (5.634s). Without interfaces (Younger: 5.407s, Children: 5.634s, Older: 6.362s), with text (Younger: 3.932s, Children: 4.1s, Older: 4.62s), and with graphics (Younger: 5.08s, Children: 5.01s, Older: 5.77s), both younger individu- als and children decided significantly faster than older individuals, with no significant difference between younger individuals and children. With animation, children decided significantly faster than older individuals, and younger individuals also decided significantly faster than older individu- als (Children = 4.29s, Younger: 4.965s, Older: 5.694s). Decision times did not significantly differ among the three age groups for speed-only and text + graphic interfaces.
In remaining time analysis, younger individuals exhibited longer times with text (4.11s) and text + graphic (3.79s) interfaces compared to the other four, while older individuals demonstrated longer times with text (3.265s) and text + graphic (3.225s) interfaces. Children displayed longer times with text (3.805s), animation (3.604s), and text + graphic (3.502s) interfaces. Moreover, without an interface, both younger individuals and children had longer times than older individuals (Younger: 2.467s, Children: 2.109s, Older: 1.527s), and with animation, both younger individuals and children had longer times than older individuals (Children: 3.604s, Younger: 2.932s,
How the Interface of Self-Driving Cars Influences the Road-Crossing Behavior 259
Older: 2.073s). Additionally, with a text + graphic interface, younger indi- viduals had longer times than older individuals (Younger: 3.79s, Children: 3.502s, Older: 3.225s). Younger individuals had higher safety indices with text (2.506s) and text + graphic (2.275s) interfaces compared to the other four. Older indi- viduals showed higher safety indices with text (0.804s) and text + graphic (0.519s) interfaces, and the safety index with speed (−0.029s) was higher than with graphic (−0.595s), animation (−0.624s), and no interface (−0.777s). Children had higher safety indices with text (1.683s), animation (1.395s), and text + graphic (1.386s) interfaces compared to the other three, with the safety index with a graphic interface (0.567s) also higher than with speed (0.151s) and no interface (0.034s) setups. Moreover, younger individ- uals’ safety index was higher than children’s (0.034s) and older individuals’ (−0.777s) without an interface, and younger individuals’ safety index (1.13s) was higher than children’s (0.151s) and older individuals’ (−0.029s) with speed-only. When the interface was text, graphic, and text + graphic, younger individuals’ safety index was higher than children’s and older individuals’, with children’s safety index also higher than older individuals’. When the interface was animation, both younger individuals (1.328s) and children (1.395s) had higher safety indices than older individuals (−0.624s).
For road-crossing confidence ratings, younger individuals exhibited sig- nificantly higher confidence with text (8.265), text + graphic (8.038), and animation (7.75) interfaces compared to the other three. Older participants reported higher confidence with text (7.944) and text + graphic (7.532) interfaces. Children showed higher confidence with text (8.088), animation (7.901), and text + graphic (7.816) interfaces. Without an interface, both younger individuals (5.333) and children (5.118) displayed higher confidence levels than older individuals (3.605). Older participants reported higher con- fidence than children with a speed interface (Older: 6.411, Younger: 4.045, Children: 5.669). Confidence levels with text, graphic, and text + graphic interfaces did not significantly differ across age groups.
DISCUSSION AND CONCLUSION The study found that across all age groups—young, children, and elderly— AV interfaces using text or text + graphic yielded the best crossing perfor- mance and subjective ratings. These interfaces resulted in shorter decision times, longer remaining times, and higher confidence levels when cross- ing roads. They also led to better understanding, preference, and future acceptance compared to other interface types. This highlights that text-based interfaces enable pedestrians to quickly understand and decide when to cross, aligning with prior research (Bazilinskyy et al., 2021; Deb et al., 2018; Eisma et al., 2021).
When AV interfaces use animation, there is no significant difference in crossing behavior and subjective ratings between young adults and children, but elderly individuals exhibit significantly lower performance and subjec- tive ratings compared to young adults and children. According to the elderly, since the vehicle is already in motion, presenting the interface in animated
260 Chen and Liu
form may cause distractions, making it difficult for them to focus on both the interface and the vehicle. Additionally, elderly individuals have lower percep- tion of moving objects, resulting in poorer crossing behavior and subjective ratings.
When the AV interface is presented with graphics and speed, performance and subjective ratings of crossing behavior are poorer across all three age groups. This may be because graphic presentations are less intuitive (Eisele & Petzoldt, 2022), requiring participants to spend more time understanding the interface’s meaning. Participants also noted that the background of the interface made the zebra crossing less visible, requiring more effort to under- stand and make decisions. Additionally, research indicates that vehicle speed is considered the most important source of information for pedestrians when making road-crossing decisions (Domeyer et al., 2020; Risto et al., 2017). However, this study found that when the AV interface presents car speed, par- ticipants’ road-crossing behavior is only marginally better than when there is no interface. According to participants, while they understand that the interface intends to show speed when crossing the road, they still rely on observing the distance between the vehicle and themselves to decide when to cross. Therefore, this study suggests that perhaps pedestrians’ major criterion for crossing the road is distance.
Finally, when there is an interface present, pedestrians’ road-crossing per- formance is generally better compared to when there is no interface. This aligns with past research findings that pedestrians tend to cross roads ear- lier and more safely when encountering autonomous vehicles with interfaces (Bindschädel et al., 2021; Lee et al., 2022).
REFERENCES
Bazilinskyy, P., Kooijman, L., Dodou, D., & de Winter, J. C. F. (2021). How should external human-machine interfaces behave? Examining the effects of colour, posi- tion, message, activation distance, vehicle yielding, and visual distraction among 1, 434 participants. Applied Ergonomics, 95, 103450. Bindschädel, J., Krems, I., & Kiesel, A. (2021). Interaction between pedestrians and
automated vehicles: Exploring a motion-based approach for virtual reality exper- iments. Transportation Research Part F: Traffic Psychology and Behaviour, 82, 316–332. Chang, C.-M., Toda, K., Igarashi, T., Miyata, M., & Kobayashi, Y. (2018). A Videobased Study Comparing Communication Modalities between an Autonomous Car and a Pedestrian. Clamann, M., Aubert, M., & Cummings, M. (2017). Evaluation of Vehicle-to-
Pedestrian Communication Displays for Autonomous Vehicles. Deb, S., Warner, B., Poudel, S., & Bhandari, S. (2016). Identification of External Design Preferences in Autonomous Vehicles. Deb, S., Strawderman, L. J., & Carruth, D. W. (2018). Investigating pedestrian
suggestions for external features on fully autonomous vehicles: A virtual reality experiment. Transportation Research Part F: Traffic Psychology and Behaviour, 59, 135–149. Domeyer, J. E., Lee, J. D., & Toyoda, H. (2020). Vehicle Automation–Other Road User Communication and Coordination: Theory and Mechanisms. IEEE Access, 8, 19860–19872.
How the Interface of Self-Driving Cars Influences the Road-Crossing Behavior 261
Dommes, A., Cavallo, V., Dubuisson, J.-B., Tournier, I., & Vienne, F. (2014). Crossing a two-way street: Comparison of young and old pedestrians. Journal of Safety Research, 50, 27–34. Dunbar, G. (2012). The relative risk of nearside accidents is high for the youngest
and oldest pedestrians. Accident Analysis & Prevention, 45, 517–521. Eisele, D., & Petzoldt, T. (2022). Effects of traffic context on eHMI icon comprehension. Transportation Research Part F: Traffic Psychology and Behaviour, 85, 1–12. Eisma, Y. B., Reiff, A., Kooijman, L., Dodou, D., & de Winter, J. C. F. (2021). Exter-
nal human-machine interfaces: Effects of message perspective. Transportation Research Part F: Traffic Psychology and Behaviour, 78, 30–41. Fridman, L., Mehler, B., Xia, L., Yang, Y., Facusse, L., & Reimer, B. (2019). To Walk or Not to Walk: Crowdsourced Assessment of External Vehicle-to-Pedestrian Displays. Habibovic, A., Andersson, J., Nilsson, M., Lundgren, V. M., & Nilsson, J. (2016,
19–22 June 2016). Evaluating interactions with non-exV). Hochman, M., Parmet, Y., & Oron-Gilad, T. (2020). Pedestrians’ Understanding of a Fully Autonomous Vehicle’s Intent to Stop: A Learning Effect Over Time. Front Psychol, 11, 585280. Lagström, T., & Lundgren, V. M. (2016). AVIP - Autonomous vehicles’ interac-
tion with pedestrians - An investigation of pedestrian-driver communication and development of a vehicle external interface. Lee, Y. M., Madigan, R., Giles, O., Garach-Morcillo, L., Markkula, G., Fox, C., Camara, F., Rothmueller, M., Vendelbo-Larsen, S. A., Rasmussen, P. H., Dietrich, A., Nathanael, D., Portouli, V., Schieben, A., & Merat, N. (2021). Road users rarely use explicit communication when interacting in today’s traffic: implications for automated vehicles. Cognition, Technology & Work, 23(2), 367–380. Lundgren, V. M., Habibovic, A., Andersson, J., Lagström, T., Nilsson, M., Sirkka,
A., Fagerlönn, J., Fredriksson, R., Edgren, C., Krupenia, S., & Saluäär, D. (2017, 2017//). Will There Be New Communication Needs When Introducing Automated Vehicles to the Urban Context? Advances in Human Aspects of Transportation, Cham. Meir, A., Oron-Gilad, T., & Parmet, Y. (2015). Are child-pedestrians able to identify hazardous traffic situations? Measuring their abilities in a virtual reality environment. Safety Science, 80, 33–40. Merat, N., Louw, T., Madigan, R., Wilbrink, M., & Schieben, A. (2018). What exter-
nally presented information do VRUs require when interacting with fully Auto- mated Road Transport Systems in shared space? Accident Analysis & Prevention, 118, 244–252. NHTSA. (2017). In: NHTSA Federal Automated Vehicles Policy. Website : file:///C:/Users/liuyc/Downloads/795644.pdf. Oxley, J. A., Ihsen, E., Fildes, B. N., Charlton, J. L., & Day, R. H. (2005). Crossing roads safely: An experimental study of age differences in gap selection by pedestrians. Accident Analysis & Prevention, 37(5), 962–971. Risto, M., Emmenegger, C., Vinkhuyzen, E., Cefkin, M., & Hollan, J. (2017).
Human-Vehicle Interfaces: The Power of Vehicle Movement Gestures in Human Road User Coordination.
262 Chen and Liu
Rothenbücher, D., Li, J., Sirkin, D., Mok, B., & Ju, W. (2016, 26–31 Aug. 2016).
Ghost driver: A field study investigating the interaction between pedestrians and driverless vehicles. 2016 25th IEEE International Symposium on Robot and Human Interactive Communication (RO-MAN). Schieben, A., Wilbrink, M., Kettwich, C., Dodiya, J., Sorokin, L., Merat, N., Dietrich, A., Bengler, K., & Kaup, M. (2019). Testing external HMI designs for automated vehicles – An overview on user study results from the EU project interACT. Sucha, M., Dostal, D., & Risser, R. (2017). Pedestrian-driver communication and
decision strategies at marked crossings. Accident Analysis & Prevention, 102, 41–50. Tabone, W., de Winter, J., Ackermann, C., Bärgman, J., Baumann, M., Deb, S., Emmenegger, C., Habibovic, A., Hagenzieker, M., Hancock, P. A., Happee, R., Krems, J., Lee, J. D., Martens, M., Merat, N., Norman, D., Sheridan, T. B., & Stanton, N. A. (2021). Vulnerable road users and the coming wave of auto- mated vehicles: Expert perspectives. Transportation Research Interdisciplinary Perspectives, 9, 100293. Tapiro, H., Oron-Gilad, T., & Parmet, Y. (2020). Pedestrian distraction: The effects
of road environment complexity and age on pedestrian’s visual attention and crossing behavior. Journal of Safety Research, 72, 101–109. Vissers, L., Kint, S., Schagen, I., & Hagenzieker, M. (2017). Safe interaction between cyclists, pedestrians and automated vehicles. What do we know and what do we need to know? Wang, P., Motamedi, S., Qi, S., Zhou, X., Zhang, T., & Chan, C.-Y. (2021).
Pedestrian interaction with automated vehicles at uncontrolled intersections. Transportation Research Part F: Traffic Psychology and Behaviour, 77, 10–25. WHO. (2018). In: Global status report on road safety 2018. Website: https://www.
who.int/publications/i/item/9789241565684.
LISTED IN THE AHFE DIGITAL BOOKSTORE CATALOGUE
Explore the complete digital volume
Advances in Human Factors of Transportation
Read this individual research paper free through the original publisher, or explore the full digital proceedings book.
ISBN 978-1-964867-24-3
Explore this ISBN in the AHFE Bookstore ↗Listed in the July 2026 bookstore catalogue; search by ISBN to confirm current availability · Digital book purchase optional