Lin Jie, Xing Liu, Alan Chan, Tingru Zhang (2024). Effects of interactive modality on the spatiotemporal characteristics of driver eye movement. In: Advances in Human Factors of Transportation. AHFE Open Access, vol. 148, pp. 430–440. https://doi.org/10.54941/ahfe1005234
In-vehicle information system (IVIS), as crucial components in the vehicles, provide drivers with convenient functionalities but also pose potential safety hazards. Operating these systems requires visual attention, potentially increasing the risk of accidents. While previous researches focused on static eye metrics like fixation and saccade, limited attention has been given to spatiotemporal eye movement characteristics crucial for information acquisition while driving. This study investigated the impacts of three modalities (voice-based, touchscreen-based, and gesture-based) on spatiotemporal characteristics of driver eye movement. Thirty-six participants were recruited to a simulated driving experiment, with one group acting as baseline without non-driving related tasks (NDRTs), while others performed NDRTs using one of different interactive modalities. Scanpaths, fixation entropy, and visual transition probability matrices were analyzed to understand spatiotemporal characteristics. A new comparison method based on ScanMatch algorithm was proposed to measure the similarity of scanpaths. The K-means clustering was used to identify areas of interest (AOIs), while Shannon’s equation was applied to calculate fixation entropy. Visual transition probability matrices normalized transition counts, revealing areas with the most transitions. Results showed the voice group's eye movements closely resembled the baseline, with higher entropy in driving-related AOIs. In contrast, the touchscreen group had lower entropy and a higher likelihood of distraction. Thus, voice-based interaction had the least distracting effect, resembling baseline eye movement patterns. These findings offer insights for designing safer IVIS interactions to reduce traffic accidents.
In-vehicle information systems (IVIS) improve driving experiences by offering drivers secure and convenient services, allowing them to perform non-driving tasks while driving, thus enhancing overall satisfaction (Ziakopoulos et al., 2019). However, the widespread use of IVIS has also raised safety concerns. Using IVIS while driving has been identified as a significant source of driver distraction, potentially jeopardizing driving safety. Research indicates that
Effects of Interactive Modality on the Spatiotemporal Characteristics 431
IVIS usage during driving leads to increased maximum deceleration (Li and Boyle, 2019), increased off-road fixation duration (Feng, Liu and Chen, 2018; Lee, Kim and Ji, 2019) and more instances of lane departure (Lee, Kim and Ji, 2019; Ma et al., 2020). The interactive modalities of IVIS directly influence driver safety, and effective modalities can significantly reduce the likelihood of traffic accidents. Hence, investigating methods to minimize acci- dents caused by IVIS operation and exploring enhanced interactive modalities are crucial for driving safety.
Recent researches on the interaction input modalities of IVIS have primar- ily focused on the impact of three input modalities – touchscreen, voice, and gestures – on eye movement patterns (Zhang et al., 2023). Feng, Liu, and Chen (2018) conducted a study on the size and quantity of touchscreen but- tons, revealing a directly proportional relationship between the number of buttons and fixation duration. Despite there are extensive researches, most studies have relied on single eye movement indicators to characterize complex eye movements.
Common single eye movement indicators such as fixation, saccade, and saccade speed help in understanding eye movement patterns. However, a key limitation of analyzing single eye movement indicators is overlooking eye movement is a complex process. Eye movements involve multiple indicators like gaze, saccades, and smooth tracking, which often occur together during information intake. Thus, studying comprehensive eye movement indicators is vital for understanding scanning strategies.
Based on this perspective, this study uses comprehensive eye movement indicators to explore the differences in IVIS interactive modalities com- pared to regular driving. By analyzing eye movement data from experiments, we assessed how touchscreen, voice, and gesture interactions affect driving through scanpaths, fixation entropy, and transition characteristics. Com- parisons were made with normal driving to determine the least impactful interactive modality. The study aims to offer theoretical insights for future IVIS design in the automotive industry.
EXPERIMENT DESIGN Experiment Subject
The experiment recruited 36 participants (24 males, 12 females) with an average age of 21.2 years (SD = 3.12, min = 19, max = 25), all possess- ing valid driver’s licenses. All participants were right-handed, had normal or corrected-to-normal vision, and lacked visual impairments like color blind- ness. Analysis of variance (ANOVA) revealed no significant differences in demographic characteristics among the four groups (p > 0.05).
Experiment Equipment The experiment used a driving simulation system consisting of a computer, three 27-inch LED displays, a Logitech steering wheel, accelerator and brake controllers, and a driving seat. UC-win/Road 14.0 simulation software was utilized to create driving scenarios and collected data at a frequency of 30Hz.
Gesture interaction tasks involved the Leap Motion 2.0 sensor. A PAD was integrated into the simulator setup. Eye movement data was captured using Tobii Glasses 3.
IVIS Interactive Experiment and Subtask Design The experiment’s within-group variable is the interactive modalities (voice, touchscreen, gestures, and a baseline group with no IVIS interaction), and the dependent variable is eye movement behavior. Each group, except the baseline group, completed a series of subtasks during the experiment. These subtasks involved operating IVIS for actions like navigation, music playback, volume adjustment, and information reading. Touchscreen interaction uti- lized the touchscreen, voice interaction used the built-in voice assistant on a PAD, and gesture interaction was conducted through the Wizard-of-Oz (WoZ) method.
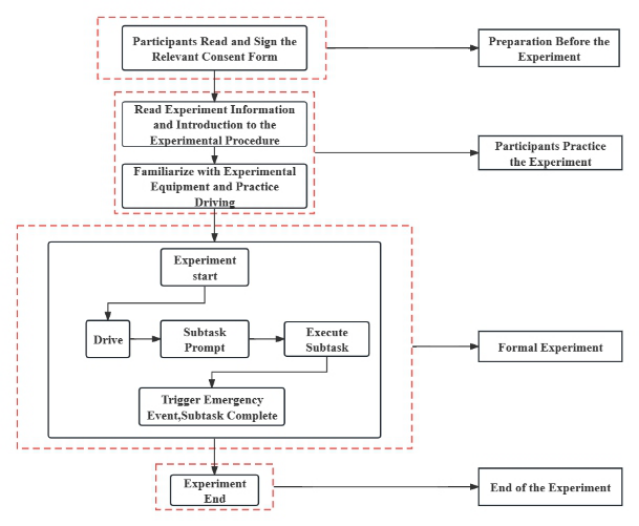
Emergency Scenario Design and Experimental Procedure The experiment featured three common emergency scenarios encountered in real driving: sudden vehicle deceleration, pedestrian crossing at an intersec- tion, and vehicle malfunction ahead. These events aimed to accurately assess drivers’ genuine reactions under various interaction modalities. The experi- ment, outlined in Figure 1, lasted around 60 minutes and consisted of four phases: pre-experiment preparation, simulation practice, formal experiment, and experiment conclusion.
Figure 1: Experiment procedure diagram.
Effects of Interactive Modality on the Spatiotemporal Characteristics 433
RESULTS
Scanpath Comparison Algorithm The schematic diagram of the scanpaths encompassing information across three dimensions: fixation, time, and sequence. In the diagram, the numbers represent the sequential order of fixations, the size of the circles indicates the duration of each fixation (larger circles denote longer durations), and the center of the circles represents the coordinates of the fixation points. As the scanpath includes the transition information between fixation points, it can reflect changes in visual attention.
This study utilized the ScanMatch method to compare differences in scan- paths (Cristino et al., 2010). It excels in evaluating the similarity of scanning paths in spatial, temporal, and sequential aspects, aligning well with the data analysis requirements of this experiment. ScanMatch integrates intrinsic asso- ciative information within AOIs into similarity score calculation through a replacement matrix (Anderson et al., 2015). The algorithm converts ordered scanpaths into fixed-order strings, simplifying the comparison process into a string comparison problem, further optimized using the Needleman–Wunsch Algorithm (Needleman and Wunsch, 1970). After dividing the experimental scene into several AOIs, assign corresponding letters to each AOI. Specif- ically, ScanMatch can also take fixation duration into account. Typically, 50ms is set as one unit, and then fixation durations are encoded proportion- ally. Encoded strings without fixation duration only represent the trajectory and sequence of fixations, while those with fixation duration additionally include the duration of fixations on AOIs.
To compare the similarity between eye movement sequences, the Needleman–Wunsch algorithm was utilized and this involved setting two key parameters: the replacement matrix and the gap penalty. The replace- ment matrix defines the score obtained when aligning two AOIs, and the gap penalty refers to the score assigned for introducing a gap (an empty space) to align any elements in the sequence. The total alignment score for two sequences represents the similarity score of the two eye movement trajectory sequences.
Considering the impact of length differences on the final score, the algorithm normalizes the resulting score. The normalization formula is as follows: Normalized Score= S S1∗N (1)
Where S is the total alignment score, S1 is the maximum alignment score in the replacement matrix, and N is the length of the sequence string.
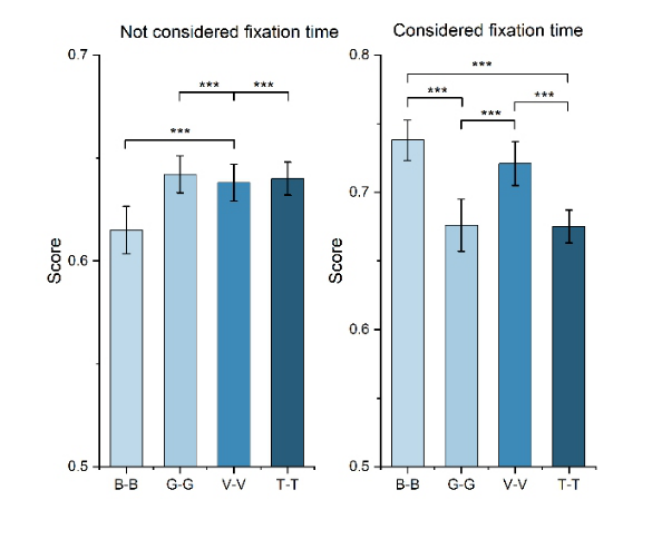
Scanning Path Comparison Results This study conducted pairwise comparisons of scanning paths within each group, obtaining similarity scores. The intra-group comparison scores were then analyzed pairwise, with the results presented in Figure 2. The left part of Figure 2 shows results without considering fixation duration while the right part shows results taking fixation duration into account.
Figure 2: Within-group similarity score variance analysis. “B” stands for “Base- line”, “G” stands for “Gesture”, “V” stands for “Voice”, “T” stands for “Touchscreen”. **indicates p < 0.01, and ***indicates p < 0.001.
Figure 2 analysis shows that Gesture-Gesture comparison had the highest similarity score when fixation duration wasn’t considered, while Baseline- Baseline had the lowest. ANOVA results revealed voice interaction’s within- group scores significantly surpassed the other three, indicating more con- sistent scanning sequences. Baseline group had the lowest mean similarity score, suggesting diverse scanning sequences. However, when fixation dura- tion was considered, Baseline-Baseline had the highest similarity score, and Touchscreen-Touchscreen had the lowest. ANOVA showed Baseline-Baseline had significantly higher similarity score than Touchscreen-Touchscreen and Gesture-Gesture. Similarly, Voice-Voice had significantly higher scores than Touchscreen-Touchscreen and Gesture-Gesture. No significant difference existed in within-group scanpaths similarity scores between Voice and Base- line groups, indicating their consistent scanning strategies.
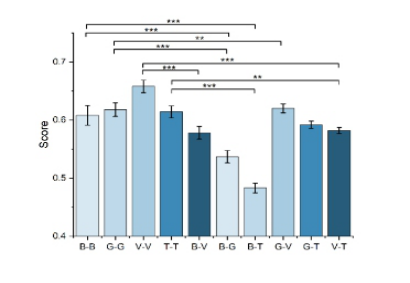
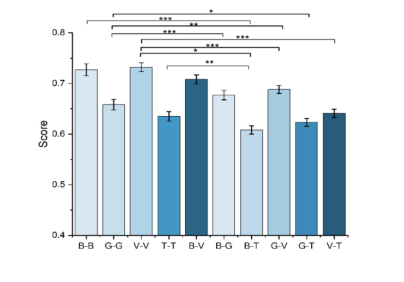
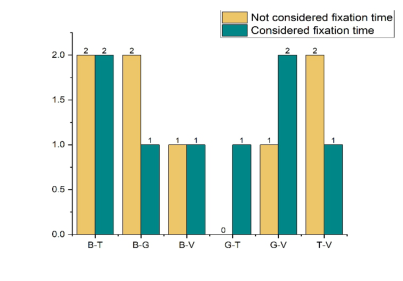
Figures 3 and 4 depict the further analysis of ScanMatch similarity scores between groups, with Figure 3 showing scenarios without considering fixa- tion duration, and Figure 6 showing scenarios with fixation duration taken into account. Post hoc comparisons were conducted using the Game-Howell test to identify significant differences among comparisons. Each between- group score corresponds to the analysis of variance for two within-group scores (considered/not considered fixation time). Therefore, if both were sig- nificant, a score of 2 was recorded; if one group was significant, a score of 1
Effects of Interactive Modality on the Spatiotemporal Characteristics 435
was recorded; and if neither was significant, a score of 0 was recorded. The significance scores are calculated and illustrated in Figure 5.
Figure 3: Between-group similarity score comparison post hoc analysis (not consid- ered fixation time).Figure 4: Between-group similarity score comparison post hoc analysis (considered fixation time).
The results show smaller within-group differences between the Base- line and Voice groups compared to the Baseline and Touchscreen or Ges- ture groups, especially when fixation duration is not considered. Scanning sequences for Touchscreen and Gesture are more alike. However, considering fixation duration, the most significant difference in scanning paths is between the Baseline and Touchscreen groups, while the least difference is between the Baseline and Voice groups. In both cases, Baseline-Touchscreen scores 2, and Baseline-Voice scores 1. Taking fixation duration into account increases similarity between Baseline-Gesture and Touchscreen-Voice groups.
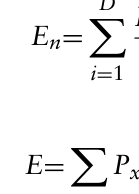
Fixation Entropy In aviation research, entropy is used to quantify the randomness of eye move- ments, with higher entropy indicating greater randomness or shorter average fixation durations, as well as scanning across multiple areas. Similarly, in driving research, Wang et al. (2017) applied fixation entropy to explore dis- parities in eye movement patterns during distracted driving. Their findings suggested no clear linear correlation between scanning and improved scan- ning characteristics. The mathematical formulations for fixation entropy are as follows:
E/Emax
D X
(2)
Equation reproduced from the original PDF.
Emax=log2D (4) In these expressions, En stands for the entropy value, E represents the infor- mation entropy, Emax is the maximum entropy, Pxi denotes the probability of fixating on a specific AOI, D denotes the number of AOIs, Txi is the aver- age fixation duration within a certain AOI, and i is the index of the AOI. A higher entropy rate indicates that the driver, within an equivalent time frame, fixated on more AOIs. If these AOIs are all related to driving tasks, it sug- gests a safer driving behavior. This is because it implies that the driver has a larger visual search scope and frequency, which is advantageous for detecting potential hazards.
Cluster analysis, as a type of “unsupervised learning,” is utilized when the label information of the input model is unknown. Its aim is to uncover the intrinsic characteristics and patterns within samples through learning. In our study, gaze point coordinates are represented by numerical series,
Effects of Interactive Modality on the Spatiotemporal Characteristics 437
with unknown categories, making clustering methods suitable for uncovering inherent patterns in these coordinates. Consequently, we employed the K- means clustering analysis method to identify regions and quantities of AOIs. The only hyperparameter requiring adjustment in this algorithm is K, which denotes the number of AOIs to be identified.
The clustering analysis method was used to determine the regions and quantity of AOIs. Different numbers of clusters, K = 4, 5, 6, were chosen. Through comparing the experimental results and considering the experimen- tal scenarios, the most suitable number of AOIs was determined to be 5. Based on this result, the AOIs were categorized as Road, Rearview Mirror, Dashboard, PAD, and Others.
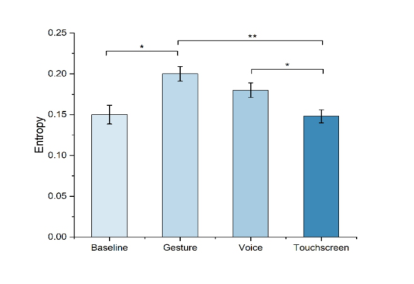
In this study, we analyzed segments from prompting tasks initiation to encountering emergencies. We calculated the entropy of these segments and checked the variance homogeneity of fixation entropy among the four exper- imental groups. After confirming the conditions were met, we illustrated the results of the analysis of variance in Figure 6. The findings reveal that the ges- ture group has the highest entropy, significantly surpassing the baseline and touchscreen groups. Meanwhile, the voice group’s entropy is notably higher than that of the touchscreen group. This indicates that the AOIs covered by gaze in the touchscreen and baseline groups are fewer, with relatively lower entropy values, whereas the opposite is observed for the gesture and voice groups.
Figure 6: Fixation entropy analysis results.
Transformation Characteristics Muñoz, Reimer, and Mehler (2015) introduced modalities for measuring and visualizing gaze behavior distribution, particularly attention movement within specific spatial areas. These “attention maps” are most fundamen- tally represented by a matrix indicating simple transition counts. However, a limitation of this matrix is its inability to compare transition counts when the total transitions vary. To address this, a transition probability matrix was introduced to normalize transition counts and measure transition characteristics based on transition probabilities.
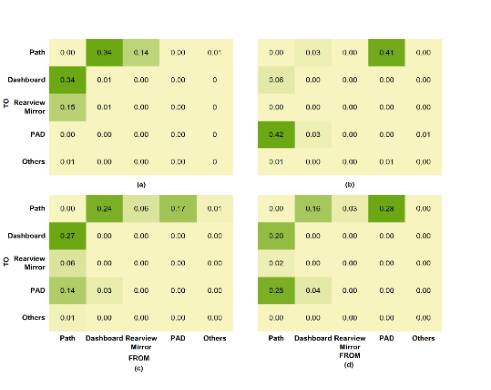
Grouped statistics of transition probabilities for all eye movement seg- ments were analyzed, and the summarized probability transition matrices for each group are shown in Figure 7. Figure (a) represents the baseline group, Figure (b) the touchscreen group, Figure (c) the voice group, and Figure (d) the gesture group.
Figure 7: Analysis results of visual transformation probability matrix.
Summarizing all AOIs, we can know the cumulative probability of fix- ations on AOIs. Due to rounding, the total sum of probabilities may not necessarily be 1. The results indicated that the probability of fixations on the road (to Road) exceeds 40% for all four groups, with the baseline group having the highest probability at 49%, and the touchscreen group having the lowest at 45%. The probability of fixations on the PAD (to PAD) was high- est for the touchscreen group at 46%, and did not exceed 30% for the other groups. In the touchscreen group, the combined probability of fixations on the PAD and dashboard (to PAD and to Dashboard) was 91%.
DISCUSSION
The different interactive modalities of IVIS significantly influence both the convenience and safety of using IVIS while driving. Comprehensive eye- tracking metrics provide a comprehensive assessment of information gath- ering, offering a more reliable evaluation of interactive modalities compared to single indicators. This study suggests that voice interaction has the least detrimental effect on driving. Consistent with these findings, Zhang et al. (2023) discovered that touchscreen interaction in commercial vehicle IVIS led to poorer driving performance, characterized by prolonged reaction times, reduced minimum time-to-collision, and increased variability in vehicle con- trol. This decline in driving performance could be attributed to the increased visual demand of focusing on the touchscreen, resulting in more frequent and
Effects of Interactive Modality on the Spatiotemporal Characteristics 439
prolonged glances away from the road. Angelini et al. (2016) also found that voice interaction requires fewer visual resources compared to touchscreen interaction, thus having a smaller impact on driving. Moreover, researchers have proposed alternative analysis methods for scanpaths. Dewhurst et al. (2012) validated the MultiMatch method for comparing scanpaths based on geometric vectors, which assesses differences across multiple dimensions such as shape, length, position, and duration. These findings can inform the design of IVIS and the development of real-time driver state monitoring systems (Zhang et al., 2024).
This study still has certain limitations, such as not considering the impact of the interaction interface on interaction when simulating IVIS. In the future, the research can be enhanced by incorporating the influence of interaction interfaces on human-machine interaction, thereby further refining the study of interactive modalities. Additionally, the experimental scenarios designed in this study were relatively limited. To enhance the robustness of the algorithm, it is advisable to introduce a broader range of distracted driving scenarios.
CONCLUSION
This study investigated the impact of three interactive modalities - touch- screen, gestures, and voice - on driving eye movement patterns through a driving simulation experiment. The aim was to explore modalities that min- imize negative effects on driving, reducing the likelihood of accidents caused by distractions from IVIS. Results indicate voice interaction has the least negative impact, while touchscreens cause the most distractions. Scanpath analysis suggests that the eye movement pattern of the voice group is most similar to the baseline group. Among the four experimental groups, the voice group has the highest entropy, with 81% probability of scanning AOIs benefi- cial for driving, such as the road, dashboard, and rearview mirror. This places the driving safety of the voice group just below that of the baseline group. In contrast, the touchscreen group has the lowest entropy, with a 46% prob- ability of shifting attention to the PAD, an AOI associated with distracted driving. Therefore, voice interaction is concluded to have the least negative impact on driving.
ACKNOWLEDGMENT
This work was supported by the Guangdong Basic and Applied Basic Research Foundation (grant number 2024A1515030219), the Foundation of Shenzhen Science and Technology Innovation Committee (grant number JCYJ20210324100014040), and the National Natural Science Foundation of China (grant number 72071170).
REFERENCES
Anderson, Nicola C., Fraser Anderson, Alan Kingstone, and Walter F. Bischof. 2015.
“A comparison of scanpath comparison methods.” Behavior Research Methods 47 (4): 1377–1392. doi: 10.3758/s13428-014-0550-3.
Angelini, Leonardo, Jürgen Baumgartner, Francesco Carrino, Stefano Carrino, Maurizio Caon, Omar Abou Khaled, Jürgen Sauer, Denis Lalanne, Elena Mugellini, and Andreas Sonderegger. 2016. “A comparison of three interaction modalities in the car: gestures, voice and touch.” Actes de la 28ième conference francophone sur l’Interaction Homme-Machine, Fribourg, Switzerland. Cristino, Filipe, Sebastiaan Mathôt, Jan Theeuwes, and Iain D. Gilchrist. 2010.
“ScanMatch: A novel method for comparing fixation sequences.” Behavior Research Methods 42 (3): 692–700. doi: 10.3758/BRM.42.3.692. Dewhurst, Richard, Marcus Nyström, Halszka Jarodzka, Tom Foulsham, Roger Johansson, and Kenneth Holmqvist. 2012. “It depends on how you look at it: Scanpath comparison in multiple dimensions with MultiMatch, a vector-based approach.”Behavior Research Methods 44 (4): 1079–1100. doi: 10.3758/s13428- 012-0212-2. Feng, Fred, Yili Liu, and Yifan Chen. 2018. “Effects of Quantity and Size
of Buttons of In-Vehicle Touch Screen on Drivers’ Eye Glance Behavior.” International Journal of Human–Computer Interaction 34 (12): 1105–1118. doi: 10.1080/10447318.2017.1415688. Lee, Seul Chan, Young Woo Kim, and Yong Gu Ji. 2019. “Effects of visual complexity of in-vehicle information display: Age-related differences in visual search task in the driving context.” Applied Ergonomics 81:102888. doi: https://doi.org/10. 1016/j.apergo.2019.102888. Li, Ning, and Linda Ng Boyle. 2019. “Allocation of Driver Attention for
Varying In-Vehicle System Modalities.” Human Factors 62 (8): 1349–1364. doi: 10.1177/0018720819879585. Ma, Jun, Zaiyan Gong, Jianjie Tan, Qianwen Zhang, and Yuanyang Zuo. 2020.
“Assessing the driving distraction effect of vehicle HMI displays using data mining techniques.” Transportation Research Part F: Traffic Psychology and Behaviour 69: 235–250. doi: https://doi.org/10.1016/j.trf.2020.01.016. Muñoz, Mauricio, Bryan Reimer, and Bruce Mehler. 2015. “Exploring new qualitative methods to support a quantitative analysis of glance behavior.” Proceedings of the 7th International Conference on Automotive User Interfaces and Interactive Vehicular Applications, Nottingham, United Kingdom. Needleman, Saul B., and Christian D. Wunsch. 1970. “A general method applica-
ble to the search for similarities in the amino acid sequence of two proteins.” Journal of Molecular Biology 48 (3): 443–453. doi: https://doi.org/10.1016/0022- 2836(70)90057-4. Wang, Yuan, Shan Bao, Wenjun Du, Zhirui Ye, and James R. Sayer. 2017. “Examining drivers’ eye glance patterns during distracted driving: Insights from scan- ning randomness and glance transition matrix.” Journal of Safety Research 63: 149–155. doi: https://doi.org/10.1016/j.jsr.2017.10.006. Zhang, Tingru, Xing Liu, Weisheng Zeng, Da Tao, Guofa Li, and Xingda Qu. 2023.
“Input modality matters: A comparison of touch, speech, and gesture based in- vehicle interaction.” Applied Ergonomics 108:103958. doi: https://doi.org/10. 1016/j.apergo.2022.103958. Zhang, Tingru, Jinfeng Yang, Milei Chen, Zetao Li, Jing Zang, and Xingda Qu. 2024.
“EEG-based assessment of driver trust in automated vehicles.” Expert Systems with Applications 246:123196. doi: https://doi.org/10.1016/j.eswa.2024.123196. Ziakopoulos, Apostolos, Athanasios Theofilatos, Eleonora Papadimitriou, and George Yannis. 2019. “A meta-analysis of the impacts of operating in- vehicle information systems on road safety.” IATSS Research 43 (3): 185–194. doi: https://doi.org/10.1016/j.iatssr.2019.01.003.
LISTED IN THE AHFE DIGITAL BOOKSTORE CATALOGUE
Explore the complete digital volume
Advances in Human Factors of Transportation
Read this individual research paper free through the original publisher, or explore the full digital proceedings book.
ISBN 978-1-964867-24-3
Explore this ISBN in the AHFE Bookstore ↗Listed in the July 2026 bookstore catalogue; search by ISBN to confirm current availability · Digital book purchase optional