Jinhui Huang, Tingru Zhang (2024). EEG-based Prediction of Driver Takeover Performance. In: Advances in Human Factors of Transportation. AHFE Open Access, vol. 148, pp. 418–429. https://doi.org/10.54941/ahfe1005233
In the context of conditional autonomous driving, ensuring a safe takeover is of paramount importance. While previous studies have delved into factors influencing drivers’ takeover performance, there remains a gap in research concerning the development of performance models capable of predicting takeover quality. To address this challenge, this study focuses on predicting driver takeover performance before the issuance of a takeover request based on Electroencephalogram (EEG) features. For this purpose, 72 subjects were recruited to participate in a driving simulation experiment, responding to a total of eight takeover events. Both their EEG signals and driving performance data were recorded. The takeover performance was subsequently categorized as high, medium, or low quality through a subjective review of the takeover process videos. A total of 480 EEG features, such as the power of α band, were extracted. Five machine learning models: Decision Trees (DT), Support Vector Machine (SVM), Random Forest (RF), Light Gradient Boosting Machine (LightGBM), and Multi-layer Perceptron (MLP), were utilized to develop the takeover performance prediction models. The results showed that the LightGBM model outperformed others, achieving an accuracy of 84.2% and an F1 score of 83.0%. In contrast, the DT model demonstrated the lowest performance, with an accuracy of 59.4% and an F1 score of 57.8%. This study underscores the potential of machine learning models in predicting driver takeover performance, thereby contributing to the advancement of machine learning applications in the field of autonomous driving.
With the rapid development of autonomous driving technology, this field holds immense potential in improving road safety, reducing traffic accidents, alleviating traffic congestion, and enhancing environmental benefits. How- ever, it also faces new challenges. One such challenge is the takeover transition in conditional autonomous driving (Zhou, Yang and Zhang, 2019). The Society of Automotive Engineers (SAE) in the United States has defined autonomous driving cars into six levels (SAE, 2018). According to this definition, drivers of Level 3 autonomous driving do not need to continu- ously monitor the driving environment and system performance (Naujoks, Purucker and Neukum, 2016). The driver is only required to take over control
EEG-Based Prediction of Driver Takeover Performance 419
of the vehicle when the vehicle encounters situations that the system cannot handle or when the automatic system fails. This is done by issuing auditory, visual, or tactile Takeover Request (TOR) to remind the driver to promptly resume manual driving (Wan and Wu, 2018).
The transition from autonomous driving to manual driving has received widespread attention. To facilitate takeover transitions, researchers have delved deeply into various factors affecting driver takeover performance, including the cognitive and emotional states of drivers when performing Non- Driving Related Tasks (NDRTs) (Du et al., 2020a), and their performance under different driving environments (Li et al., 2018). Drivers being in com- plex traffic environments and participating in NDRTs may lead to a decline in their attention, reducing the ability to correctly control automated systems, thereby posing a hidden danger to driving safety. In this sense, the prediction of takeover quality in L3 autonomous driving is necessary for safe takeover.
Research on predicting driver takeover performance using Machine Learn- ing and Deep Learning algorithms is increasingly gaining attention. For instance, Braunagel, Rosenstiel, and Kasneci (2017) developed an automated system that classifies the driver’s takeover readiness into low and high, with the best result based on the SVM classifier achieving an accuracy of 79%. Deo and Trivedi (2020) proposed a Long Short-Term Memory (LSTM) model for continuously estimating the driver’s takeover readiness index, with their best result achieving a Mean Absolute Error (MAE) of 0.449 in a 5-point takeover readiness index. Du et al. (2020b) used the driver’s physiological data and environmental parameters to classify the driver’s takeover performance into good and bad using the RF model, with the best accuracy reaching 84.3%.
In summary, many studies have conducted case analyses around the rela- tionship between takeover time and quality. However, fewer studies have focused on takeover performance modeling and prediction, and there are still some research gaps to be addressed. Firstly, although existing research has explored the relationship between ECG and EDA physiological signals and eye movement behavior with takeover performance, it is still unclear whether EEG signals can be used to predict driver performance during inter- actions with Autonomous Vehicles. Secondly, the exploration of machine learning methods in this field is limited. It is currently unclear whether better evaluation models can be developed by exploring various machine learning algorithms. This study aims to collect EEG signals and compare the results of various machine learning takeover performance evaluation models to address the aforementioned research gaps, which will help to better understand the relationship between physiological signals and driving takeover, and better develop potential applications of driving assistance systems.
EXPERIMENT DESIGN Experiment Subject
For the driving experiment, we recruited a diverse group of 72 participants, evenly split with 36 males and 36 females. The participants were young adults, with an average age of 22.6 years (standard deviation = 1.6), and ages ranging from 18 to 28 years. Each participant was a licensed driver with
420 Huang and Zhang
either normal or corrected-to-normal vision. To ensure their optimal health status for the experiment, they were instructed to abstain from any drugs or alcohol for at least 24 hours prior to the experiment.
Experiment Equipment
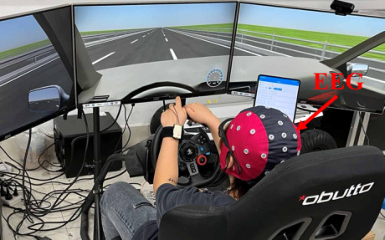
Figure 1 provides an overview of the driving simulator, a Huawei MatePad Pro tablet, and the EEG recording device used in this experiment. The driving simulator includes three 27-inch LED monitors, a high-performance com- puter, a Logitech steering wheel, brake and accelerator pedals, and a driver’s seat. The simulator is equipped with UC-Win/Road software, which offers various driving scenarios and records driving data at a frequency of 60Hz. The simulator can operate in manual or automatic mode, and a start/stop but- ton for the autonomous driving function is installed on the steering wheel. The Huawei MatePad Pro tablet, with a screen size of 10.8 inches, is placed on the right side of the steering wheel, simulating the position of the central control panel in actual vehicles.
The EEG signals of the experiment participants were collected through ANT Neuro. It has 32 EEG channels and records EEG signals at a frequency of 500Hz. The placement of the electrodes follows the international 10–20 system. To ensure the best signal quality, the contact impedance between the electrodes and the participant’s skin is kept below 20 k.
Figure 1: EEG and other equipment used in the experiment.
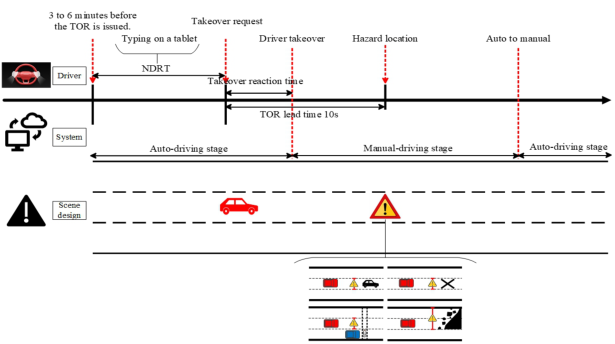
Experiment Design The experiment adopted a mixed design of gender (male vs. female, between- subject variable) × eight TOR scenarios (4 types of hazards × 2 levels of road curvature, within-subject variable). A two-way 95-kilometer-long road was created for the experiment, with three lanes in each direction, to simu- late urban driving scenarios. Participants were instructed to maintain their position in the middle lane. TOR would be triggered when the autonomous driving system could not handle an upcoming hazard, necessitating the trans- fer of vehicle control to the driver. The experiment developed eight TOR scenarios, with four types of hazards being a broken-down vehicle, road con- struction, pedestrian crossing, and landslide, and two types of road curvature being a straight road and a sharp turn with a radius of 200 meters.
EEG-Based Prediction of Driver Takeover Performance 421
As shown in Figure 2, participants initially drove in autonomous mode, with the system maintaining a constant speed of 100 kilometers per hour. Participants were free to perform NDRT of their choice, with the NDRT in this experiment being a typing task, primarily serving as a visual manual inter- ference, where participants needed to accurately input the displayed Chinese characters on a tablet computer. In most cases, the TOR was presented in a standardized format, triggered when the participant’s vehicle was approxi- mately 10 seconds away from an obstacle. The TOR included a 75-decibel sine sound (2010 Hz, duration 0.47 seconds) and a red text prompt displayed in the lower area of the windshield. At the start of the TOR, participants needed to press the X button on the steering wheel, switch to manual driving, and handle the imminent obstacle.
Figure 2: Diagram of experimental design.
Experimental Procedure Upon arrival at the experimental site, the participants completed a demo- graphic questionnaire and were briefly introduced to the purpose and pro- cedure of the experiment. Subsequently, they read and signed an informed consent form. Next, they underwent a 10–15 minutes driving practice session, which primarily included: manually driving the vehicle and accelerating to 120 km/s, quick lane changes, emergency braking, turning corners, switching to autonomous driving mode, taking over the vehicle and avoiding hazards, etc. In addition, the participants familiarized themselves with the secondary task of typing on a tablet and completed a combination of the tablet typing task and vehicle takeover. Afterwards, the participants put on an EEG cap and began the official driving phase. Throughout the entire experiment, they were required to comply with road traffic regulations and TOR. The entire experiment lasted approximately 60 minutes.
MODELING OF TAKEOVER PERFORMANCE EEG data were collected for this study. However, due to technical issues with the driving simulator and physiological sensors, the data from 3
422 Huang and Zhang
participants had to be excluded. Consequently, we were left with usable data from 69 participants for further analysis. The raw data underwent preprocessing, followed by feature extraction and selection, as well as the establishment of ground truth. Following this, a five-fold cross-validation method was employed to adjust the hyperparameters, train the model, and make predictions. The predicted results were then compared with the actual results.
Data Pre-Processing For the EEG data, this study first applied a zero-phase Finite Impulse Response (FIR) band-pass filter, selecting a frequency range of 0.5Hz-30Hz, to eliminate noise and unwanted frequency components. Following this, the Krutosis function was used to automatically check for bad leads, and the Spherical function was used to interpolate these bad leads. Subsequently, Independent Component Analysis (ICA) was employed to decompose the EEG signals, identify artifacts and noise such as electrooculography and elec- tromyography, and manually remove them. After completing these steps, the EEG signals were re-referenced and downsampled, reducing the sampling rate to 100Hz. These processing steps were carried out to ensure the quality and accuracy of the signals.
Feature Generation By comparing the modeling results of different time periods, data from X seconds before the TOR was issued to the time the TOR was issued was selected for feature extraction. The values of X were 5, 7, 10, 15, 20, 30, 40, 50, and 60. Using one-way ANOVA, it was found that the modeling accuracy was best with a 20-second time window (F (8,1926) = 298.7, p <0.001). Referring to the research of Du et al. (2020b) and Alambeigi et al. (2023), this study chose a sliding time window size of 3s with an overlap rate of 67% (i.e., a step size of 1s) to slice the data for each scenario time period.
Scholars in the field of data science seem to believe that data clustering can improve the quality of classification (Khan, 2017). Some research sug- gests using the original features in combination with the features generated by clustering (Piernik and Morzy, 2021), as this can simplify the model by combining the features after clustering, reduce the risk of overfitting, improve robustness against outliers, and retain all the information of the original fea- tures. This study found that using the original features in combination with the clustering features can improve model performance.
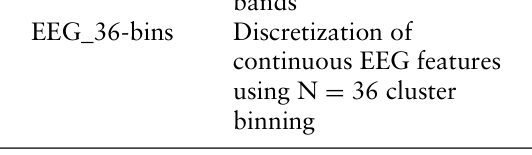
This study used EEG data and calculated frequency domain features, including the amplitude (AMP) and power spectral density (PSD) of δ waves (1–4Hz), θ waves (4–8Hz), α waves (8–13Hz), and β waves (13–30Hz). Therefore, a total of 8 frequency domain features were obtained (4 frequency bands × 2 features). Since there are 32 channels in the whole brain, exclud- ing the M1 and M2 reference electrodes on the left and right sides of the ear, a total of 240 frequency domain features were obtained. Finally, this study used N = 36 cluster binning for all continuous EEG features to obtain dis- crete EEG features and merge them with the original EEG features. A total
EEG-Based Prediction of Driver Takeover Performance 423
of 480 (4×2×30×2) EEG features were extracted. To reduce the potential impact of individual differences, this study used the Z-score normalization method to process the feature values between participants. All generated feature columns are in Table 1.
Table 1. Description of generated features.
Table available in the original PDF paper.
Feature Name Explanation
Physiological Signal
Feature Category EEG Frequency Domain Features (µV2/Hz) PSD Energy distribution and intensity of the EEG signal in the δ, θ, α, and β wave frequency bands Amplitude (µV)
AMP Amplitude of the EEG signal in the δ, θ, α, and β wave frequency bands Clustering Binning
Equation reproduced from the original PDF.
Feature Selection and Ground Truth In this study, a feature selection method based on Logistic Regression (LR) and Recursive Feature Elimination (RFE) was used (Inza et al., 2004). This effectively reduced the number of features and improved the predictive per- formance of the model. After feature selection, based on the highest average accuracy of the five models, a total of 130 features were selected under the EEG modality.
This study used a video-based Take-Over Controllability (TOC) score to evaluate takeover performance (Naujoks et al., 2018), quantifying the driver’s control ability during the takeover process. Our three raters under- went specialized training and gave an overall rating score (1∼10) by watching the takeover process videos. According to the evaluation process, the raters assessed whether the takeover was controllable, safe, or whether the takeover was good or even perfect. More detailed information and training materials can be obtained at www.toc-rating.de/en. In this study, scores of 1–3 were classified as high takeover performance, 4–6 as medium takeover perfor- mance, and 7–10 as low takeover performance. The final dataset obtained in this study included 199 high takeover performance labels, 206 medium takeover performance labels, and 108 low takeover performance labels.
Model Development In order to construct a takeover performance prediction model, this study employed five machine learning algorithms, including DT, SVM, RF, Light- GBM, and MLP. These models excel in handling high-dimensional data and
424 Huang and Zhang
discovering complex patterns within the data, while also offering strong interpretability (Zhang et al., 2024).
Considering the quantity of existing data samples and previous research, this study chose the five-fold cross-validation method to train and compare the test results of the models. The hyperparameters of each model were also optimized. The training, testing, and evaluation of the algorithms in this study were all conducted in a Python 3.7 environment.
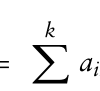
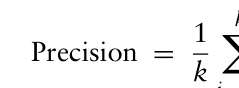
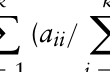
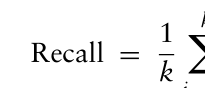
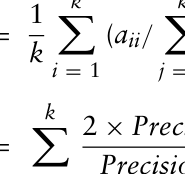
Model Evaluation To evaluate the performance of the model, using a single evaluation metric is not comprehensive enough. Therefore, this study selected five commonly used evaluation metrics: Accuracy, Precision, Recall, F1-score, and Area Under the Curve (AUC), which are used to evaluate the performance of the takeover performance model. The AUC metric comes from the ROC curve, which is a useful tool for evaluating the performance of classifiers. For multi-category tasks, the confusion matrix is a k × k matrix, where the cell aij, i, j ∈ [1, k] represents the frequency of samples with the true category Ci and the predicted category Cj. In addition, the metrics used to evaluate algorithm performance are defined as follows:
k X
k X
Equation reproduced from the original PDF.
k X
k X
Equation reproduced from the original PDF.
aij) (2)
Equation reproduced from the original PDF.
k X
k X
Equation reproduced from the original PDF.
aji) (3)
Equation reproduced from the original PDF.
2 × Precision (i) × Recall(i) Precision (i) + Recall(i) (4) i = 1 For the best-performing model, its confusion matrix is analyzed to evaluate its specific performance in the takeover performance classification task. In addition, the Out-of-Bag Error (OOB) method of Random Forest is used to rank the importance of features (Gregorutti, Michel and Saint-Pierre, 2017). This technique helps to identify the most influential features in the takeover performance evaluation model.
RESULTS
To ensure the robustness of the machine learning models in this study, we conducted five-fold cross-validation using 43 different random seeds for each machine learning method under each time window. Firstly, this study used a paired T-test to compare the best machine learning model with the other four models, to determine whether LightGBM has the best performance. In
EEG-Based Prediction of Driver Takeover Performance 425
addition, this study analyzed the top fifteen most important features of the optimal model.
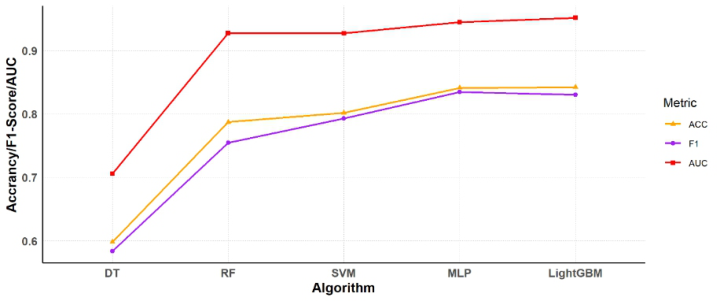
Model Evaluation Under the EEG feature modality, the results of different models are shown in Figure 4. It can be observed that the MLP and LightGBM models achieved better model performance.
Figure 3: Accuracy, F1 score, and AUC values of five machine learning models.
Further, this study conducted a paired T-test on the predictive performance of the LightGBM model compared with the other four machine learning mod- els. Table 3 shows that under a 20-second time window, the LightGBM model significantly outperforms the other four machine learning models in terms of accuracy, and significantly outperforms the DT, RF, and SVM models in terms of F1 score. The accuracy of the LightGBM model is 83.5%, and the F1 score reaches 82.1%.
Table 2. Comparison of average accuracy and F1 score of different models with the optimal model lightGBM under different time windows.
Table available in the original PDF paper.
Algorithm Accuracy F1-score p-value Mean SD t-test statistic p-value Mean SD t-test statistic
Confusion Matrix and Feature Importance Analysis This section intends to conduct an in-depth analysis of the optimal model, LightGBM, obtained earlier. The confusion matrix of the optimal model with
426 Huang and Zhang
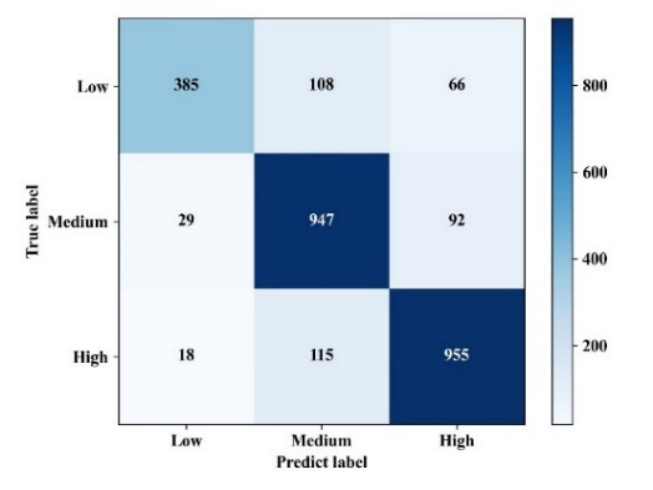
the best random seed of 19 is shown in Figure 5. The accuracy is 84.2%, the precision is 85.3%, the recall rate is 81.8%, the F1 score is 83.0%, and the AUC value is 95.2%. The results show that LightGBM has effectively learned the samples of medium takeover performance and high takeover per- formance. However, there are still some challenges in predicting samples with low takeover performance, with an accuracy of only 68.9%.
Figure 4: Confusion matrix of the lightGBM model with a time window of 20 seconds.
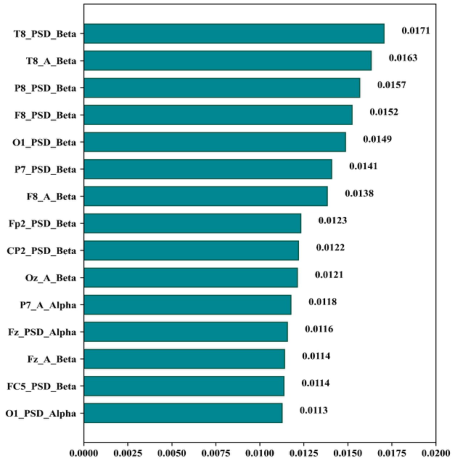
This study estimated the model feature importance through the OOB method of the random forest. Figure 6 shows the ranking of the top 15 feature importance in the driver takeover performance recognition model built based on EEG modality signals. The results show that 12 features come from the β band, and 3 come from the α band, indicating that for takeover performance prediction, the β and α bands play a more impor- tant role than the δ and θ band features. It is worth noting that the two most important features both come from the β band of the T8 channel. This may be due to the location of the T8 channel and the characteristics of the EEG physiological signals it records. The T8 channel is located on the right side of the scalp, close to the temporal lobe, which plays an important role in many cognitive and perceptual tasks. The EEG physiological signals of the β band are usually related to activities such as cognitive processing speed (Jenkinson and Brown, 2011). Therefore, the β band signal of the T8 chan- nel may have captured important information about the driver’s takeover performance.
EEG-Based Prediction of Driver Takeover Performance 427
Figure 5: The top fifteen important features with a time window of 20 seconds.
CONCLUSION
This study addresses the problem of predicting driver takeover performance in the context of conditional autonomous driving, using EEG signal fea- tures to construct a takeover performance prediction model. By comparing five machine learning models: DT, SVM, RF, LightGBM, and MLP, it was found that the LightGBM model performed best in predicting takeover per- formance, with an accuracy of 84.2% and an F1 score of 83.0%. In addition, the study also found that EEG features in the β and α bands play an important role in predicting takeover performance, especially the β band signals from the T8 channel, which contribute significantly to the prediction of takeover performance.
This study not only emphasizes the potential of machine learning models in predicting driver takeover performance, but also provides a new approach in the field of autonomous driving, i.e., using EEG features to assess the perfor- mance of drivers during the takeover process. This can help further optimize the design of autonomous driving systems, improving the safety and com- fort of drivers during the takeover process. Future research can continue to explore more EEG features and other physiological and behavioral features in the application of takeover performance prediction, providing more com- prehensive theoretical support and practical guidance for the development of the autonomous driving field.
ACKNOWLEDGMENT
This work was supported by the Guangdong Basic and Applied Basic Research Foundation (grant number 2024A1515030219) and the Foun- dation of Shenzhen Science and Technology Innovation Committee (grant number JCYJ20210324100014040).
428 Huang and Zhang
REFERENCES
Alambeigi, Hananeh, Anthony D. McDonald, Michael Manser, Eva Shipp, John Lenneman, Elizabeth M. Pulver, and Scott Christensen. 2023. ‘Predicting Driver Errors during Automated Vehicle Takeovers.’ Transportation Research Record 2677 (9): 410–420. doi: https://journals.sagepub.com/doi/abs/10.1177/ 03611981231159122. Braunagel, C., W. Rosenstiel, and E. Kasneci. 2017. ‘Ready for Take-Over? A
New Driver Assistance System for an Automated Classification of Driver Take- Over Readiness.’ IEEE Intelligent Transportation Systems Magazine 9 (4): 10–22. doi: https://doi.org/10.1109/MITS.2017.2743165. Deo, Nachiket, and Mohan M. Trivedi. 2020. ‘Looking at the Driver/Rider in Autonomous Vehicles to Predict Take-Over Readiness.’ IEEE Transactions on Intelligent Vehicles 5 (1): 41–52. doi: https://doi.org/10.1109/tiv.2019.2955364. Du, Na, Feng Zhou, Elizabeth M. Pulver, Dawn M. Tilbury, Lionel P. Robert,
Anuj K. Pradhan, and X. Jessie Yang. 2020a. ‘Examining the effects of emo- tional valence and arousal on takeover performance in conditionally automated driving.’ Transportation Research Part C: Emerging Technologies 112: 78–87. doi: https://doi.org/10.1016/j.trc.2020.01.006. Du, Na, Feng Zhou, Elizabeth M. Pulver, Dawn M. Tilbury, Lionel P. Robert, Anuj K.
Pradhan, and X. Jessie Yang. 2020b. ‘Predicting driver takeover performance in conditionally automated driving.’ Accident Analysis & Prevention 148:105748. doi: https://doi.org/10.1016/j.aap.2020.105748. Gregorutti, Baptiste, Bertrand Michel, and Philippe Saint-Pierre. 2017. ‘Correlation and variable importance in random forests.’ Statistics and Computing 27 (3): 659–678. doi: https://doi.org/10.1007/s11222-016-9646-1. Inza, I., P. Larranaga, R. Blanco, and A. J. Cerrolaza. 2004. ‘Filter versus wrapper
gene selection approaches in DNA microarray domains.’ Artif Intell Med 31 (2): 91–103. doi: https://doi.org/10.1016/j.artmed.2004.01.007. Jenkinson, N., and P. Brown. 2011. ‘New insights into the relationship between dopamine, beta oscillations and motor function.’ Trends Neurosci 34 (12): 611–8. doi: https://doi.org/10.1016/j.tins.2011.09.003. Khan, M. 2017. ‘Kmeans clustering for classification.’ Li, Shuo, Phil Blythe, Weihong Guo, and Anil Namdeo. 2018. ‘Investigation of older
driver’s takeover performance in highly automated vehicles in adverse weather conditions.’ IET Intelligent Transport Systems 12 (9): 1157–1165. doi: https://do i.org/10.1049/iet-its.2018.0104. Naujoks, Frederik, Christian Purucker, and Alexandra Neukum. 2016. ‘Secondary task engagement and vehicle automation – Comparing the effects of different automation levels in an on-road experiment.’ Transportation Research Part F: Traffic Psychology and Behaviour 38: 67–82. doi: https://doi.org/10.1016/j.trf. 2016.01.011. Naujoks, Frederik, Katharina Wiedemann, Nadja Schömig, Oliver Jarosch, and
Christian Gold. 2018. ‘Expert-based controllability assessment of control tran- sitions from automated to manual driving.’ MethodsX 5: 579–592. doi: https: //doi.org/10.1016/j.mex.2018.05.007. Piernik, Maciej, and Tadeusz Morzy. 2021. ‘A study on using data clustering for feature extraction to improve the quality of classification.’ Knowledge and Infor- mation Systems 63 (7): 1771–1805. doi: https://doi.org/10.1007/s10115-021- 01572-6. SAE. 2018. ‘Taxonomy and definitions for terms related to driving automation
systems for on-road motor vehicles -SAE international. (J3016B).’
EEG-Based Prediction of Driver Takeover Performance 429
Wan, Jingyan, and Changxu Wu. 2018. ‘The Effects of Vibration Patterns of Take-Over Request and Non-Driving Tasks on Taking-Over Control of Auto- mated Vehicles.’ International Journal of Human–Computer Interaction 34 (11): 987–998. doi: https://doi.org/10.1080/10447318.2017.1404778. Zhang, Tingru, Jinfeng Yang, Milei Chen, Zetao Li, Jing Zang, and Xingda Qu. 2024.
‘EEG-based assessment of driver trust in automated vehicles.’ Expert Systems with Applications 246. doi: https://doi.org/10.1016/j.eswa.2024.123196. Zhou, Feng, X. Jessie Yang, and Xin Zhang. 2019. ‘Takeover Transition in Autonomous Vehicles: A YouTube Study.’ International Journal of Human- Computer Interaction 36: 1–12. doi: https://doi.org/10.1080/10447318.2019. 1634317.
LISTED IN THE AHFE DIGITAL BOOKSTORE CATALOGUE
Explore the complete digital volume
Advances in Human Factors of Transportation
Read this individual research paper free through the original publisher, or explore the full digital proceedings book.
ISBN 978-1-964867-24-3
Explore this ISBN in the AHFE Bookstore ↗Listed in the July 2026 bookstore catalogue; search by ISBN to confirm current availability · Digital book purchase optional