Mark Fleming, Rebecca Cairns (2024). Safety Culture Indicators - For Improvement Not Assessment. In: Advances in Human Factors of Transportation. AHFE Open Access, vol. 148, pp. 497–506. https://doi.org/10.54941/ahfe1005241
This paper presents the findings of an evidence-based review of safety culture indicators and their applicability to the railway industry. Safety culture continues to be a major area of interest for railway companies in many countries. Much of the research focus has been on the development and evaluation of assessment methodologies. More recently many railway regulators have produced guidance on safety culture (e.g., EU Railway Safety Agency, Transport Canada). Some regulators are also incorporating safety culture into their oversight activities. For example, in the UK the Office of Road and Rail includes culture in its RM3 process and in the USA the Federal Railroad Administration has conducted a supplemental safety audit of Norfolk Southern to assess its overall safety culture. There is now an interest from both companies and regulators to use safety culture indicators. To identify potential safety culture indicators, an environmental scan was conducted to identify existing safety culture indicators. We identified 154 safety culture indicators from a range of sources (e.g., RM3, Railway Association of Canada, Canada Energy Regulator). These indicators varied widely in how they were developed, their intended purpose, and their target industry. The second phase of research involved interviewing eight subject matter experts (SMEs) to create an evidenced-based framework for evaluating the indicators. We used thematic analysis to identify three criteria of importance. Firstly, indicators need to be related to safety culture, secondly, practical/collectable, and thirdly they need clear assessment criteria. Using these criteria, we refined the original list of indicators in two phases by getting SMEs to rate the indicators. Two separate groups of six SMEs rated the indicators. The indicators that had low scores on these criteria were removed. We retained 27 indicators after two independent rounds of assessment. This research reveals that many safety culture indicators have been created with limited or no evaluation. The fact that we only retained 27, questions the quality of many of these indicators. These indicators can only provide limited insight into safety culture and are not a replacement for a safety culture assessment, but they may assist organizations in identifying improvement opportunities. This paper outlines potential ways that the indicators could be used in practice, resources required, data collection and interpretation strategies. The paper concludes by outlining the limitations of the research and potential future directions.
It is nearly 40 years since the term safety culture was identified as a contrib- utory factor in the Chernobyl disaster (IAEA, 1986). An interesting finding from Chernobyl and other major disaster inquiries is that those involved in
the incident believed that they were acting appropriately, and those who had concerns failed to question decisions (Fleming et al., 2018). Many disaster investigation reports have concluded that the prevention of future disasters involves creating and maintaining a positive safety culture. Ever since the term safety culture was first coined, there has been a lack of clarity about the nature of the construct. In fact, the original IAEA report (IAEA, 1986) into Chernobyl did not define the term. The abstract nature of safety culture makes it hard to understand, the late Barry Turner likened defining safety culture to nailing jelly (Jell-O) to a wall, it always seems to slip through your fingers (Guldenmund, 2021).
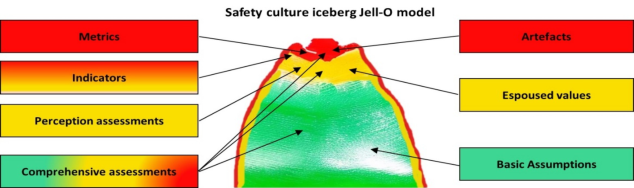
Since the term safety culture was coined without reference to research evi- dence, many researchers have drawn on previous work on organizational culture, especially the work of Edgar Schein. Schein (1990) proposed that culture consists of three layers, namely Artefacts, Espoused values, and Basic assumptions. Based on Dr. Turner’s insights, Figure 1 illustrates the struc- ture of safety culture with an iceberg Jell-O cake metaphor. This metaphor highlights the relative contribution of each layer, with Jell-O representing the elusive nature of culture. At the visible level, artifacts symbolize tangi- ble cultural elements, like designated parking for safety managers, which are easily noticed but often misinterpreted. The middle layer, espoused values, represents what people say about safety, such as slogans (e.g., no job is too important not to be done safely) and stated priorities. However, these expres- sions may only superficially align with the organization’s actual values. The deepest and most substantial layer, basic assumptions, embodies the orga- nization’s ingrained, often unconscious beliefs. These beliefs influence the organization’s worldview and its response to new information.
Figure 1: Safety culture model.
In recent years regulators of high hazard industries have started to include safety culture as a part of their oversite activities, by introducing new regula- tions and guidance. Some regulators require the companies that they regulate to conduct regular safety culture assessments (e.g., Canadian Nuclear Safety Commission), while others have incorporated safety culture into their Safety Management System regulations (e.g., UK Office of Road and Rail). Many organizations conduct safety culture assessments that include surveys, inter- views, and focus groups (Cole, Stevens-Adams & Wenner, 2013). While these assessments are insightful, they primarily capture the surface level of espoused values. Concerns have been raised about the utility of employee perceptions as an indicator of safety culture (Hopkins, 2006). Antonsen
Safety Culture Indicators - For Improvement not Assessment 499
(2009) investigated if safety culture assessments based on employee percep- tions could forecast major safety incidents in organizations. He analyzed two assessments from the Norwegian oil and gas platform Snorre Alpha, which experienced a significant incident in 2004. Before the incident, the rig’s workers had completed a safety survey indicating a generally positive safety culture. However, post-accident investigations contradicted these find- ings, uncovering several safety culture issues. This highlights the limitations of using perceptions as the primary source of insight into an organiza- tion’s safety culture. It is therefore important to explore a wider range of approaches to gaining insight into an organization’s safety culture. In response to these concerns, some industries (e.g., nuclear) have adopted a comprehensive approach to safety culture assessment. Comprehensive assessments are more resource-intensive, involving diverse data sources like document analysis, surveys, interviews, focus groups and observations. Com- prehensive assessments provide a deeper understanding of an organization’s safety culture. These assessments adopt qualitative research methods and therefore the results can appear more subjective, as they tend not to produce numerical values.
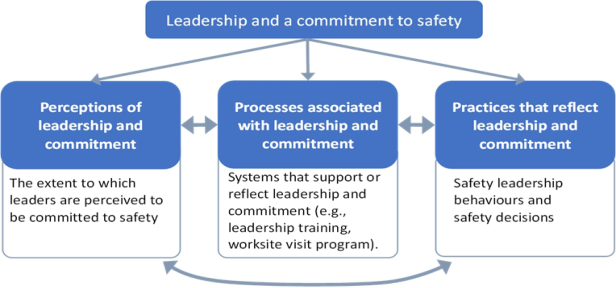
Figure 2: How safety culture is reflected in practice.
Despite the abstract nature of safety culture, it impacts how safety is managed, through behaviors, systems, and priorities. Insights into safety cul- ture can be gleaned by evaluating perceptions, processes, and actions (see Figure 2). For instance, the safety culture element of “leadership and com- mitment to safety” is reflected in the perceived dedication of leaders, the established procedures encouraging leader commitment, and the actual prac- tices of leaders. Therefore, it should be possible to gain insight into safety culture by capturing perceptions, processes, and practices, without perform- ing a comprehensive assessment (i.e., by using indicators). Indicators may offer valuable insights into safety culture but must be validated before use. Indicators are not replacements for comprehensive safety culture assessments. Much like comparing a health tracker to a full medical exam, they provide valuable data but cannot capture the comprehensive picture.
The resource intensive nature of comprehensive assessments means that they are conducted infrequently (every 3–5 years), and therefore,
500 Fleming and Cairns
organizations may want to gain insight into their culture between assess- ments. This has resulted in an increased interest in safety culture indicators. There has also been increased interest from regulators into the development of tools to enable regulators to gain insight into a company’s safety cul- ture through using indicators (e.g., Canada Energy Regulator). It is therefore important to evaluate the utility of safety culture indicators.
However, the reliability of indicators and metrics can be compromised by how they are measured and used. Goodhart’s Law (Goodhart, 1984) is likely to apply, because if safety culture metrics become targets, their ability to reflect genuine changes in safety culture diminishes, instead reflecting the organization’s efforts to meet set targets. Using metrics as a target erodes the metric’s utility in representing the actual state of safety culture.
Methodology
This study was conducted during 2022 and involved a comprehensive review of existing literature on safety culture to identify metrics and indi- cators. The indicators identified were then evaluated. The evaluation stage involved developing a robust, evidence-based framework for categorizing and assessing indicators.
Stage one involved an extensive environmental scan, aiming to gather a broad range of information on safety culture indicators used across various industries, with a particular focus on those applicable to the railway sector. The environmental scan included academic articles, industry reports, reg- ulatory documents, and case studies. Peer-reviewed articles were identified by searching PsycINFO database, EBSCO and Google Scholar. Any articles that were not peer-reviewed were excluded. Only articles that focused on high hazard industries were included (e.g., mining, oil & gas, etc.). Any articles that focused on the healthcare or food industry were excluded as these were not relevant to the study. The initial search identified 321 poten- tial articles, which was reduced to 71 when non-peer reviewed articles were removed. This was further reduced to 42 when non-safety critical indus- tries were excluded. When these were examined only eight were retained as being relevant. The review also identified four non peer reviewed documents describing the development of safety culture metrics and indicators.
The second stage entailed a rigorous assessment of the indicators iden- tified in stage one. The safety culture indicators identified were initially subjected to a systematic reduction process, employing a q-sort methodology to assess their alignment with safety culture. This q-sort, a robust method involving SMEs categorizing items based on their relevance to a specific category, is useful in determining the face validity of the indicators (Nahm et al., 2002). It was also necessary to develop valid criteria to evaluate the indicators that passed the face validity stage. Eight subject matter experts were interviewed to develop the evaluation framework. SMEs were carefully selected to represent a diverse range of expertise (safety culture experts and industry practitioners), including academics, safety managers, operational leaders, and regulatory representatives. This diversity ensured a compre- hensive understanding of safety culture from multiple perspectives. Utilizing
Safety Culture Indicators - For Improvement not Assessment 501
semi-structured interviews with safety culture SMEs, an evaluative frame- work was developed. This framework was used to rate indicators based on their relevance to safety culture, practicality, and explicit evaluation criteria. The six SMEs assessed the indicators based on their clarity, applicability, and relationship to safety culture, utilizing a four-point Likert Scale.
Findings This scan identified a wide range of safety culture indicators and metrics, developed by a range of organizations: the Canadian Energy Regulator (CER, 2021), the Centre for Chemical Process Safety (CCPS) (American Institute of Chemical Engineers, 2018), Fleming et al. (2015), and the Railway Asso- ciation of Canada (RAC, 2019). These varied from quantitative metrics to qualitative indicators of safety culture. The term metrics is used when the result is a number, for example “All injuries (ratio measured year over year)”, while indicators were qualitative in nature. Metrics are highlighted in italics in Table 1 below. In total 154 unique safety culture indicators or metrics were identified. The 154 identified in stage one, were screened for face valid- ity using the q-sort. Indicators or metrics that were not clearly related to safety culture or elicited inter-rater disagreement were discussed and subse- quently removed, leading to the exclusion of 35 indicators. The refinement process continued with the remaining 119 indicators being evaluated by six SMEs, experts in both scale development and safety. A separate group of six SME raters reviewed the indicators for clarity, relatedness to safety culture, practicality, and applicability. Only indicators where the mode (most com- mon number) SME rating was above a three on the four-point scale were kept. Twenty-four indicators and four metrics met the cut-off criteria (see Table 1).
Table 1. Retained safety culture indicators.
Table available in the original PDF paper.
Clarity
Relatedness
Practicality
Applicability
Mode of Total
Rating
3 3 4 4 4
Leaders attend safety training and participate in safety system reviews. 4 4 4 4 4 The quality of the feedback an employee receives. 3 4 3 4 4 Hazards, risks, and related controls are communicated throughout the organization and beyond.
4 4 3 4 4
Involvement of employees in development of procedures 4 4 4 4 4 Employees participate in setting safety standards and rules. 4 4 3 4 4 Employees participate in the investigation of incidents, including near misses.
3 3 3 4 3
Employee-led safety related decisions (capture informational and bottom-up engagement opportunities)
4 4 4 4 4
Safety performance indicators are tracked, trended, evaluated, and acted upon.
3 4 4 4 4
Incident investigation aims to identify the failed system defenses and improve them.
(Continued)
502 Fleming and Cairns
Table 1. Continued
Table available in the original PDF paper.
Practicality
Applicability
Clarity
Relatedness
Mode of Total
Rating
3 4 4 4 4
Quality of near miss reports 3 3 4 4 4 Sophisticated information systems are used to collect and analyze data from a range of internal sources (e.g.: incidents, hazard reports, maintenance system data, inspections, audits, and reviews).
4 3 4 4 4
All issues identified by investigations are resolved in a timely manner across the organization. The effective implementation of improvement actions is tracked.
4 3 4 4 4
Risk assessments are conducted, and mitigation measures are developed, implemented, and assessed for effectiveness.
3 3 3 4 3
The nature and quality of near miss reports is a reflection of the culture. High quality near miss reports are those that provide detailed description of an event that may not have been detected.
4 4 3 4 4
There is robust oversight and monitoring of contractor performance, including direct surveillance and auditing of adherence to obligations as noted in all bridging documents.
3 4 4 4 4
Clear delegation of roles, responsibilities, authorities and accountabilities for health and safety are aligned and integrated into the operation of the organization
3 3 3 4 3
Those with responsibilities for health and safety are motivated and held accountable for performance in-line with systems and methods used for other parts of the business.
3 4 3 4 4
Employees are clear that they will be treated fairly if they are involved in a near-miss or incident.
3 4 3 4 4
Mistakes, errors, and mental lapses are treated as an opportunity to learn rather than find fault or blame.
4 4 3 4 4
Personnel (regardless of position) report feeling empowered to stop work and/or suspend operations as the first line of defense against an incident
4 4 4 4 4
The potential for conflict between health and safety and other business objectives is acknowledged and minimized and there is a process for resolving conflicts
3 4 3 4 4
The aging of action items related to risks determined to be in the category “reduce as soon as possible”.
3 4 3 4 4
Timely action is taken to mitigate hazards even when it is costly to do so. 3 4 3 4 4 Timely corrective and preventive actions are taken when deficiencies and hazards are detected.
3 4 3 4 4
A questioning attitude prevails at all levels of the organization. 3 4 2 4 3 Evidence that hazards and risks are disregarded in HA/HIRA, MOC and operational readiness.
3 3 3 4 3
Personnel are able to provide multiple examples of proactively receiving adequate resources to resolve safety issues once identified.
CONCLUSION
As the title suggests, safety culture indicators should be used to identify improvement opportunities rather than as an assessment tool. The narrow focus of indicators means that they are not well suited to determining the health of an organization’s safety culture. However, they can identify oppor- tunities for improvement or track the progress of improvement initiatives. In addition, the vast majority of the safety culture indicators identified in this study failed to meet our criteria. This highlights the need for a more rigorous approach to the development and evaluation of safety culture indicators.
Safety Culture Indicators - For Improvement not Assessment 503
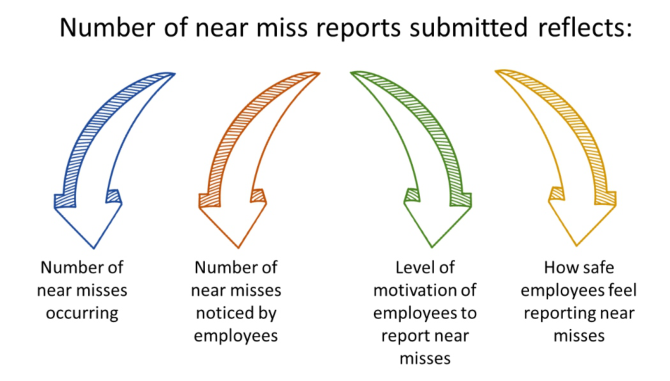
The review also highlighted the limitation of using safety culture metrics, as only four metrics were retained. In general, metrics provide limited insight into an organization’s safety culture. Metrics are quantitative in nature, and often less directly related to safety culture. For instance, assessing the number of near miss reports would provide little information about the presence of a learning culture, as there are many possible reasons for the number of near miss reports submitted (see Figure 3 below). Metrics are also susceptible to manipulation (e.g., managers could require employees to submit a specific number of reports per month). Additionally, metrics are limited in their use because they are unable to identify why a change occurs. Given the inherent weaknesses in using metrics for assessing safety culture, many received low scores during the review process. At the end of the review process, only four metrics were retained. While metrics may be useful to collect, they should be interpreted cautiously, as they may not accurately reflect safety culture.
Figure 3: Potential factors influencing the number of near miss reports submitted.
Indicators are more closely related to safety culture than metrics; however, indicators can vary greatly in quality and complexity. Indicators can provide a snapshot of an aspect of safety culture. Indicators are most useful when used over time to provide comparative information (i.e., how has an organization’s safety culture been improving/declining). Many organizations and regulators use maturity models to assess an indicator, which can aid in the interpretation of the information provided by indicators and enable them to plot progress.
Safety culture indicators may enable organizations to gain insight into their safety culture on a more frequent basis, similar to a pulse check. The utility of these indicators lies in being able to detect weak signals of a change in culture. For indicators to be used, it would be necessary to create a guid- ing document to provide information on the assessment of each indicator. Information on the interpretation of indicators and how to address signifi- cant findings would also be useful to ensure they would be used effectively.
504 Fleming and Cairns
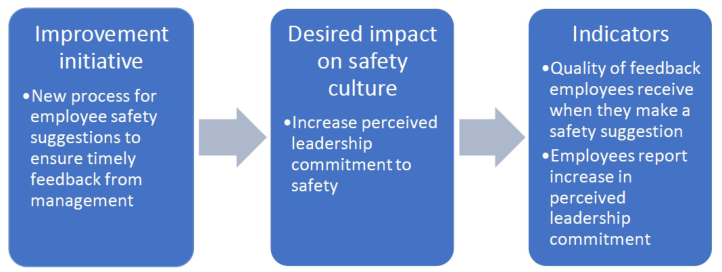
It would be possible to integrate these indicators into an SMS effectiveness audit, as there is a significant overlap between the indicators and SMS ele- ments. Indicators could also be used to assess the effectiveness of initiatives to improve an organization’s safety culture. This involves specifying the desired impact of the initiative on safety culture and identifying indicators that relate to the initiatives being implemented (see Figure 4). The indicators may need to be adapted to ensure that they are directly related to the aspect of safety culture the initiative is attempting to improve. The process for collecting the required evidence to assess the indicator should be documented. Orga- nizations should collect baseline data on the indicator before the initiative is implemented, to enable them to determine the impact of the initiative. The impact of the initiative should be assessed at specified intervals.
Figure 4: Using indicators to track impact of safety culture initiative.
There are several limitations of this study that should be noted. Firstly, we only evaluated a relatively limited sample of safety culture indicators. This research only reviewed four sets of publicly available indicators (CER, CCPS, RAC, and Fleming et al.). Additional sets of indicators may exist but are not publicly available or were not described as safety culture indicators and therefore not included. The four sets of safety culture indicators that were identified generated a substantial number of indicators for review, which reduces this concern. Secondly, as part of our evaluation of the indicators, we contacted several subject matter experts. Only a small number of individuals participated in the interviews. While the interview data was rich and provided a strong basis for the evaluation of safety culture indicators, the relatively small sample of experts is a limitation of this study. Despite these limitations, this study provides a strong basis for the increased understanding of safety culture indicators.
Although this research has identified a set of indicators and metrics that may be useable by industry, more work is needed to refine these items. Future research should seek to establish the reliability and validity of these items. In other words, for the indicators that were collected to be usable, they must be tested to ensure that they can be applied consistently and to ensure that they are related to safety culture.
Safety Culture Indicators - For Improvement not Assessment 505
Given that many of the indicators came from different frameworks across different industries, their rating methodologies and phrasing are not neces- sarily consistent. Therefore, it may also be useful to plot the indicators onto a maturity model by creating descriptors for each level of maturity for each indicator. Maturity models can help create clearer criteria to assess indicators and to ensure consistency in rating. However, these levels should be designed carefully to ensure they provide meaningful information and opportunities for growth.
ACKNOWLEDGMENT
The authors would like to acknowledge the funding from Transport Canada.
REFERENCES
American Institute of Chemical Engineers. (2018). Essential practices for creating, strengthening, and sustaining process safety culture. https://onlinelibrary.wiley.com/book/10.1002/9781119515128 Antonsen, S. (2009). Safety culture assessment: A mission impossible? Journal of Contingencies and Crisis Management, 17(4), 242–254. https://doi.org/10.1111/ j.1468-5973.2009.00585.x Canada Energy Regulator. (2021). Advancing Safety in the Oil and Gas Industry:
Statement on Safety Culture. https://www.cer-rec.gc.ca/en/safety-environment/sa fety-culture/statement-safety-culture/advancing-safety-in-the-oil-and-gas-indust ry-statement-on-safety-culture-2021.pdf Cole, K., S, Steven-Adams, S. M., and Wenner C. A. (2013) A literature Review of Safety Culture. Sandia National Laboratories https://www.osti.gov/servlets/purl /1095959. Fleming, M., Ozbilir, T., and Wong, J. (2015) Developing and validating safety
culture metrics (unpublished report). Fleming, M, Harvey, K, Cregan, B. (2018) Safety culture research and practice: A review of 30 years of research collaboration. J Appl Behav Res. 23: 12155. https: //doi.org/10.1111/jabr.12155 Goodhart, C. A. E. (1984). Problems of Monetary Management: The UK Experience.
In: Monetary Theory and Practice. Palgrave, London. https://doi.org/10.1007/ 978-1-349-17295-5_4 Guldenmund, F. (2021). Forward. In Bollmann, U. and Boustras G. (Eds) Safety and Health Competence: A guide for cultures of prevention. CRC Press, Boca Raton FL. Hopkins, A. (2006) Studying organisational cultures and their effects on safety.
Safety. Science. 44, 875–899. International Atomic Energy Agency (IAEA). (1986). Summary report on the postaccident review meeting on the Chernobyl accident. Safety SERIES No 75-INSAG- 1, Rep., International Atomic Energy Agency, Vienna. Office of Rail and Road. 2021. RM3 2020: Risk Management Maturity Model. https://www.orr.gov.uk/sites/default/files/2020-09/risk-management-ma turity-model-rm3-2019.pdf Nahm, A. Y., Rao, S. S., Solis-Galvan, L. E., & Ragu-Nathan, T. S. (2002). The Q-
sort method: assessing reliability and construct validity of questionnaire items at a pre-testing stage. Journal of Modern Applied Statistical Methods, 1(1), 15.
506 Fleming and Cairns
Railway Association of Canada (2019) Safety Culture Metrics. Progress and next steps (Unpublished Report). Schein. (1990). Organizational Culture. The American Psychologist, 45(2), 109–119.
https://doi.org/10.1037/0003-066X.45.2.109
LISTED IN THE AHFE DIGITAL BOOKSTORE CATALOGUE
Explore the complete digital volume
Advances in Human Factors of Transportation
Read this individual research paper free through the original publisher, or explore the full digital proceedings book.
ISBN 978-1-964867-24-3
Explore this ISBN in the AHFE Bookstore ↗Listed in the July 2026 bookstore catalogue; search by ISBN to confirm current availability · Digital book purchase optional