Katelyn Williams, Steven Jiang, Devon Albert (2024). Data Acquisition and Processing for the Optimization of an Algorithm for Vehicle Safety Objective Rating Metrics and Injury Severity Prediction. In: Human Factors in Design, Engineering, and Computing. AHFE Open Access, vol. 159, pp. 2111–2117. https://doi.org/10.54941/ahfe1005779
evaluation and the most common ORM is CORA (Correlation and Analysis). Currently, no standards exist for the evaluation of CORA: it is up to the researcher to determine whether or not to use its software (CORAPlus) and what parameters they deem important for analysis. This high level of subjectivity shows there is a need for a more streamlined approach for the data processing of the CORA ORM. The goal of this research is to develop a systematic approach for future researchers to process and analyze the CORA ORM consistently. Data acquisition and preprocessing are an important part of this process. This paper describes how data can be extracted from the NHTSA Biomechanics Database which is comprised of over 15,000 biomechanical tests in an online repository, and how data can be filtered and processed to generate matched time histories for ORM processing. This proposed approach of data processing and optimization is the basis for the development of an algorithm that correlates objective rating metric similarity scores and injury severity. It has the potential to contribute to the improvement of vehicle safety.
With the inception of the automobile in the early-1900s, vehicles in America were casually regulated through state and private sector standards. When the Society of Automotive Engineers (SAE) was founded in 1905, state governments leaned on this set of professionals for guidance with vehicle safety standards. During this time, there was not a federally mandated standard for vehicle safety. States would refer to the SAE to set their own standards for headlamps, brakes, and windshield wipers (Mashaw, Harfst, 1990). In the early-1960s, the number of highway deaths increased, therefore, prompting Congress to act. This marked the beginning of broader federal regulation with vehicle safety.
The National Traffic and Motor Vehicle Safety Act of 1966 had two components: (1) The Highway Safety Act of 1966 and (2) The National Traffic and Motor Vehicle Safety Act of 1966. The former required states
to have a highway safety program in alignment with federal standards. The goal was to improve driver performance, traffic control, and accident records systems (Canis, 2020). The latter was created to issue safety standards for all motor vehicles that began in January 1967. From this legislation, the National Highway Traffic Safety Administration (NHTSA) was born to execute the provision of this new law.
NHTSA is responsible for a number of safety standards including the regulations of brakes, tires, airbags, and seatbelts. Although NHTSA is responsible for the safety standards, it is up to the manufacturer to test and verify that their vehicles follow all standards and regulations. This self- certification verification is seen on the driver door-jamb in all vehicles sold in the United States of America. Manufacturers are also responsible for all recalls and subsequent penalties if vehicles are found to not have met Federal Motor Vehicle Safety Standards (FMVSS). The vehicle safety tests NHTSA conducts determines whether or not that particular manufacturer complied with safety standards and regulations. From there, NHTSA can encourage or order a recall by the manufacturer. NHTSA, in collaboration with the National Center for Statistics and Analysis (NCSA), has an extensive database of motor vehicle crashes (NHTSA 2021). This database is used to propose standards as well as identify vehicles that may require a recall (NHTSA 2017; NHTSA, 2021).
When the federal government created their own safety standards, they were able to quantify how much safer individuals were when driving. A NHTSA study estimated that vehicle safety technology associated with FMVSS had saved 613,501 lives between the years 1960 and 2012(Kahane 2015). This study also evaluated the effects of NHTSA-mandated FMVSS safety technologies (Table 1). It was also estimated that the risk of fatality in 2012 is 56% lower than in 1960 based on the effectiveness of those technologies. Since 2012, safety technology has evolved into Autonomous Emergency Breaking (AEB), lane departure systems, and other features to prevent collisions. With the progression of vehicle safety, attention was turned to assess the effectiveness of those technologies. One of the assessments adopted by experimenters is to use Objective Rating Metrics (ORMs). ORMs numerically evaluate the effectiveness of passive safety technologies of Anthropomorphic Test Device (ATDs) and Human Body Models (HBMs).
Table 1. Examples of federal motor vehicle safety standards (national highway traffic safety administration).
Table available in the original PDF paper.
FMVSS Number Description 105/135 Dual master cylinders & front disc brakes 126 Electronic stability control 206 Improved door locks 208 Seat belt regulations 213 Child safety seats 216 Roof crush resistance (eliminate true hardtops) 226 Ejection mitigation (rollover curtains) 301 Fuel system integrity: rear-impact upgrade
Data Acquisition and Processing for the Optimization of an Algorithm 2113
Anthropomorphic Test Devices are commonly known as crash test dummies. The purpose of ATDs is to be a mechanical representation of the human body (Mertz, 1993). They are frequently used to assess vehicle occupant and pedestrian injury risk (Untaroiu, Shin et al., 2013). Important human characteristics that ATDs have are shape, mass, energy dissipation, and size. The mechanical responses of an ATD simulate the following human body responses during a crash simulation: velocity, acceleration, trajectory, deformation, and articulation. In order for the quantification of crash tests using ATDs to be valuable, three factors must be upheld: (1) biofidelity (human physical characteristics incorporated in the ATD), (2) measurement of ATD responses related to injuries, (3) correlation that exists between the measured responses and the injury concerns (Mertz, 1993). ATDs are outfitted with sensors in order to record impact during a crash test. Injury criteria in crashworthiness testing is the measure of human injury tolerance that is based on mechanical responses from ATDs.
Injury prediction can be placed into two categories: injury risk curves (IRC) and injury assessment reference values (IARV). IRCs are the physical measures of injury risk probability. They are used to determine the probability of injury of specific body regions. IARVs are used as an injury-threshold value. The value of an IARV was determined so that if it was not exceeded, then the corresponding injury would be unlikely to occur (Mertz, Irwin, 2015). Similar to IRCs, IARVs have varying values based on the body region in question.
Objective Rating Metrics compare two matched time histories in order to evaluate their level of similarity. Matched time histories refer to experimental conditions under which the time histories collected were the same or similar conditions. Time histories collected include force, acceleration, and displacement which are measurable responses. The peak responses, or features, of time histories are then used to calculate injury risk for the experimental condition. Experimental condition includes the demographics of the ATD or PMHS (post-mortem human surrogate). The most common ORM is CORA (Correlation and Analysis) which utilizes two independent sub-ratings to determine the correlation between two signals (Barbat, Fu et al., 2013). The cumulative similarity score of CORA ranges from 0 (no correlation) to 1 (perfect match) (Gehre, Gades et al., 2009). CORA lacks a set of standards for their evaluation. CORA can be altered by users by adjusting parameters that traditionally reflect the knowledge of a subject matter expert (SME). While this provides flexibility, it introduces a high level of subjectivity between users: some may adjust parameters that yield favourable results as opposed to making the necessary adjustments in order for their models to have acceptable similarity scores. CORA is an ORM with its own software (CORAPlus) that also has another common ORM, ISO 18571 users can toggle between. Although CORA has its own software, many users have developed their own algorithms in various programming languages by following the CORAPlus manual. This also introduces another level of subjectivity as users are interpreting the manual in their own ways.
The purpose of this research is to develop a systematic approach for future researchers to process and analyze the CORA ORM consistently.
METHODS
Literature Review of CORA Settings Due to the subjectivity of the CORA ORM, a detailed literature review of its various parameters was conducted. This is a continuation of the extensive literature review on the variations of the CORA metric in various studies (Albert, 2020). The dates for the search within Google Scholar ranged from September 2019 until January 2024. References from the Albert study were used to ascertain current studies that specifically used the CORA metric. Other articles were identified through a traditional Google Scholar search that included the following phrases: CORA objective rating metrics, CORA parameters, CORA settings, CORA default CORA parameters, and correlation and analysis.
Once articles populated the Google Scholar search, the aforementioned dates were used to further filter the results. Each article was then searched extensively to determine if the CORA metric was used and if the parameters within the metric were changed by those that conducted the study. Articles with both default and altered parameters were saved and assigned a random identification (ID) number within a new Excel spreadsheet. Next, the studies where researchers changed the CORA parameters from default were further analyzed to annotate which parameters were changed within each study (Table 2). Every iteration of the altered parameters were individually tabled along with their ID number.
Table 2. Chart of default CORA parameters from the CORAPlus manual and groups of the altered parameters found in literature.
Data Acquisition and Processing for the Optimization of an Algorithm 2115
Data Acquisition The NHTSA Biomechanics Test Database is a publicly available database used in industry and academia. This database houses over 15,000 biomechanical tests in an online repository. Each test within the database may include complete testing information which is as follows: surrogate information, raw data from each surrogate sensor, a test report, as well as images and/or videos of the test. Within the database, the test conditions are organized and searchable via 12. For this research, the biological specimens (cadavers/PMHS), ATDs, and occupant injuries categories were included due to the datasets having the same tests with differing types of test data. Further test conditions and results relevant to the PMHS include: sex, seat location, age, position within the vehicle, rib fractures and other injuries, and other PMHS characteristics appearance. Injury specific data from each PMHS test include: injury type, injury severity, injured organ and region, and body regions and aspects.
Data were extracted from reports manually using categories within the NHTSA Biomechanics Database. Test and surrogate conditions were compiled for all tests within the database. These were then used as an initial filter to narrow down the search for tests of interest. The reports for these tests were retrieved to gather more information regarding the test conditions to build a workbook of matched tests.
Test reports were read and analysed to extract pertinent information that was compiled into a detailed Excel spreadsheet. This included: the NHTSA test number, study title, closing speed, occupant type and anthropometry, airbag and restraint information, sled and buck information, and the instrumentation used to collect acceleration and angular rate velocity for the head, pelvis, and thorax. Chest deflection instrumentation and location was also collected.
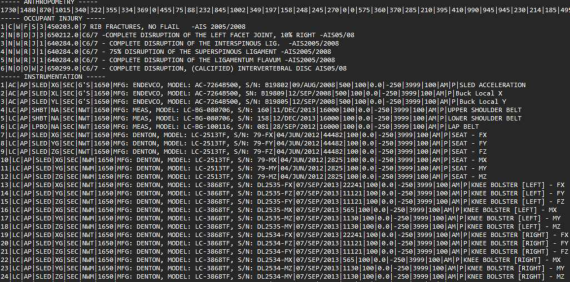
Data Organization and Preprocessing Once all data was collected and matched tests were identified, the ASCII files containing the time history data from each relevant test from the NHTSA database was downloaded into separate folders. Each ACSII folder downloaded is comprised of multiple files (labelled numerically) that correspond to one of the channels used to collect data. However, there is one file that identifies the data that was collected from each channel (Figure 1). For example, Channel 01 in the identification file corresponds to File 01 in the overall downloaded folder. For the purpose of this study, the raw data for each file included time and acceleration. When both ASCII folders for a matched test was downloaded, their files were viewed to extract data from the following channels of interest (in the X, Y, and Z directions): head acceleration, angular rate of velocity of the head and spine, pelvis acceleration, spine acceleration, and chest acceleration.
Figure 1: Main file with instrumentation, channel, and file information for raw data.
The data taken from each matched test was combined in an Excel workbook. One sheet within the workbook houses time and acceleration data of the ATD and PMHS for a specific direction of a body region. The body region and its direction became the name for the sheet. In total, 70 matched tests and therefore 70 Excel workbooks were created to house all of the raw data for further processing and the execution of CORA in MATLAB R2024a.
Prior to the data being processed through the CORA ORM created in MATLAB, the data collected must undergo pre-processing. First, a truncation and resampling function was developed in MATLAB to ensure the acceleration time history data are sampled at the same rate and are defined over the same duration for both the ATD and PMHS tests. Next, the “new” time history data was exported back to its sheet in its corresponding Excel workbook. This process was automated within MATLAB as over 100,000 lines of raw data was collected for this study.
DISCUSSION & FUTURE WORK Currently, there is not a consistent way to use CORA: each researcher determines their own parameters and settings prior to using the tool. Not only that, the use of software or coding the ORM is also up to the researcher. From data retrieval, time history matching, and ORM execution, there are a number of variations in this process. The inconsistency makes it difficult to truly compare results from many ORM-based studies. It is especially hard for those new to the field to initiate this type of research. The purpose of this research is to lay a solid foundation of methods where researchers are able to consistently process and analyze the CORA ORM and its varying iterations. The goal of this systemic approach is to diminish the high level of subjectivity that users introduce when using the CORA ORM. The proposed approach of data processing and optimization is the basis for a larger, ongoing study that aims to develop an algorithm that will correlate objective rating metric similarity scores and injury severity prediction in vehicle safety.
Data Acquisition and Processing for the Optimization of an Algorithm 2117
REFERENCES
Albert, D. L. (2020). Variations in User Implementation of the CORA Rating Metric.
Stapp Car Crash Journal Volume 64, pp. 1–30. Barbat, S., Fu, Y., Zhan, Z., Yang, R. J., & Gehre, C. (2013). Objective rating metric for dynamic systems. In 23rd International Technical Conference on the Enhanced Safety of Vehicles (ESV) National Highway Traffic Safety Administration No. 13–0448. Canis, B., (2020). Motor Vehicle Safety: Issues for Congress No. R46398. Gehre, C., Gades, H. and Wernicke, P., (2009). Objective rating of signals using
test and simulation responses. In 21st International Technical Conference on the Enhanced Safety of Vehicles Conference (ESV) (pp. 09–0407). Kahane, C. J., (2015). Lives saved by vehicle safety technologies and associated Federal Motor Vehicle Safety Standards, 1960 to 2012–Passenger cars and LTVs– With reviews of 26 FMVSS and the effectiveness of their associated safety technologies in reducing fatalities, injuries, and crashes. DOT HS 812 069. Mashaw, J. L. and Harfst, D. L., (1990). The struggle for auto safety. Harvard
University Press. Mertz, H. J., (1993). Anthropomorphic test devices. In Accidental injury: Biomechanics and prevention. New York, NY: Springer New York, pp. 66–84. Mertz, H. J. and Irwin, A. L., (2015). Anthropomorphic test devices and injury risk assessments. In Accidental injury: biomechanics and prevention. New York, NY: Springer New York, pp. 83–112. National Highway Traffic Safety Administration. (April 2, 2022) Laws and
Regulations. The NHTSA Website: https://www.nhtsa.gov/laws-regulations/fmv ss NHTSA. (March 28, 2022) Data. The NHTSA Website: https://www.nhtsa.gov/data NHTSA, (2017). Motor Vehicle Safety Defects and Recalls: What Every Vehicle Owner Should Know. DOT HS 808 795. Untaroiu, C. D., Shin, J. and Lu, Y. C., (2013). Assessment of a dummy model
in crash simulations using rating methods. International Journal of Automotive Technology, Volume 14, pp. 395–405.
LISTED IN THE AHFE DIGITAL BOOKSTORE CATALOGUE
Explore the complete digital volume
Human Factors in Design, Engineering, and Computing
Read this individual research paper free through the original publisher, or explore the full digital proceedings book.
ISBN 978-1-964867-35-9
Explore this ISBN in the AHFE Bookstore ↗Listed in the July 2026 bookstore catalogue; search by ISBN to confirm current availability · Digital book purchase optional