Yuna Haas, Eric Sax (2025). Image-based mandrel detection during stent production in an industrial environment. In: Human Interaction and Emerging Technologies (IHIET-AI 2025): Artificial Intelligence and Future Applications. AHFE Open Access, vol. 161, pp. 408–418. https://doi.org/10.54941/ahfe1005933
Of the 985,572 deaths in Germany in 2020, 121,725 people died due to coronary heart disease (CHD). Therefore, CHD is the most common single cause of death in Germany. It is caused by a narrowing of the coronary vessels. This narrowing will lead to an insufficient supply of oxygen and nutrients to the heart muscle, causing a heart attack, heart failure or cardiac arrhythmia. A possible treatment for CHD is the implantation of a stent, which will widen the narrowed vessel. This widening will restore the oxygen and nutrient supply. Being a minimally invasive technique, 298.557 stent implantations were performed in Germany in 2020, accounting for about 88 % of all related interventions. According to the German fee-per-case system, the costs for a single stent range from €54.80 to €1,189.69. Combining the number of implantations with the costs per stent, the resulting financial burden on German health services is imminent. One reason for these high costs is the absence of an automated inspection and correction system during stent production using a maypole braider. Following this argumentation, an automated system for detecting and correcting geometry errors in stents during their production is desirable.To detect errors in a stent during the production process, it is necessary to measure its geometry. This requires knowledge about its position within the image. Since the stent is braided using a maypole braider, locating the stent is equivalent to locating the mandrel. This paper proposes a concept to measure the mandrels’ position during production based on camera images. It differentiates between and handles cylindrical stents as well as curved ones. Also, it compensates for the movements of both the camera and the mandrel in the x and z planes. Movements in the y-plane can be neglected. Additionally, methods to measure a cylindrical mandrel are evaluated, including Canny Edge Detection, the Hough transform, k-means clustering, and a watershed algorithm. In addition, four convolutional neural networks and two object detection models were tested. The lowest mean squared error of 9.04 was achieved using the YoloV10 object detector (mean MSE: 9.04, median MSE: 9.57, mean MAE: 11.5, median MAE: 7.65, and execution time per image: 846.9 ms). The fastest approach with an execution time of 53.06 ms is based on the Canny operator to detect lines as well as a threshold on the images’ histogram to find the position of the mandrels’ borders (mean MSE: 55.89, median MSE: 21.0, mean MAE: 70.51, median MAE: 16.12, and execution time per image: 53 ms). The images being used to train, evaluate, and test all methods were recorded using a maypole braider in an industrial environment.Parts of this work have been developed in the project Stents4Tomorrow. Stents4Tomorrow (reference number: 02P18C022) is partly funded by the German Federal Ministry of Education and Research (BMBF) within the research program ProMed.
Image-Based Mandrel Detection During Stent Production in an Industrial Environment 409
heart attack. In the case of acute treatment of CHD, a stent is implanted or a bypass operation will be performed (Schüssel et al., 2022). In Germany, in 88% of all CHD interventions, a stent was implanted (Herzstiftung eV, 2021). In 10% to 30% of those cases, there is a need for a second stent implantation at the same location (see e.g. (Jiang et al., 2022), (Zotz et al., 2019) or (Hoffstetter et al., 2009)). Research for reasons for this behaviour is still ongoing (e.g., Zotz et al., 2019) but risk factors are known. Possible risk factors are an undersized stent, its local geometry or vascular curvature caused by the stent (LaDisa et al., 2022). These risk factors can be addressed using a personalized stent geometry (see e.g. (LaDisa et al., 2022) or (Hachem et al., 2023)). Automatic stent personalization is currently unavailable due to two reasons: Firstly, current methods are either faulty (e.g. (Rothkegel, 2024)) or require too many computing resources (e.g. (Kyosev, 2014) or (Rothkegel, 2024)). Secondly, inspection systems according to ASTM (American Society for Testing, and Materials, 2013) are error-prone. For these reasons, personalized stents are being braided by human individuals. Following this, personalised stents are more than 10 times more expensive than non-personalized ones1. Therefore, an automatic image-based system without the mentioned drawbacks for maypole braided stents is desirable to reduce a stents’ costs and potentially increase the number of personalised stents. For this reason, this paper proposes an image-based concept to detect a stent’s position based on a mandrel detection during production representing the first step of an automated inspection and correction system.
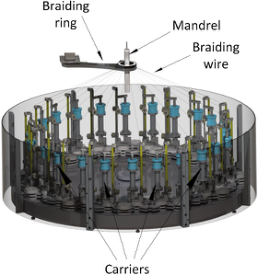
FUNDAMENTALS The stents considered in this paper are manufactured using a maypole braider (s. Figure 1). During manufacturing, the braiders’ carriers, which store the braiding wire, move around the mandrel. The wire’s other end is attached to the mandrel. During this process, the mandrel moves away from the carrier’s plane of movement. Its movement speed is called take-up speed. The result is a mesh tube called a stent.
Figure 1: Visualization of a maypole braider containing its main components (Haas et al., 2021).
1Zusatzentgelte Katalog in the aG DRG version 2023
410 Haas and Sax
RELATED WORK
The authors do not know about any scientific publications measuring a stents’ geometry or position. In contrast, publications measuring the structure of a braid or braid-like structure exist. These publications do either not specify how the structures’ location is inferred or assume it to be constant (e.g. (Monnot et al., 2017), (Hunt and Carey, 2019), (Vollbrecht et al., 2021), (Ershov et al., 2022), (Jiyong et al., 2023) or (Zhang et al., 2023)).
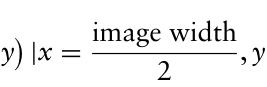
REQUIREMENTS Due to the context of this work requirements regarding the measurement error and the execution time arise. Specifically, the image-based geometry measurement of the complete stent should take a maximum of 100 ms (Haas et al., 2021). Due to the mandrel detection being only one part of the measurement pipeline, it has to have an execution time much smaller than 100 ms. In addition, the measurement error regarding the stents’ geometry has to be smaller than 0.05 mm (Haas et al., 2022). Even though the mandrel detection does not directly influence the geometry measurement, the specified acceptance value is used due to the lack of a more specific one. In Addition, it is assumed, that the images’ middle falls onto the mandrel (s. Equ. (1)).
images′middle :=
x, y
Equation reproduced from the original PDF.
0, 1, . . . , image height −1
2 , y ∈
DEFINITIONS Due to the assumption that the mandrel falls onto the images’ middle, the image can be divided into two sub-images. The one containing only x-values smaller than image width
2 is called left half. The one containing x-values greater than image width 2 is called right half. Following this, each image half contains one mandrel border. This border can be differently shaped. Therefore, in this paper, three different types of border definitions are used to describe its shape:
One-point border (OPB): The OPB assumes that the mandrels’ border is parallel to the y-axis of the image. Therefore, only one value, namely the x-coordinate of the border, is needed to describe it.
Two-point border (TPB): The TPB allows the mandrel to be skewed. Following, movements in the x-plane and rotations around the z-axis are allowed as long as Equ. (1) is not violated. Consequently, a border of this type is described by two two-dimensional points.
Multi-point border (MPB): Lastly, the MPB describes a single border using multiple (at least two) two-dimensional points. These points can be used to fit a spline or some other kind of line. Following, the MPB can describe a curved border.
CONCEPT Using these definitions, locating the stent is equivalent to measuring one mandrel border per image half or two borders per image. In addition, the mandrels’ border can be assumed to be a line. This is valid due to the
Image-Based Mandrel Detection During Stent Production in an Industrial Environment 411
background and the mandrel being differently coloured homogenous areas. Therefore, the concept has to solve a visual inspection task. The procedure to solve such tasks can in general be divided into three steps (Stiller et al., 2024):
1. Image pre-processing: Problem-specific processing and noise reduction 2. Feature extraction: Extraction of prior defined features like lines 3. Information extraction: Extraction of the desired information Common image pre-processing methods include blurring (e.g., to reduce noise) or sharpening (e.g., to extract edges) the image or enhancing its contrast. The use of a specific pre-processing method as well as its hyperparameters cannot be computed beforehand – it has to be evaluated.
After the pre-processing, the feature extraction will be applied. The methods considered in this paper can be divided into four groups:
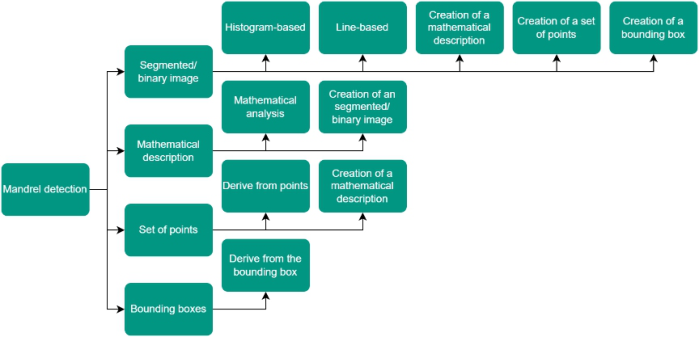
1) Segmented/binary image: The result of the methods of this group is an image which is divided into at least two segments. 2) Mathematical description: The mandrels’ borders are described using some kind of mathematical description like lines. 3) Set of points: The result of methods acquainted with this group is a set of points which describe the mandrels’ borders. 4) bounding boxes: The position of the mandrel is described using a bounding box.
In the last step, the information extraction, multiple approaches to extract the desired information (s. Figure 2) are analysed. These approaches are: Histogram-based: In the first step, this method computes the column-wise histogram. Then, starting from the left and right sides of the histogram, it searches for a significant change in its value. The index of this change is used as an OPB. The significance of a change can be computed using a to-be- evaluated threshold. In the case of a TPB or MPB, the image is split along the y-axis into multiple sub-images and the method is applied to each one.
Line-based: In this case, the nearest pixel representing a line is searched for each row from both sides of the image. If an OTB should be extracted, then for each image half, the x-coordinate with the minimal distance to the images’ middle is used. In the case of a TPB, the coordinates of the pixel with the smallest and biggest distance to the images’ middle are used. Finally, for MPBs, the curve’s defining points can be sampled, for instance, on a regular grid.
Mathematical analysis: The first step of the mathematical analysis is to filter the lines. Every line which crosses the images’ middle (s. Equ. (1)) cannot be a border and therefore can be neglected. Optionally, the angle to the x-axis can be used to perform additional filtering. It has to be noted, that this restricts the skewness of the mandrel. Lastly, the length of the lines can be used for filtering. Due to the fact, that the mandrels’ border will be represented as a long line, all lines can be filtered using a to-be-evaluated threshold value regarding their length. The second step consists of a search
412 Haas and Sax
for the line with the minimal distance to the images’ border. The border is then extracted from the (mathematical description of the) selected lines.
Derive from points: If the border is derived from a set of points, then for an OPB, the x-coordinate of the point with the minimal distance to the images’ half, for each image half, is used. In the case of a TPB two points are extracted per border: The one with the smallest and the one with the biggest distance to the images’ middle. In the case of a MPB, all points are used. All points located in the left half are used to describe the left border. The ones on the right side are assigned to the right border.
Derive from the bounding box: When dealing with bounding boxes, the boundaries extracted using any of the three boundary types will be identical. This is due to the fact, that the bounding box is an axis-parallel rectangle. The OPB uses the x-coordinate of the vertical edges of the box as a border. The TPB and MPB use the corners of said vertical edges to extract a line representing the border. If multiple boxes are present, then the biggest box which crosses the images’ middle should be chosen. As the mandrel represents the largest structure within the image, selecting the largest box is valid. In addition, by definition, the images’ middle falls on the mandrel (see Equ. (1)), which is why this must also apply to the bounding box.
In addition, some of the representations can be converted to another one (s. Figure 2). For example, one could extract lines (mathematical description) shown in a binary image (Segmented/binary image).
Figure 2: Tree structure describing the connection between the different groups used for feature extraction and the information extraction methods.
EVALUATION In the next step, the concept is evaluated using an OPB as the target value.
The used dataset contained 8,347 images with a size of 2064 × 3088 pixel. 70% of those images were used for training, while 15% were allocated for validation and testing. The images show two different mandrels with a diameter of 20 mm and 34.3 mm. They were taken using a Basler acA3088- 57 uc with an Edmund Optics Lens CFFL F1.65 f35mm 2/3. The distance
Image-Based Mandrel Detection During Stent Production in an Industrial Environment 413
between the camera and the mandrel was approximately 258 mm resp. 251 mm. The evaluated methods can be differentiated into AI-based and classic methods.
The AI-based ones contained two different object detectors (YoloV10n and YoloV10x (Wang et al., 2024)) as well as five different CNNs (EfficientNetV2 (Tan and Lee, 2021), ResNeXt (Xie et al., 2017), SwinTransformer (Liu et al., 2022), VGG19 (Simonyan and Zisserman, 2014), and Vision Transformer (ViT) (Dosovitskiy, 2020)). The object detectors were trained to detect the mandrel (bounding boxes approach), from which the OPB is then extracted. The CNNs regressed the x-coordinate of both borders. Following this, they created a set of points. The borders were then derived from these points.
The classic approach contained four steps: 1. Pre-processing: In the first step the image is pre-processed. Possible pre-processing methods are blurring (median blur), edge enhancement (Sobel filter (Kanopoulos et al., 1988)), contrast enhancement (histogram equalization ((Hummel, 1977) resp. (Pizer, 1983)) or CLAHE ((Ketcham et al., 1974) resp. (Hummel, 1977))), and binarization (using Otsu (Otsu, 1979), mean value or gaussian-weighted sum of the local neighbourhood as threshold) of the image.
2. Feature Extraction: Afterwards image features like lines are extracted. This is done using the Canny algorithm (Canny, 1986), Hough transformation (Duda and Hart, 1972), k-means, or a watershed algorithm.
3. Post-processing: Then, an optional post-processing using morphological operations (open and/or close) is performed.
4. Information Extraction: Lastly, the desired index is derived using a mathematical analysis, histogram-based or line-based approach.
The mentioned methods were evaluated using a computer with a Rocky Linux 8 operating system, an NVIDIA RTX A6000, an Intel® Xeon® W-2145 CPU and 128 GB RAM. Due to computational restrictions, the evaluation of the AI-based and classical-based methods was performed separately.
In the case of the CNNs, the only parameter being evaluated was the image scaling. Possible scaling targets were 256, 512, 1024, and 2048 pixels. The CNNs were trained using PyTorch (Ansel et al., 2024). The training process was scheduled by an Adam optimizer (Kingma, 2014) with a batch size of 4 and early stopping with a patience of 15. The object detectors were implemented using the Ultralytics framework (Wang et al., 2024). Since the framework mandates image scaling to 512 pixels, image scaling was not evaluated.
As for classical methods, each feature extraction method was evaluated separately (10.000 trials for Canny and Hough, 1,000 for Watershed and 600 for k-means). The pre- and post-processing steps were marked optional. Following, the usage of every step as well as its hyperparameters was evaluated. The methods were implemented using OpenCV (Bradski, 2000) and NumPy (Harris et al., 2020). The evaluated hyperparameter configurations were suggested by Optuna (Akiba et al., 2019) offering a structured hyperparameter optimization.
414 Haas and Sax
In both cases, AI-based and classical methods, the error is computed using the sum of the (absolute) deviation of the measured border from the labelled.
TEST RESULT After the evaluation, a test was performed. The results can be seen in Table 1 and Table 2. The tables contain the test error and the mean execution time needed to process one image.
Table 1. Test results of the Canny algorithm, Hough-transformation, k-means and Watershed. The execution time is in ms, while the test error is provided in mm.
Table available in the original PDF paper.
Method Canny Hough K-Means Watershed Test error [mm] 0.97 0.33 1.11 0.43 Mean exec. time [ms] 53.06 1,376.86 90.33 55.28
Table 2. Test results of EfficientNet (1), ResNeXt (2), Swin (3), VGG19 (4), ViT (5), YoloV10n (6) and YoloV10x (7). The error is in mm, while the mean execution time is in ms.
Table available in the original PDF paper.
Method 1 2 3 4 5 6 7 Test error [mm] 2.77 4.73 0.16 2.36 0.38 0.21 0.16 Mean exec. Time [ms] 158.21 160.87 207.6 121.66 313.14 109.45 112.57
DISCUSSION
Analysing the border types, one could notice that the OPB is prone to be faulty. This is the case if the camera is not perfectly aligned with the mandrel. Even if the images’ discretization error is incorporated, it is highly likely, that the OPB will be biased. Nonetheless, it is being used due to the reduced labelling and programming effort compared to the other two types. In Addition, deviations regarding the z-axis are allowed. This enforces an image-wise self-calibration to map the error from pixel to mm. One possible way to implement such a calibration is to use the mandrels’ diameter as well as the labels to formulate a mapping function.
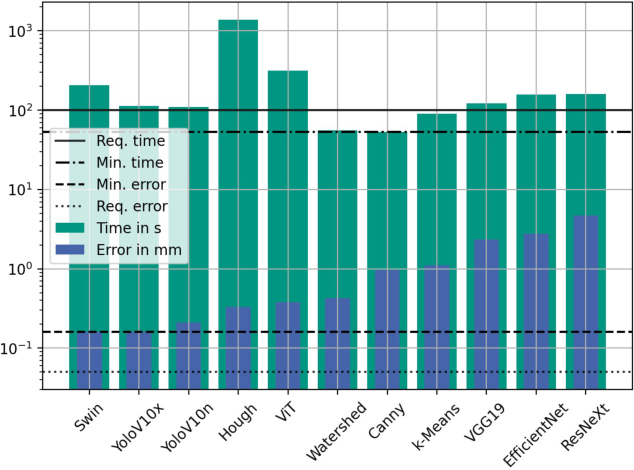
Regarding the evaluation results, Swin and YoloV10n achieved the lowest test error, while YoloV10x got the lower execution time (s. Figure 3). In Addition, Swin shows a standard deviation of 0.12 mm and a maximal error of 1.29 mm while YoloV10x achieved 0.11 mm and 0.6 mm respectively. Using the sum of the deviation of both limits, generates an easy-to-interpret and comparable value, which, however, represents an upper limit for the measurement error of a single border. If instead the average absolute deviation across the individual borders is calculated, YoloV10x and Swin continue to show the smallest error (both 0.08 mm), which does not fulfil the requirement.
Image-Based Mandrel Detection During Stent Production in an Industrial Environment 415
Figure 3: Bar diagram of the mean execution time and the error in mm of the evaluated methods on the test data. In addition, the minimal execution time, measurement error as well as the time and error requirements are marked using horizontal lines.
Concerning the real-time constraint, only three approaches (Canny, Watershed and k-Means) demonstrate an execution time below 100 ms. As mandrel detection represents a single stage within a multi-stage measurement process, which at least involves the task of stent geometry assessment, the current average execution time is considered too lengthy.
SUMMARY AND OUTLOOK In summary, an image-based concept to measure the position of a mandrel during stent manufacturing is proposed. The concept differentiates between three different shape-dependant mandrel types. In Addition, methods to perform a feature extraction using segmented/binary images, a mathematical description, a set of points and bounding boxes are described. Also, five different approaches (histogram-based, line-based, mathematical analysis, derived from points and derived from bounding boxes) to extract the mandrels’ borders from the extracted features are defined. Besides, the proposed concept was implemented using AI-based and classical methods. The lowest measurement error of 0.16 mm was achieved by a YoloV10x (object detector) and a Swin Transformer (CNN). On the downside, both methods have an average runtime greater than 100 ms and therefore do not fulfil the set requirement.
Future work would be to build a complete inspection system containing mandrel detection as well as pitch measurement and to evaluate it. It is already foreseeable that the requirement regarding the execution time will not be met. Therefore, methods to decrease the systems’ execution time could
416 Haas and Sax
be explored. This can include a GPU-based execution or an implementation in C++ rather than Python. Alternatively, the requirement could be re- evaluated or the braiding process restricted to soften it. In Addition, reducing the measurement error could be future work. One possible approach could be to improve the spatial resolution. Increasing the spatial resolution would increase the amount of data to be processed resulting in an increased resource consumption and/or a higher execution time.
Lastly, the measurement system could be combined with a correction system like proposed by (Haas and Sax, 2024).
ACKNOWLEDGMENT
Parts of this work have been developed in the project Stents4Tomorrow. Stents4Tomorrow (reference number: 02P18C022) is partly funded by the German Federal Ministry of Education and Research (BMBF) within the research program ProMed. Additionally, the authors want to thank M. Braeuner (Admedes GmbH) and K. Lehmann (Admedes GmbH) for their continuous support and advice.
REFERENCES
Akiba, T., Sano, S., Yanase, T., Ohta, T., and Koyama, M. 2019. Optuna: A Next-Generation Hyperparameter Optimization Framework. In The 25th ACM SIGKDD International Conference on Knowledge Discovery & Data Mining (pp. 2623–2631). American Society for Testing, and Materials 2013. Standard Guide for Characterization and Presentation of the Dimensional Attributes of Vascular Stents: Designation: F2081-06 (Reapproved 2013). In undefined. Ansel, J., Yang, E., He, H., Gimelshein, N., Jain, A., Voznesensky, M., Bao,
B., Bell and others, S. 2024. PyTorch 2: Faster Machine Learning Through Dynamic Python Bytecode Transformation and Graph Compilation. In 29th ACM International Conference on Architectural Support for Programming Languages and Operating Systems, Volume 2 (ASPLOS ‘24). ACM. Bradski, G. 2000. The OpenCV library. Dr. Dobb’s Journal of Software Tools. Canny, J. 1986. A computational approach to edge detection. IEEE Transactions on pattern analysis and machine intelligence (6), pp. 679–698. Deutsche Herzstiftung. (2023). Mortalitätsrate aufgrund von Herzkrankheiten in
Deutschland nach Diagnosegruppen in den Jahren von 1990 bis 2021 (je 100.000 Einwohner). Statista. Statista GmbH. Dosovitskiy, A. 2020. An image is worth 16x16 words: Transformers for image recognition at scale. arXiv preprint arXiv:2010.11929. Duda, R., and Hart, P. 1972. Use of the Hough transformation to detect lines and
curves in pictures. Communications of the ACM, 15(1), pp. 11–15. Ershov, S., Reimer, V., Zastrow, T., Kalinin, E., and Gries, T. 2022. Method for measuring the braid angle and its deviation from the specified value in braided preforms using image analysis. Fibre Chemistry, 53(5), pp. 346–354. Haas, Y., Braeuner, M., Lehmann, K., and Sax, E. 2021. Evaluation of different
methods to measure a stent’s pitch length in an industrial environment. In 2021 International Conference on Electrical, Computer, Communications and Mechatronics Engineering (ICECCME) (pp. 1–6).
Image-Based Mandrel Detection During Stent Production in an Industrial Environment 417
Haas, Y., Erlinghagen, L., and Sax, E. 2022. Pitch length measurement of stents using dynamically cropped images. In 2022 International Conference on Electrical, Computer, Communications and Mechatronics Engineering (ICECCME) (pp. 1–6). Haas, Y., and Sax, E. 2023. Conceptual Measurement of Individual Pitches During
the Stent Production. In 17th International Conference on Computer Graphics, Visualization, Computer Vision and Image Processing (CGVCVIP). Haas, Y., Sax, E. (2024). Conceptual approach of an online correction system for the stent production. In: Tareq Ahram, Luca Casarotto and Pietro Costa (eds) Human Interaction and Emerging Technologies (IHIET 2024). AHFE (2024) International Conference. AHFE Open Access, vol. 1. AHFE International, USA. Hachem, E., Meliga, P., Goetz, A., Rico, P., Viquerat, J., Larcher, A., Valette, R.,
Sanches, A., Lannelongue, V., Ghraieb, H., and others 2023. Reinforcement learning for patient-specific optimal stenting of intracranial aneurysms. Scientific Reports, 13(1), p. 7147. Harris, C., Millman, K., Van Der Walt, S., Gommers, R., Virtanen, P., Cournapeau, D., Wieser, E., Taylor, J., Berg, S., Smith, N., and others 2020. Array programming with NumPy. Nature, 585(7825), pp. 357–362. Herzstiftung eV, D. 2021. Deutscher Herzbericht 2020. Frankfurt am Main:
Deutsche Herzstiftung eV, 6. Hoffstetter, M., Pfeifer, S., Schratzenstaller, T., and Wintermantel, E. 2009. Stenting und technische Stentumgebung. Medizintechnik: Life Science Engineering, pp. 1263–1296. Hummel, R. 1975. Image enhancement by histogram transformation. Unknown. Hunt, A., and Carey, J. 2019. A machine vision system for the braid angle
measurement of tubular braided structures. Textile Research Journal, 89(14), pp. 2919–2937. Jiang, W., Zhao, W., Zhou, T., Wang, L., and Qiu, T. 2022. A review on manufacturing and post-processing technology of vascular stents. Micromachines, 13(1), p. 140. Jiyong, F., Yujing, Z., Zhongwei, W., and Zhiguo, Y. 2023. Traction control of space
tubular shaped mandrel and detection of preform braiding angle. Textile Research Journal, 93(1–2), pp. 392–408. Kanopoulos, N., Vasanthavada, N., and Baker, R. 1988. Design of an image edge detection filter using the Sobel operator. IEEE Journal of solid-state circuits, 23(2), pp. 358–367. Ketcham, D., Lowe, R., and Weber, J. 1974. Image enhancement techniques for
cockpit displays. Hughes Aircraft Co Culver City Ca Display Systems Lab, 6. Kingma, D. 2014. Adam: A method for stochastic optimization. arXiv preprint arXiv:1412.6980. Kyosev, Y. 2014. Braiding technology for textiles: Principles, design and processes.
Elsevier. LaDisa Jr, J., Ghorbannia, A., Marks, D., Mason, P., and Otake, H. 2022.
Advancements and opportunities in characterizing patient-specific wall shear stress imposed by coronary artery stenting. Fluids, 7(10), p. 325. Liu, Z., Hu, H., Lin, Y., Yao, Z., Xie, Z., Wei, Y., Ning, J., Cao, Y., Zhang, Z., Dong, L., and others 2022. Swin transformer v2: Scaling up capacity and resolution. In Proceedings of the IEEE/CVF conference on computer vision and pattern recognition (pp. 12009–12019).
418 Haas and Sax
Monnot, P., Levesque, J., and Lebel, L. 2017. Automated braiding of a complex aircraft fuselage frame using a non-circular braiding model. Composites Part A: applied science and manufacturing, 102, pp. 48–63. Otsu, N., and others 1975. A threshold selection method from gray-level histograms.
Automatica, 11(285–296), pp. 23–27. Pizer, S. 1983. An automatic intensity mapping for the display of CT scans and other images. In Proceedings of the VIIth International Meeting on Information Processing in Medical Imaging (pp. 276–309). Rothkegel, J., Renson, B., Bruyneel, M., and Noels, L. 2024. Development of a
geometric modeling strategy for the generation of representative unit cells in 2D braids. Composite Structures, 348, p. 118503. Schüssel, K., Weirauch, H., Schlotmann, A., Brückner, G. and Schröder, H. (2022).
Gesundheitsatlas Deutschland. Wissenschaftliches Institut der AOK (WIdO). Simonyan, K., and Zisserman, A. 2014. Very deep convolutional networks for largescale image recognition. arXiv preprint arXiv:1409.1556. Statistisches Bundesamt. (2023). Anzahl der Todesfälle nach den häufigsten Todesursachen in Deutschland in den Jahren 2019 bis 2021. Statista. Statista GmbH. Stiller, C., Bachmann, A. and Ole Salscheider (2024). Maschinelles Sehen. Springer
eBooks, pp. 411–444. doi: https://doi.org/10.1007/978-3-658-38486-9_18. Tan, M., and Le, Q. 2021. Efficientnetv2: Smaller models and faster training. In International conference on machine learning (pp. 10096–10106). Vollbrecht, B., Kohler, C., Kolloch, M., Jung, F., Grigat, N., and Gries, T.
2021. Developing a camera-based measuring system to feedback control the fibre orientation for the braiding process of CFRP. Advances in Industrial and Manufacturing Engineering, 3, p. 100059. Wang, A., Chen, H., Liu, L., Chen, K., Lin, Z., Han, J., and Ding, G. 2024. Yolov10: Real-time end-to-end object detection. arXiv preprint arXiv:2405.14458. Xie, S., Girshick, R., Dollar, P., Tu, Z., and He, K. 2017. Aggregated residual
transformations for deep neural networks. In Proceedings of the IEEE conference on computer vision and pattern recognition (pp. 1492–1500). Zhang, Y., Yuan, L., Zeng, Z., Liang, W., and Pang, Z. 2023. Carbon Fiber- Reinforced Polymer Composites Texture Angle Regression Based on the Improved Deep Hough Network. IEEE Journal of Emerging and Selected Topics in Industrial Electronics, 5(3), pp. 1234–1247. Zotz, R., Dietz, U., Lindemann, S., and Genth-Zotz, S. 2019. Coronary restenosis.
Herz, 44, pp. 35–39.
LISTED IN THE AHFE DIGITAL BOOKSTORE CATALOGUE
Explore the complete digital volume
Human Interaction and Emerging Technologies (IHIET-AI 2025): Artificial Intelligence and Future Applications
Read this individual research paper free through the original publisher, or explore the full digital proceedings book.
ISBN 978-1-964867-37-3
Explore this ISBN in the AHFE Bookstore ↗Listed in the July 2026 bookstore catalogue; search by ISBN to confirm current availability · Digital book purchase optional