Sezer Dumen, Denis Gracanin, Dina El Mahdy (2026). Bridging the Gap in Immersive Analytics: Visualizing Unstructured Data in the Era of Generative AI. In: Metaverse, Virtual Environments and Game Design. AHFE Open Access, vol. 217, pp. 22–31. https://doi.org/10.54941/ahfe1007650
The exponential growth of unstructured textual data poses a fundamental challenge for analysts relying on traditional displays. While Immersive Analytics (IA) offers an infinite canvas for high-dimensional data exploration, current approaches struggle to handle the scale and probabilistic nature of insights derived from Generative AI. This paper identifies the technological and ergonomic gaps in visualizing large-scale knowledge graphs extracted from document collections via Large Language Models (LLMs) in Extended Reality (XR). We highlight that transforming text into 3D spatial networks introduces a cognitive bottleneck characterized by severe visual clutter, temporal disorientation, and the epistemic uncertainty caused by AI hallucinations. We argue that simply rendering massive datasets in 3D exacerbates cognitive load rather than alleviating it. To address these barriers, we propose a framework for Intelligent Adaptive Visualization. This approach advocates for dynamic layout algorithms to reduce clutter, uncertainty-aware attention guidance to prioritize high-confidence insights, and deep provenance mechanisms for trust calibration. We conclude that bridging the gap between algorithmic extraction and human perception requires immersive systems to shift from passive data representation to active, intelligent cognitive assistance.
The exponential increase in digital information production poses a fundamental challenge for users attempting to analyze and interpret data. Today, the concept of Big Data refers not only to the large volume of data but also to its complexity and multidimensionality (Olshannikova et al., 2015). Traditional two-dimensional (2D) screens and standard visualization techniques are often insufficient to represent the high dimensionality and relational depth of modern data sets (Donalek et al., 2014; Moran et al., 2015). Users (e.g., analysts, management, investors, policy makers) need a broader workspace and more natural interaction methods to make quick and accurate decisions without getting lost in this data overload. This challenge is particularly acute in domains such as accounting and auditing, where users
Bridging the Gap in Immersive Analytics: Visualizing Unstructured Data 23 must reconcile fragmented, multi-format disclosures—including financial statements, sustainability reports, and regulatory filings—to form coherent risk assessments.
Emerging as a response to these needs, Immersive Analytics explores new ways to analyse data using virtual reality (VR) and augmented reality (AR) technologies (Klein, Sedlmair and Schreiber, 2022). Immersive environments offer users an infinite canvas and a natural sense of depth, allowing them to examine complex data structures as if they were physical objects in the real world. Research shows that 3D visualizations can offer significant advantages over traditional methods, particularly in exploring multidimensional data and collaborative work (Cavallo et al., 2019). However, simply moving data into a three-dimensional space is not sufficient for effective analysis.
As Gračanin argues, immersion alone does not guarantee insight; successful systems must leverage embodied cognition, allowing users to utilize their physical presence to offload cognitive work onto the environment. Despite the potential of immersive technologies, the design of these environments also presents certain human factor challenges (Gračanin, 2018). When large-scale datasets are transferred to a 3D environment, object occlusion and visual clutter reduce the readability of the data (Ens et al., 2021). More importantly, the cognitive load users experience while navigating this dense information space directly affects the system’s usability and learning motivation (Wenk et al., 2023). Users’ correct perception of data is closely tied to the visual variables used (colour, size, depth, etc.) and the design of the environment (Whitlock, Smart and Szafir, 2020). Therefore, when designing immersive systems, not only how the data is displayed but also how the user’s attention is managed becomes a critical question.
These challenges have become even more complex in the age of Generative Artificial Intelligence. Analysts now deal not only with numerical data but also with massive amounts of unstructured text, such as corporate reports or file archives. This text must be processed and transformed into meaningful information networks and visualizations (Hashmi and Bansal, 2019). However, these text-derived data inherently contain a certain degree of uncertainty. Visualizing the reliability of insights generated by artificial intelligence models and presenting them transparently to the user remains an unresolved design problem.
To address this gap, this position paper presents a framework for identifying perceptual, cognitive, and epistemic barriers that arise when AI-extracted knowledge graphs are visualized in XR environments. While prior work has examined immersive visualization and LLM capabilities separately, this study focuses on their intersection and brings the challenges together into a unified analytical framework.
The main purpose of the paper is to critically examine why current immersive analytics systems break down when used to visualize unstructured, AI-generated knowledge at scale, and to articulate what kind of design shift is required to make immersive analytics genuinely useful in the era of generative AI. Our study makes two contributions. First, it identifies a growing mismatch between (1) the large-scale, probabilistic knowledge graphs that
LLMs extract from text and (2) human perceptual and cognitive limits in XR environments. Second, it proposes an Intelligent Adaptive Visualization framework built on three pillars—adaptive layout optimization, uncertainty- aware attention guidance, and deep provenance transparency—that shifts immersive analytics from passive 3D rendering toward active cognitive assistance. Although this work does not include an empirical evaluation, its value lies in offering a systematic diagnosis of current limitations and a design roadmap grounded in converging evidence from the immersive analytics, cognitive load, and AI trustworthiness literatures.
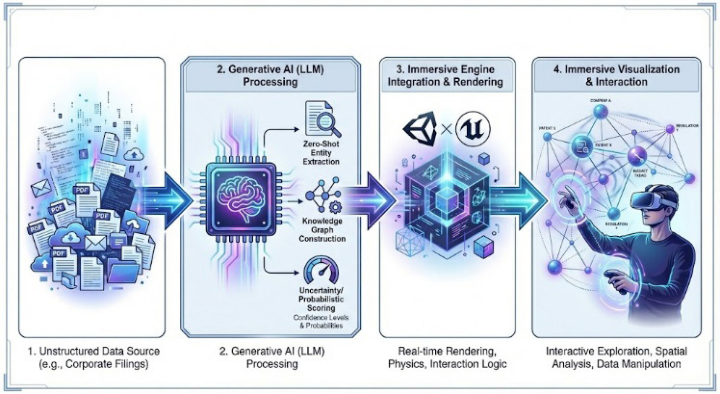
THE DATA PIPELINE: FROM TEXT TO 3D VISUALIZATION Traditional visualization systems predominantly rely on structured datasets stored in relational databases. However, in the modern information ecosystem, critical insights are increasingly embedded within unstructured text repositories, such as corporate filings, legal documents, or scientific reports (Gomez-Nieto et al., 2015; Wang et al., 2022). To bridge the gap between this raw textual chaos and coherent visual representation, we propose a multi-stage data pipeline driven by Generative Artificial Intelligence. Figure 1 illustrates this architectural flow, delineating the transformation of unstructured document collections into interactive, three-dimensional knowledge graphs within an immersive environment.
Figure 1: The data pipeline (image generated by Google Gemini AI).
Following extraction, the data must be structured into a coherent narrative. Raw entities extracted from different documents often refer to the same real-world concepts but are expressed using different terminology. Here, the pipeline employs LLM-based Entity Resolution to merge these disparate points into a unified Knowledge Graph (Wu et al., 2025). This graph construction is critical for visualizing complex systems, such as business ecosystems, where the relationships between companies, technologies, and market trends define
Bridging the Gap in Immersive Analytics: Visualizing Unstructured Data 25 the public narrative (Basole, Park and Seuss, 2024). Unlike a static database query, this graph structure is dynamic; as noted in systems like InsightLens, the data analysis becomes a conversational process where the underlying data structure evolves in real-time based on the analyst’s interaction and the AI’s continuous inference (Weng et al., 2025).
The final stage of the pipeline, shown on the right side of Figure 1, involves the translation of this high-dimensional, probabilistic graph into a spatial environment. The system integrates with real-time 3D engines (e.g., Unity or Unreal Engine) to render the graph nodes as interactive holographic objects. This transition from 2D textual data to 3D spatial coordinates allows analysts to utilize their spatial memory and depth perception to navigate the data (Weng et al., 2025). However, this visualization process introduces a novel challenge that distinguishes it from traditional analytics: the data points are not absolute facts but probabilistic outputs generated by an AI model. Consequently, the immersive visualization must represent not only the data itself but also the epistemic uncertainty inherent in the generation process, ensuring that the user can distinguish between high-confidence insights and potential model artifacts.
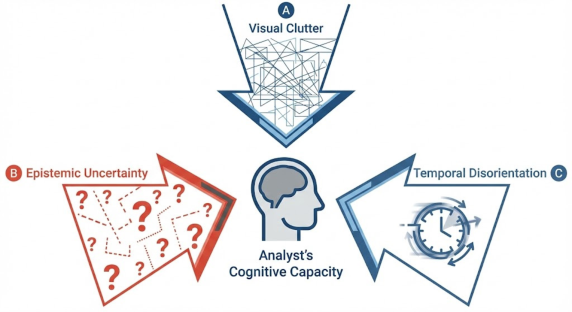
CHALLENGES IN IMMERSIVE ANALYTICS While the generative pipeline described in the previous section enables the automated extraction of structured knowledge representations from unstructured text and its subsequent transformation into spatial graphs, the practical utility of such immersive environments is currently constrained by severe perceptual and cognitive limitations. The transition from 2D screens to 3D Extended Reality (XR) offers an infinite canvas, yet this advantage often collapses when populated with the massive volume of interconnected entities and relations derived from large document collections. As illustrated in the schematic diagram in Figure 2, the analyst in such an environment is besieged by three converging forces that create a cognitive bottleneck: spatial occlusion, temporal disorientation, and the epistemic uncertainty introduced by AI hallucinations.
Figure 2: Schematic diagram of the cognitive bottleneck in immersive analytics: visual clutter, temporal disorientation, and epistemic uncertainty (image generated by Google Gemini AI).
The first barrier is the “Visual Clutter” paradox. Although 3D space introduces a depth dimension, displaying thousands of extracted entities— such as interlinked corporate subsidiaries or financial transactions— inevitably leads to dense hairball structures where critical topological features are obscured (Liu, Lv and Li, 2024). Peng et al. define this clutter not merely as an excess of items, but as a state where the visual representation interferes with the viewer’s ability to discern patterns (Wei Peng, Ward and Rundensteiner, 2004). In immersive environments, this manifests as severe occlusion, where data points hide one another, forcing the user to constantly navigate and change perspectives to retrieve basic information. This physical and perceptual effort directly impacts cognitive load. As demonstrated by Suzuki et al. and Wenk et al., the increased demand on working memory and the physiological stress of navigating cluttered 3D spaces significantly degrade the user’s analytical performance and decision-making speed compared to traditional interfaces (Wenk et al., 2023; Suzuki, Wild and Scanlon, 2024).
Beyond spatial complexity, the temporal dimension presents a unique challenge in immersive analytics. Financial and legal disclosures are inherently dynamic; relationships evolve, and entities appear or vanish over time. However, visualizing these temporal changes in 3D is notoriously difficult. Fouché et al. highlight that current design spaces for time-varying 3D data lack definitive guidelines; showing all timeframes simultaneously creates visual chaos, while animating changes often leads to change blindness, where users fail to notice critical events occurring outside their immediate field of view (Fouché et al., 2022).
However, the most insidious challenge introduced by the integration of Generative AI is Epistemic Uncertainty. Unlike traditional datasets where errors are typically random noise, LLMs suffer from hallucinations, generating content that is nonsensical or unfaithful to the source input while appearing plausible (Huang et al., 2025). In the context of knowledge graph construction, this can lead to the misattribution of financial figures (Li et al., 2025). This creates a crisis of trust. As noted by Dai et al., users struggle to distinguish between factual data and model artifacts without explicit trust calibration mechanisms (Dai et al., 2025). Kamal et al. argue that failing to visualize this uncertainty leads to flawed decision-making; yet, standard immersive visualizations often render AI-generated nodes with the same solidity and opacity as verified facts, creating a false sense of precision (Kamal et al., 2021).
FUTURE DIRECTIONS: TOWARDS INTELLIGENT IMMERSIVE ANALYTICS To overcome the cognitive and epistemic bottlenecks described in the previous section, the design of immersive analytics systems must shift from passive data representation to active, intelligent assistance. These capabilities are derived directly from the barriers identified in the preceding section: adaptive layouts address visual clutter (Section 3, Barrier 1), uncertainty-aware guidance addresses both temporal disorientation and epistemic uncertainty (Barriers 2 and 3), and provenance mechanisms address the trust deficit created by AI
Bridging the Gap in Immersive Analytics: Visualizing Unstructured Data 27 hallucinations (Barrier 3). The next generation of VR/XR visualization tools should therefore incorporate three foundational capabilities: adaptive layout optimization, uncertainty-aware attention guidance, and deep provenance transparency.
Adaptive and Dynamic Layouts The static force-directed algorithms currently used in most 3D graph visualizations are insufficient for the scale of data generated by modern LLMs. As Peng et al. (2004) state, reducing visual clutter requires dimension reordering techniques that dynamically adapt to the user’s focus (Wei Peng, Ward and Rundensteiner, 2004). One promising strategy is semantic zooming: from a distance the system aggregates individual nodes into high-level thematic clusters, preventing occlusion; as the user approaches, the visualization seamlessly unfolds to reveal granular connections (Liu, Lv and Li, 2024). Furthermore, adaptive designs must account for the user’s Frame of Reference (FOR). Sardana et al. demonstrate that allowing seamless transitions between egocentric (immersive) and tethered (overview) perspectives significantly improves user preference and task efficiency (Sardana et al., 2023). This focus + context approach ensures that the user’s working memory is not overwhelmed by irrelevant data, maintaining a manageable cognitive load (Wenk et al., 2023).
Uncertainty-Aware Attention Guidance Given the change blindness inherent in dynamic 3D environments, systems must actively guide user attention to critical events. Instead of expecting the analyst to notice a subtle change in a dataset of thousands of nodes, the system should utilize saliency-based cues, such as directional glows, haptic feedback, or sonification to redirect gaze towards anomalies or new temporal updates. Recent findings by Sardana et al. indicate that event-based sonification acts as a powerful guide for temporal orientation, helping users identify patterns and increasing their analytical confidence in mixed-reality environments (Sardana et al., 2025). Furthermore, the attention mechanism must integrate the model’s uncertainty metrics to prevent misleading the analyst. The system should visually emphasize high-confidence data points, while explicitly marking low-confidence areas as requiring verification. By integrating eye-tracking data, the system can measure cognitive load in real- time (Suzuki et al., 2023) and simplify the visualization automatically if it detects that the user is becoming overwhelmed.
Transparency and Provenance Mechanisms To mitigate the risk of AI hallucinations, immersive visualizations must provide deep transparency. It is not enough to simply display a link between two entities; the system must allow the user to verify the source of that link. We propose an interaction paradigm of click-to-verify, where interacting with a node instantly retrieves and displays the original text snippet from
the unstructured source document (e.g., the specific paragraph in a PDF) alongside the confidence score of the LLM (Huang et al., 2025). This provenance mechanism is essential for trust calibration, allowing analysts to cross-reference AI-generated insights with ground truth without leaving the immersive environment.
Applications of Generative AI and XR in Accounting The convergence of Generative AI and XR offers a compelling approach to addressing persistent challenges in accounting related to data fragmentation, complexity, and emerging risk domains. Modern accounting increasingly relies on structured and unstructured (e.g., voice, text, images) data that is scattered across multiple platforms, including financial statements, sustainability reports, regulatory filings, and third-party databases, making holistic analysis difficult using traditional two-dimensional tools (Thomson Reuters, 2024). Immersive XR environments can spatially integrate these heterogeneous data sources, enabling users to explore relationships among financial, non-financial, and narrative disclosures in a more intuitive and cognitively aligned manner, while AI supports automated extraction, synthesis, and interpretation of both structured and unstructured information. Generative AI can automate complex tasks such as drafting financial reports, summarizing large volumes of transactional data, and generating scenario- based forecasts, thereby reducing manual effort and improving efficiency. When combined with XR, these outputs can be embedded within immersive environments that allow accountants and stakeholders to interact with financial data spatially rather than through traditional flat interfaces. For example, XR–AI applications are particularly relevant for accounting considerations surrounding cybersecurity breaches (Centric Consulting, 2025), which pose significant financial, operational, and reputational risks. As accountants play an expanding role in risk assessment, assurance, and disclosure related to cybersecurity incidents, immersive and AI-augmented systems can support scenario analysis, visualization of interconnected risk exposures, and improved understanding of the financial consequences of breaches across organizational systems. As another example, consider a map-like graph in an XR environment where Environmental, Social, and Governance (ESG) factors and firm fundamentals are arranged as interconnected regions, with clusters linking to outcomes like cost efficiency, profitability, and risk; generative AI builds and updates these connections from disclosures, allowing users to trace how changes in ESG performance propagate through the network to impact financial results. Collectively, XR– AI technologies enable accounting to move beyond static reporting toward interactive, integrative, and risk-aware analysis, aligning the discipline with the demands of data-intensive decision-making and expanding opportunities for accounting research, education, and professional practice.
CONCLUSION
The convergence of Generative AI and XR presents an unprecedented opportunity to redefine how we analyse the world’s exponentially growing unstructured data. By transforming static text into navigable, spatial knowledge graphs, we can unlock insights that are invisible in traditional two- dimensional displays. However, as this paper argues, the mere technological capability to render massive datasets in 3D is insufficient. Without rigorous attention to human cognitive limits and epistemic uncertainty, such systems risk replacing information scarcity with information chaos. We conclude that the future of immersive analytics lies not in larger screens or higher resolutions, but in cognitive adaptivity. Successful systems will be those that can intelligently filter visual clutter, actively guide human attention to trusted signals, and transparently expose the probabilistic nature of AI-generated knowledge. Only by bridging the gap between algorithmic power and human perception can we fully realize the promise of immersive analytics in the era of Generative AI.
ACKNOWLEDGMENT
The authors would like to acknowledge support through a grant from the U.S. National Association of State Board of Accountancy (NASBA).
REFERENCES
Basole, R.C., Park, H. and Seuss, C.D., 2024. Complex business ecosystem intelligence using AI-powered visual analytics. Decision Support Systems, 178, p. 114133. https://doi.org/10.1016/j.dss.2023.114133. Cavallo, M., Dolakia, M., Havlena, M., Ocheltree, K. and Podlaseck, M., 2019.
Immersive Insights: A Hybrid Analytics System for Collaborative Exploratory Data Analysis. In: 25th ACM Symposium on Virtual Reality Software and Technology. [online] VRST ’19: 25th ACM Symposium on Virtual Reality Software and Technology. Parramatta NSW Australia: ACM. pp. 1–12. https:// doi.org/10.1145/3359996.3364242 Dai, S., Xu, C., Xu, S., Sun, Z., Pang, L., Dong, Z. and Xu, J., 2025. Trustworthy Information Retrieval in the LLM Era: Bias, Unfairness, and Hallucination. In: Proceedings of the 2025 Annual International ACM SIGIR Conference on Research and Development in Information Retrieval in the Asia Pacific Region. [online] SIGIR-AP 2025: Annual International ACM SIGIR Conference on Research and Development in Information Retrieval in the Asia Pacific Region. Xi’an China: ACM. pp. 442–446. https://doi.org/10.1145/3767695.3769670 Donalek, C., Djorgovski, S.G., Cioc, A., Wang, A., Zhang, J., Lawler, E., Yeh, S.,
Mahabal, A., Graham, M., Drake, A., Davidoff, S., Norris, J.S. and Longo, G., 2014. Immersive and collaborative data visualization using virtual reality platforms. In: 2014 IEEE International Conference on Big Data (Big Data). [online] 2014 IEEE International Conference on Big Data (Big Data). Washington, DC, USA: IEEE. pp. 609–614. https://doi.org/10.1109/BigData.2014.7004282
Ens, B., Bach, B., Cordeil, M., Engelke, U., Serrano, M., Willett, W., Prouzeau, A., Anthes, C., Büschel, W., Dunne, C., Dwyer, T., Grubert, J., Haga, J.H., Kirshenbaum, N., Kobayashi, D., Lin, T., Olaosebikan, M., Pointecker, F., Saffo, D., Saquib, N., Schmalstieg, D., Szafir, D.A., Whitlock, M. and Yang, Y., 2021. Grand Challenges in Immersive Analytics. In: Proceedings of the 2021 CHI Conference on Human Factors in Computing Systems. [online] CHI ’21: CHI Conference on Human Factors in Computing Systems. Yokohama Japan: ACM. pp. 1–17. https://doi. org/10.1145/3411764.3446866 Fouché, G., Argelaguet Sanz, F., Faure, E. and Kervrann, C., 2022. Timeline Design
Space for Immersive Exploration of Time-Varying Spatial 3D Data. In: Proceedings of the 28th ACM Symposium on Virtual Reality Software and Technology. [online] VRST ’22: 28th ACM Symposium on Virtual Reality Software and Technology. Tsukuba Japan: ACM. pp. 1–11. https://doi.org/10.1145/3562939.3565612 Gomez-Nieto, E., Casaca, W., Hartmann, I. and Nonato, L.G., 2015. Understanding Large Legal Datasets through Visual Analytics. In: 6th Workshop Vis. Analytics Inf. Vis. Sci. Vis. SIBGRAPI. Gračanin, D., 2018. Immersion Versus Embodiment: Embodied Cognition for
Immersive Analytics in Mixed Reality Environments. In: D.D. Schmorrow and C.M. Fidopiastis, eds. Augmented Cognition: Intelligent Technologies, Lecture Notes in Computer Science. [online] Cham: Springer International Publishing. pp. 355–368. https://doi.org/10.1007/978-3-319-91470-1_29 Hashmi, S.U. and Bansal, A., 2019. Information Extraction and Visualization of Unstructured Textual Data. In: 2019 IEEE 13th International Conference on Semantic Computing (ICSC). [online] 2019 IEEE 13th International Conference on Semantic Computing (ICSC). Newport Beach, CA, USA: IEEE. pp. 142–145. https://doi.org/10.1109/ICOSC.2019.8665534 Huang, L., Yu, W., Ma, W., Zhong, W., Feng, Z., Wang, H., Chen, Q., Peng, W., Feng,
X., Qin, B. and Liu, T., 2025. A Survey on Hallucination in Large Language Models: Principles, Taxonomy, Challenges, and Open Questions. ACM Transactions on Information Systems, 43(2), pp. 1–55. https://doi.org/10.1145/3703155 Kamal, A., Dhakal, P., Javaid, A.Y., Devabhaktuni, V.K., Kaur, D., Zaientz, J. and Marinier, R., 2021. Recent advances and challenges in uncertainty visualization: a survey. Journal of Visualization, 24(5), pp. 861–890. https://doi.org/10.1007/ s12650-021-00755-1 Klein, K., Sedlmair, M. and Schreiber, F., 2022. Immersive analytics: An overview.
it - Information Technology, 64(4–5), pp. 155–168. https://doi.org/10.1515/itit- 2022-0037 Li, X., Lin, L., Wang, S. and Wu, H., 2025. Seeing Beyond Hallucinations: LLMbased Compositional Information Extraction for Multimodal Reasoning. In: Proceedings of the 48th International ACM SIGIR Conference on Research and Development in Information Retrieval. [online] SIGIR ’25: The 48th International ACM SIGIR Conference on Research and Development in Information Retrieval. Padua Italy: ACM. pp. 1000–1010. https://doi.org/10.1145/3726302.3730081 Liu, S., Lv, M. and Li, T., 2024. CubeFolding: Understanding the 3D navigation for
scatterplot matrix. In: Proceedings of the Twelfth International Symposium of Chinese CHI. [online] CHCHI 2024: Chinese CHI 2024. Shenzhen China: ACM. pp. 334–346. https://doi.org/10.1145/3758871.3758898 Moran, A., Gadepally, V., Hubbell, M. and Kepner, J., 2015. Improving Big Data visual analytics with interactive virtual reality. In: 2015 IEEE High Performance Extreme Computing Conference (HPEC). [online] 2015 IEEE High Performance Extreme Computing Conference (HPEC). Waltham, MA, USA: IEEE. pp.1–6. Olshannikova, E., Ometov, A., Koucheryavy, Y. and Olsson, T., 2015. Visualizing Big Data with augmented and virtual reality: challenges and research agenda. Journal of Big Data, 2(1), p. 22. https://doi.org/10.1186/s40537-015-0031-2
Bridging the Gap in Immersive Analytics: Visualizing Unstructured Data 31 Sardana, D., Donekal Chandrashekhar, N., Gračanin, D., Matković, K. and Earle, G.,
2023. Iterative Design of an Immersive Analytics Environment Based on Frame of Reference. In: J.Y.C. Chen and G. Fragomeni, eds. Virtual, Augmented and Mixed Reality, Lecture Notes in Computer Science. [online] Cham: Springer Nature Switzerland. pp. 86–100. https://doi.org/10.1007/978-3-031-35634-6_7 Sardana, D., Lisle, L., Gračanin, D., Bukvic, I.I., Matković, K. and Earle, G., 2025.
Evaluating the Impact of Sonification in an Immersive Analytics Environment Using Real-World Geophysical Datasets. In: 2025 IEEE Conference on Virtual Reality and 3D User Interfaces Abstracts and Workshops (VRW). [online] 2025 IEEE Conference on Virtual Reality and 3D User Interfaces Abstracts and Workshops (VRW). Saint Malo, France: IEEE. pp. 1224–1225. https://doi. org/10.1109/VRW66409.2025.00258 Suzuki, Y., Wild, F. and Scanlon, E., 2024. Measuring cognitive load in augmented reality with physiological methods: A systematic review. Journal of Computer Assisted Learning, 40(2), pp. 375–393. https://doi.org/10.1111/jcal.12882 Wang, B., Ma, K., Wu, L., Qiu, Q., Xie, Z. and Tao, L., 2022. Visual analytics and
information extraction of geological content for text-based mineral exploration reports. Ore Geology Reviews, 144, p. 104818. https://doi.org/10.1016/j. oregeorev.2022.104818 Wei Peng, Ward, M.O. and Rundensteiner, E.A., 2004. Clutter Reduction in Multi-Dimensional Data Visualization Using Dimension Reordering. In: IEEE Symposium on Information Visualization. [online] IEEE Symposium on Information Visualization. Austin, TX, USA: IEEE. pp. 89–96. https://doi. org/10.1109/INFVIS.2004.15 Weng, L., Wang, X., Lu, J., Feng, Y., Liu, Y., Feng, H., Huang, D. and Chen, W., 2025.
InsightLens : Augmenting LLM-Powered Data Analysis With Interactive Insight Management and Navigation. IEEE Transactions on Visualization and Computer Graphics, 31(6), pp. 3719–3732. https://doi.org/10.1109/TVCG.2025.3567131 Wenk, N., Penalver-Andres, J., Buetler, K.A., Nef, T., Müri, R.M. and Marchal- Crespo, L., 2023. Effect of immersive visualization technologies on cognitive load, motivation, usability, and embodiment. Virtual Reality, 27(1), pp. 307–331. https://doi.org/10.1007/s10055-021-00565-8 Whitlock, M., Smart, S. and Szafir, D.A., 2020. Graphical Perception for Immersive
Analytics. In: 2020 IEEE Conference on Virtual Reality and 3D User Interfaces (VR). [online] 2020 IEEE Conference on Virtual Reality and 3D User Interfaces (VR). Atlanta, GA, USA: IEEE. pp. 616–625. https://doi.org/10.1109/ VR46266.2020.00084 Wu, S., Yang, Y., Wu, W., Li, R., Zhang, Y., Wang, G., Tan, H., Liu, Z. and Shi, L.,
2025. Visual analysis of LLM-based entity resolution from scientific papers. Visual Informatics, 9(2), p. 100236. https://doi.org/10.1016/j.visinf.2025.100236
LISTED IN THE AHFE DIGITAL BOOKSTORE CATALOGUE
Explore the complete digital volume
Metaverse, Virtual Environments and Game Design
Read this individual research paper free through the original publisher, or explore the full digital proceedings book.
ISBN 978-1-964867-93-9
Explore this ISBN in the AHFE Bookstore ↗Listed in the July 2026 bookstore catalogue; search by ISBN to confirm current availability · Digital book purchase optional