Asma Aldrees, Denis Gracanin (2023). User Experience and E-government Services: Lessons Learned about Developing a Benchmarking Survey. In: Usability and User Experience. AHFE Open Access, vol. 110, pp. 21–31. https://doi.org/10.54941/ahfe1003174
In this paper, we presented a personal reflection on designing a benchmarking web-based questionnaire to evaluate user experience in e-government. The questionnaire is based on a global conceptual framework that is proposed to evaluate users’ adoption behaviors of e-government services along with five significant factors affecting the adoption behavior. We developed this questionnaire and explained the validity and reliability tests. The validity testing incorporates the content validity ratio measure by contacting 16 experts in e-government and technology adoption to evaluate the questionnaire items. Hence, the questionnaire items were reduced from 55 to 24 items after addressing experts’ evaluations. Then, a pilot study was conducted using Cronbach’s alpha to evaluate the reliability of the questionnaire. We recruited 100 participants to answer the questionnaire and then evaluated its reliability. The results showed acceptable values of Cronbach’s alpha. Hence, the questionnaire is proven ready to be used after ensuring its validity and reliability.
Developing a questionnaire is essential to the success of the research. How- ever, designing a highly developed questionnaire to conduct research is challenging. Survey results depend completely on the questionnaire design and the clarity of the questionnaire items. Hence, researchers should be careful in deciding about the information to be collected, the number of que- stionnaire items needed, the wording, and sequence of these items, and the questionnaire design (Babbie, 1990).
Moreover, questionnaires are used as indicators to evaluate a specific concept. Many national indicators, such as unemployment rates and the inflation rate, have been developed using questionnaires (Krosnick et al., 2015). Therefore, in this paper, we aim to develop a benchmarking web- based questionnaire to evaluate the user experience of the offered electronic services in the government sector (e-government). The questionnaire should be designed accurately to address issues of the offered services. Hence, decision-makers can inform the design of these services and enhance citi- zens’ experience based on the knowledge collected via a given questionnaire.
When benchmarking questionnaires are applied in a user study, they need to fulfil two main quality criteria: validity and reliability testing. Validity, which determines the extent to which the questionnaire items are intended to mea- sure the corresponding aspect/factor. Reliability, which is an indicator of the statistical consistency among the questionnaire items (Bolarinwa, 2015).
In this paper, we aim to explain in detail the development of a standardized web-based questionnaire that works as a benchmarking indicator to evaluate the user experience of e-government services. We provide an insider account of our experience in developing web-based questionnaires. We also establish insightful guidance to develop valid and reliable questionnaires to evaluate the user experience of e-governments.
WEB-BASED QUESTIONNAIRE FOR USER EXPERIENCE The term User eXperience (UX) has various definitions, which all refer to the overarching approach of capturing and understanding the users’ actual experiences, attitudes, and feelings about the offered service or product. It is crucial to understand how the end users use the offered products or services, what users expect, and how the offered services make them feel. Therefore, UX research helps to understand users and make design decisions based on their feedback, which would enhance the overall user experience with the offered service.
This paper focuses on surveys as UX research tools, particularly web-based questionnaires. A study by (Vredenburg et al., 2002) reported the results of a survey conducted on user-centered design (UCD) practitioners. The survey involved hundreds of CHI’2000 attendees to identify the widely used methods, the key factors that predict success, and what practitioners should consider while conducting UCD research. Another study developed a compu- terized self-administered questionnaire on a touchscreen-based information kiosk to retrieve users’ feedback on the overall system usability (Blignaut, 2004). The study found that the results of this questionnaire can be trusted if they are analyzed correctly. Moreover, (Väätäjä and Roto, 2010) believed that UX studies move from laboratories to being remotely online using han- dheld mobile devices that provide new possibilities for studying UX. They presented essential guidelines for designing mobile questionnaires to measure the UX. (Alexandrovsky et al., 2020) conducted two user studies to examine different presentations of questionnaires in the Virtual Reality (VR) domain. They compared questionnaires in VR and questionnaires outside VR. How- ever, prior UX research did not focus on the actual process of designing the survey. Hence, we aim to report the researcher’s journey in implementing the web-based questionnaire in e-government domain.
THE PROPOSED FRAMEWORK AND HYPOTHESES
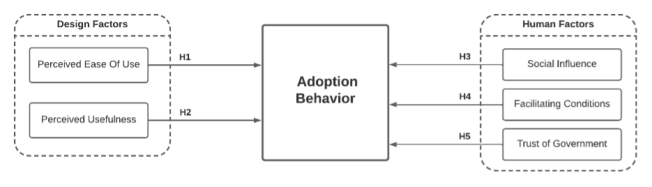
Figure 1 shows the proposed framework and demonstrates the hypoth- eses concerning the relationships among the adopted factors and the e- government adoption behavior factor, which are:
User Experience and E-Government Services 23
Figure 1: The proposed framework.
Perceived Ease of Use (PEOU): refers to the perception of the system’s easiness and users’ ability to use it. It reflects the usability of the system and users’ intention to adopt the system, which is free of effort (Davis, 1989).
Perceived Usefulness (PU): refers to the extent to which a user belie- ves that adopting a given system would enhance their job’s performa- nce (Davis, 1989).
Social Influence (SI): it is considered an essential determinant of users’ behavioral intention to adopt new technology. It refers to the degree to which peers affect the use of a system (Venkatesh et al., 2003).
Facilitating Conditions (FC): it is defined as “consumers’ perceptions of the resources and support available to perform a behavior.” It is measu- red by users’ perception of being able to use the required e-government resources (Venkatesh et al., 2003).
Trust of Government (TOG): it is a construct that refers to the fulfilment of expectations by ensuring that the other parties behave in a trusting and responsible manner. It describes the users’ confidence in the integrity of the services’ mediums (Bélanger and Carter, 2008).
The arrows represent the proposed hypotheses of the relationships betw- een the adopted five independent factors and the dependent factor (adoption behavior). It shows that the five independent factors significantly affect the adoption of e-government services.
METHODOLOGY
To understand the user experience of e-government services properly, we con- ducted the validity and reliability testing processes to provide a valid and reliable benchmarking web-based questionnaire that can be used to mea- sure users’ adoption behaviors of e-government services globally. The survey instrument is developed as a self-administered questionnaire.
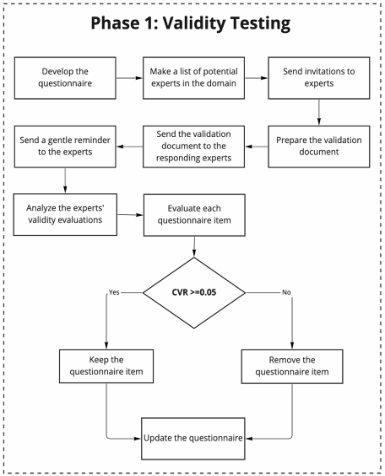
Phase-1: Validity Testing The crucial action posed by this step is determining whether the question- naire items are provided in a representative manner that could be used to evaluate the content of a corresponding construct (Dwivedi, Choudrie and Brinkman, 2006). Figure 2 explains the required steps to conduct the vali- dity testing. The preliminary stage in developing the survey instrument is
24 Aldrees and Graˇcanin
Figure 2: The validity testing steps.
providing a set of questionnaire items to measure each key factor proposed in the conceptual framework. In this case study, the questionnaire consists of five main factors: PEOU, PU, IS, FC, and TOG. The questionnaire items for each corresponding factor were retrieved from the literature studies in e-government. The web-based questionnaire was administered using Questi- onPro survey tool (QuestionPro., n.d.). Two main sections are included in the questionnaire. The first section consists of demographic questions that capture participants’ profiles. The second section includes the questions used to evaluate the adopted factors. It encompasses close-ended questions using a five-point Likert scale, ranging from strongly disagree (1) to strongly agree (5) (Likert, 1932). Initially, there were 55 questionnaire items, ten to evalu- ate each corresponding key factor and five to evaluate the adopting behavior factor.
The second stage is the judgment process. In this process, panelists will be invited to compare each factor’s definition with its items and score them using a scale of 1 (not relevant), 2 (important), and 3 (essential) (Straub, Gefen and Boudreau, 2004). After that, the Content Validity Ratio (CVR) formula will be calculated based on the data received from the content validity test by using the following equation (Lawshe, 1975): Content Validity = [n −(N/2)] / [N/2] (1)
In this equation, n represents the number of panelists who scored the items as “essential” and N is the total number of panelists. It enables computing the percentage of panelists who rated a specific item as “essential” to the corresponding construct. “Essential” responses will be considered positive indicators of the relevance of the questionnaire items to the corresponding
User Experience and E-Government Services 25
construct. The CVR will be tested for each questionnaire item for statistical significance at 0.05, which means that more than 50% of the panelists rate the items as “essential”; hence, the item has content validity to the correspon- ding construct. The survey instrument will be modified based on the experts’ content validation evaluation and comments.
Therefore, we prepared a list of experts to validate the developed questi- onnaire. The inclusion criteria of experts include:
Experts whose domain of interest is e-government and adoption of technology.
Experts who have conducted lots of research in e-government adoption, including quantitative research methods and developing questionnaires.
Experts working in e-government centres or authorities.
Experts who developed and participated in developing the well-known technology acceptance theories and models.
We ended up with 60 experts from 30 countries whom we believe are the best fit for evaluating the developed questionnaire. An invitation email was sent to all experts. We started the email by introducing ourselves and bri- efly explaining the research we were conducting. Then, we politely asked them whether they would agree to be involved in this process and evaluate the validity of the questionnaire items. Within two weeks after we sent the invitations, eight experts apologized due to their tied-up schedule, especially since we sent the email during the final examination period of the Spring2022 semester when most academics were busy concluding the semester. However, 20 experts replied to the invitation and showed a willingness to evaluate the questionnaire items.
The validation document was sent to the 20 experts. In the first week, we received three responses. After that, a gentle reminder was sent to the remaining 17 experts to remind them of the evaluation request. However, contacting experts who usually have busy schedules and are from diffe- rent time zones significantly affected their response time. Hence, we waited around three months and eventually received 16 evaluation documents from the experts. The responding experts are from 13 countries: USA, Mexico, Saudi Arabia, Oman, UAE, Qatar, Kuwait, Jordan, Slovenia, France, South Africa, Indonesia, and New Zealand.
Then, we analysed the evaluation documents by measuring the CVR for each item and modified the questionnaire by removing invalid items. We ended up with four questionnaire items to measure each independent key factor and four items to measure the dependent factor. In total, the question- naire includes 24 close-ended questions to evaluate users’ adoption behaviors of e-government services.
Comments Analysis: regarding the open-ended questions for comments and suggestions, we received many insightful and helpful comments from experts. We then analyzed and aggregated the comments based on the issues they discussed. The most common comments were regarding the rewording of the questionnaire items due to their ambiguity. In addition, merging simi- lar questionnaire items to reduce redundancy. Many experts mentioned the
26 Aldrees and Graˇcanin
use of simple words to ensure that respondents will understand them pro- perly and provide their opinions accordingly. Other experts asserted avoiding negative words and double-barreled questions, which usually include more than one issue to discuss. Most of these issues have been addressed and discussed in the literature. (Krosnick et al., 2015) provided recommendations and best practices for survey research. They addressed the abovementioned issues along with recommendations to tackle them. Accordingly, we follo- wed the experts’ advice and improved the questionnaire items based on their comments.
Another important issue has been raised regarding the questionnaire items in the TOG factor. Many experts addressed the difference between trust in government and trust in the technology offered by the government (e-government). They believed in the importance of clearly distinguishing between these two concepts and properly choosing the questionnaire items that reflect the correct concept. One of the experts mentioned that: “You may want to distinguish between trust in government vs. trust in (e-gov) techno- logy” (Expert 1). While another expert commented on this issue: “Trust is a multifaceted construct. In my own research, I consider trust in government, trust in government systems, and trust in technology used by the govern- ment as separate components/constructs that shape an individual’s trust in e-government”(Expert 13). In addition, another Expert said: “I’d suggest tailoring trust of government to be more specifically related to the online interaction. I may not trust the government to do its best for me, e.g. in terms of taxes, but perhaps I trust their competency to keep my personal data safe through their IT systems” (Expert 15).
Trust has received significant attention in the social science. In the govern- ment domain, trust in government indicates the trust in the current regime or personnel and the citizens’ attitude to its actual performance, rather than focusing on the government organizations or the offered services (Goldfinch, 2012). While the e-government concept deals with the technical issues and the trust in technology use and security that are offered by a specific government organization. It is not necessarily related to the trust of the actual govern- ment personnel or regime. Citizens may be more likely to use the offered e-government services if they are confident that their information is prote- cted and secured even though they do not trust the current government from the political point of view (Simon Horsburgh, Goldfinch and Gauld, 2011). (Morgeson and Petrescu, 2011) found that citizens who adopt e-government services did not have great satisfaction with the current government agency. The study indicated that citizens’ adoption of e-government services was due to the technical performance rather than the agency. Moreover, (Goldfinch, 2012) asserted that the adoption of e-government demands trust in techno- logy itself and the technology performance offered by the given organization in the government sector.
Hence, we have taken this issue into consideration. As we mentioned ear- lier, we aim to develop a global conceptual framework that investigates users’ adoption behaviors of the offered e-government services. The working defi- nition of the TOG refers to the trust in the services and medium, not the government regime. We mainly focused on users’ adoption behaviors towards
User Experience and E-Government Services 27
the electronic services offered by the government organization from the per- spective of technology use and performance. Therefore, we have revised the questionnaire items for TOG factors and made sure that they focus on the trust in the electronic services provided through the technology, not the actual government agency.
Another issue was raised regarding the confusion between adoption and acceptance in the adoption behavior factor (the dependent variable). We pro- vided one questionnaire item that states the acceptance of the service as equivalent to the adoption behavior. However, one of the experts mentio- ned the issue of using these two concepts interchangeably: “You need to have a clear distinction between adoption and acceptance.” (Expert 16). (Renaud and van Biljon, 2008) asserted the distinction between adoption and acce- ptance of technology. The adoption of technology refers to the process of the user starting to know the technology and ending with adopting it. While acceptance is the attitude towards a technology before even using it. Besi- des, the technology theories and models used to evaluate the acceptance of technology are different from those used for the adoption behavior evalua- tion (Taherdoost, 2018). Therefore, we have revised the questionnaire items and removed the item that includes the acceptance term.
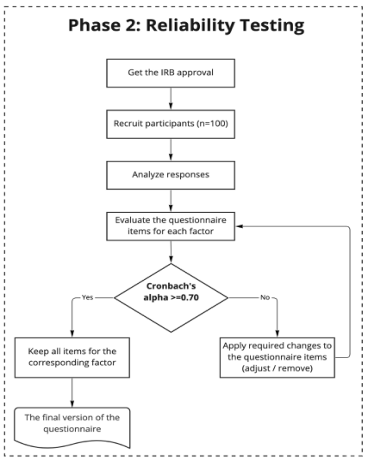
Phase-2: Reliability Testing In this step, we measure the internal consistency of the questionnaire and scale questionnaire items to ensure they are closely related to each corresponding factor. Figure 3 explains the required steps to conduct the reliability testing. First, the study was reviewed and approved by our university’s Institutional Review Board (IRB). Then, a pilot study was conducted by recruiting 100
Figure 3: The reliability testing steps.
28 Aldrees and Graˇcanin
participants to respond to the questionnaire. We then analyzed the respon- ses and calculated Cronbach’s for the whole questionnaire and then for the questionnaire items per each factor.
As shown in Table 2, Cronbach’s alpha for the questionnaire items related to each factor is greater than 0.70, which is the acceptable threshold point for Cronbach’s alpha. We proved the reliability of the questionnaire, and no changes are required to the questionnaire items. Therefore, after ensuring the validity and reliability of the questionnaire, it is now ready to be used for a given user study.
Table 1. The results of Cronbach’s alpha.
Table available in the original PDF paper.
Factor Name of factor Number Cronbach’s of items alpha
Perceived Ease Of Use 4 0.932 Independent factors
Adoption behavior 4 0.854
Perceived Usefulness 4 0.898 Social Influence 4 0.793 Facilitating Conditions 4 0.785 Trust of Government 4 0.829 Dependent factor Overall questionnaire 24 0.951
LESSONS LEARNED If there are words to describe the journey towards developing this web-based questionnaire, “insightful” would be the best one. There is a sense of anxiety when developing the questionnaire. On the first day, we spent several hours going through different resources online to understand what goes into the creation of a questionnaire. We were also a little bit nervous, given that the questionnaire was to be sent to the experts. Along the way, we had to make sure that we were not making a mistake lest we be perceived as an amateur in the field. But this also has its downsides, as we would discover. We realized that it is just fine to make mistakes and learn from them rather than focu- sing on being perfect. While doing the research on the right questionnaires, we had to dive into different research papers exploring a similar topic. This interaction deepened our understanding of the topic, and we had a chance to view the research topic from different angles. We also realized that lear- ning is indeed a continuous process. Each day, we came across new insights that were resourceful in this process. Hence, we identified several questions that were repeated over and included them in the questionnaire that we were developing.
Another highlighting moment was the process of contacting the experts. We contacted about 60 experts in an effort to get their feedback. Most of them had unpredictable work schedules making us wait a little bit longer than we expected. The feedback that we got from some of the experts was also
User Experience and E-Government Services 29
very critical of the research scope. Some of them wondered why we would be exploring such a topic that has already been widely researched, while oth- ers said the topic did not have significance. Some of them also opposed our proposal of a global framework to evaluate the user’s adoption behavior of e-government services. Although some of the comments made us almost feel discouraged, we were able to refine the topic and get rid of some of the things that we had underrated. Out of the 60 experts in the field that we contacted, only 20 of them replied. Four of them declined to evaluate the questionnaire for the reasons identified above. The 16 experts who participated provided good feedback, although some of them took a little longer-up to three months before they would give the feedback. There are some experts, after providing the feedback, who also decried the high number of questions that they had to go through. The questionnaire had 55 questions which they said were time consuming. A long questionnaire has a higher dropout rate, thus affecting the response rate. The whole process made us understand the need to have alternative approaches to apply in case the proposed research process fails to go on as planned. Flexibility in research can go a long way in getting the rese- arch completed within a short time. If we would conduct this process again, we will take these issues into considerable attention.
The third challenge was the issue of question bias. The problem occurs when one designs questions so that you will get the answers you are loo- king for in your research. It is similar to prompting the respondents to the questions. This research is a collaboration between a Ph.D. student and her supervisor. Through consultation and with the guidance of the supervisor, a lesson has been learned on the importance of getting emotions out of this process. It is essential to consult someone with vast experience when craf- ting the questions so that we can avoid biases. The supervisor played a great role in helping by going through the questions and refining them so that they could reflect the intended outcome of the research.
While doing the research, we realized that there is an absence of a global indicator of the user’s adoption behavior of e-government services which provided a motivation. There are many global indicators, such as the Social Progress Index (SPI) (The Social Progress Imperative, 2021) and the E-Government Development Index (EGDI) (The United Nations, 2020). As researchers, one of Our goals is to create an impact in this field. By creating a global indicator of user experience in e-government, we will have made an immense contribution. We also learned that during the initial stages of adoption, the researcher should focus on understanding the most common factors affecting the adoption behavior of the population on a global basis. Therefore, by creating a questionnaire that identifies these factors, we will at a better position to formulate good responses.
In conclusion, the entire process of developing the questionnaire opened our eyes to many aspects of this research. We have learned quite a number of lessons that will play a critical role in the future research that we will carry out in this field. The interaction with the experts also inspired confidence in us as researchers, as we were amazed by the deep understanding demonstrated by them.
30 Aldrees and Graˇcanin
CONCLUSION
In this paper, we have reflected on our experience in developing a bench- marking web-based questionnaire to evaluate users’ adoption behavior of e-government services. The questionnaire development approach includes validity and reliability testing phases. We have explained each phase in detail, along with the required steps to accomplish each phase. Out of this experie- nce, we shed light on some lessons and challenges that other UX researchers might find helpful. We hope that this paper will be a source of support by providing insights into the process of developing a valid and reliable questionnaire in UX research.
REFERENCES
Alexandrovsky, D. et al. (2020) ‘Examining Design Choices of Questionnaires in VR User Studies’, in Proceedings of the 2020 CHI Conference on Human Factors in Computing Systems - CHI’20, Honolulu HI USA: ACM, pp. 1–21. Babbie, E. (1990) Survey Research Methods. 2nd edn. Belmont, Calif: Wadsworth
Pub. Co. Bélanger, F. and Carter, L. (2008) ‘Trust and risk in e-government adoption’, The Journal of Strategic Information Systems, 17(2), pp. 165–176. Blignaut, P. J. (2004) ‘Computerized Self-Administered Questionnaires on Tou-
chscreen Kiosks: Do They Tell the Truth?’, in Proceedings of the 2004 CHI Conference on Human Factors in Computing Systems - CHI’04, Vienna, Austria: ACM, pp. 1183–1186. Bolarinwa, O. (2015) ‘Principles and methods of validity and reliability testing of questionnaires used in social and health science researches’, Nigerian Postgraduate Medical Journal, 22(4), p. 195. Davis, F. D. (1989) ‘Perceived Usefulness, Perceived Ease of Use, and User Acceptance
of Information Technology’, MIS Quarterly, 13(3), pp. 319–340. Dwivedi, Y. K., Choudrie, J. and Brinkman, W. (2006) ‘Development of a survey instrument to examine consumer adoption of broadband’, Industrial Management & Data Systems, 106(5), pp. 700–718. Goldfinch, S. (2012) ‘Public Trust in Government, Trust in E-Government, and Use
of E-Government’, in Z. Yan (ed.) Encyclopedia of Cyber Behavior. USA: IGI Global. Krosnick, J. A. et al. (2015) The Future of Survey Research: Challenges and Opportunities. The National Science Foundation Advisory Committee for the Social, Behavioral and Economic Sciences Subcommittee on Advancing SBE Survey, pp. 1–163. Lawshe, C. H. (1975) ‘A Quantitative Approach To Content Validity’, Personnel
Psychology, 28(4), pp. 563–575. Likert, R. (1932) ‘A Technique for The Measurement of Attitudes’, Archives of Psychology, 22(140), pp. 5–55. Morgeson, F. V. and Petrescu, C. (2011) ‘Do they all perform alike? An examination
of perceived performance, citizen satisfaction and trust with US federal agencies’, International Review of Administrative Sciences, 77(3), pp. 451–479. QuestionPro. (n.d.) QuestionPro Online Survey Software. Available at: https://ww w.questionpro.com/a/listSurveys.do.
User Experience and E-Government Services 31
Renaud, K. and van Biljon, J. (2008) ‘Predicting Technology Acceptance and Adoption by the Elderly: A Qualitative study’, in Proceedings of the 2008 annual research conference of the South African Institute of Computer Scientists and Information Technologists on IT research in developing countries: riding the wave of technology - SAICSIT’08, Wilderness, South Africa: ACM, pp. 1–10. Simon Horsburgh, Goldfinch, S. and Gauld, R. (2011) ‘Is Public Trust in Govern-
ment Associated With Trust in E-Government?’, Social Science Computer Review, 29(2), pp. 232–241. Straub, D., Gefen, D. and Boudreau, M.-C. (2004) ‘Validation Guidelines for IS Positivist Research’, Communications of the Association for Information Systems, 13, pp. 380–427. Taherdoost, H. (2018) ‘A review of technology acceptance and adoption models
and theories’, in Proceedings of the 11th International Conference Interdiscipli- narity in Engineering, INTER-ENG’17, Tirgu Mures, Romania: Elsevier, Inc., pp. 960–967. The Social Progress Imperative (2021) 2021 Social Progress Index - Executive Summary, pp. 1–21. The United Nations (2020) E-Government Survey 2020 Digital Government in the
Decade of Action for Sustainable Development. Gov 11. New York: The United Nations, p. 364. Väätäjä, H. and Roto, V. (2010) ‘Mobile questionnaires for user experience evaluation’, in Extended Abstracts on Human Factors in Computing Systems - CHI ‘10, Atlanta Georgia USA: ACM, pp. 3361–3366. Venkatesh, V. et al. (2003) ‘User Acceptance of Information Technology: Toward a
Unified View’, MIS Quarterly, 27(3), pp. 425–478. Vredenburg, K. et al. (2002) ‘A Survey of User-Centred Design Practice’, in Proceedings of the 2002 CHI Conference on Human Factors in Computing Systems - CHI’02, Minneapolis, Minnesota, USA: ACM, pp. 471–478.
LISTED IN THE AHFE DIGITAL BOOKSTORE CATALOGUE
Explore the complete digital volume
Usability and User Experience
Read this individual research paper free through the original publisher, or explore the full digital proceedings book.
ISBN 978-1-958651-86-5
Explore this ISBN in the AHFE Bookstore ↗Listed in the July 2026 bookstore catalogue; search by ISBN to confirm current availability · Digital book purchase optional