Yuying Zhang, Pei-Luen Patrick Rau (2026). Measuring workload of food delivery riders under algorithmic management. In: Social and Occupational Ergonomics. AHFE Open Access, vol. 228, pp. 31–41. https://doi.org/10.54941/ahfe1007933
With the global expansion of digital platforms, algorithmic management now structures food delivery work through time-based milestones that prioritize speed and efficiency, often shifting risks onto riders. Despite the workforce’s growing importance, evidence on its physical and psychological impacts remains largely survey-based, with little experimental research. This study proposes a conceptual framework linking algorithmic management (time control, task arrangement, performance evaluation, and interaction) to rider behaviours (delivery, riding, and order grabbing), governed by four behavioural rules: faster delivery, completing on time, faster riding, and grabbing more orders. These rules manifest as physical and psychological workload, moderated by demographic factors. To operationalize this framework, a laboratory-based food delivery simulation was developed. Twenty participants completed a 60-minute simulation using a Python-based rider interface and interactive riding videos under time pressure. Physical workload was measured via Heart Rate Reserve (HRR) using a wearable device, and psychological workload via NASA-TLX. Physical exertion was incorporated through stair and elevator navigation while carrying weighted loads to simulate last-mile delivery. Results showed that HRR effectively distinguished delivery stages, while temporal demand, mental demand, and effort were the dominant psychological workload dimensions. Linear regression models with delivery and riding performance as predictors moderately explained both physical and psychological workload. This study establishes a comprehensive framework for measuring food delivery riders’ workload, introduces an innovative laboratory simulation paradigm to assess gig-worker well-being under algorithmic management, and provides empirical evidence to inform better platform design and labour protections.
With the proliferation of digital economies and algorithmic technologies, the food service industry has experienced rapid growth in the gig economy. Since 2017, the global online food delivery market has doubled in value, surpassing $150 billion by 2021(Ahuja et al., 2021). This expansion is particularly evident in China, where the number of online food delivery users reached 553 million by June 2024, accounting for over half of the country’s total internet user base (CNNIC, 2024).
Measuring the workload and labour intensity of delivery riders remains complex and underexplored due to the profession’s flexibility and uncertainty. Feng et al. (2023) estimated reasonable workloads in 17 Chinese cities Received January 28, 2026; Revised April 8, 2026; Accepted April 24, 2026; Available online July 20, 2026
32 Zhang and Rau using survey and quantitative methods but did not classify labour intensity or effective working hours. Reyes et al. (2022) applied the NASA-TLX to FoodPanda riders in the Philippines, identifying combined physical and psychological stress during the pandemic. Other studies have examined links between workload and income dependence, occupational injuries, job stress, hazards, and safety behaviours (Zhan, Li and Zhao, 2023; Zheng, Zhan and Feng, 2023; Chen, 2023). However, existing research lacks detailed workload classification, evaluation, and experimental simulation under controlled conditions.
Rider workload can be analysed as physical and psychological components. Physical workload arises from carrying packages navigating stairs or elevators, and maintaining focused attention while riding (Feng et al., 2023). The lack of standardized measures reflects job uncertainty and links to occupational injuries and diseases. Psychological workload involves perceived workload and stress shaped by personal resources (e.g., self-efficacy), hazardous driving, risky attitudes, job autonomy, support, burnout, motivation, and happiness (Zhan, Li and Zhao, 2023; Zheng, Zhan and Feng, 2023; Nguyen-Phuoc et al., 2024), with excessive levels harming mental health and interpersonal relationships.
A unique aspect of delivery rider work is its algorithmic management by platforms. Riders are subjected to constant time pressure, task demands, and monitoring through mobile applications (Zheng, Zhan and Feng, 2023). Gamified incentives and digital rewards may unknowingly increase workload. According to the concept of Digital Taylorism (Park and Ryoo, 2023), algorithmic management integrates traditional managerial practices into digital systems. Under algorithmic management, food delivery riders exhibit behavioural intentions of faster delivery, completing on time, faster riding, and grabbing more orders (Feng et al., 2023; Zheng, Zhan and Feng, 2023). This study aims to contribute to the field of workload assessment and algorithmic management in the gig economy by addressing gaps in existing literature. Most prior studies have relied on surveys and interviews to examine workload (Reyes et al., 2022; Feng et al., 2023; Zhan, Li and Zhao, 2023; Zheng, Zhan and Feng, 2023), with limited experimental measurement. This research reviews existing descriptions of delivery rider workflows and workload, analyses physical and psychological workload factors, and proposes a laboratory simulation paradigm for assessing workload under algorithmic management. The paradigm provides insights into riders’ workload across different stages and develops models for workload assessment based on demographic variables and performance metrics.
LITERATURE REVIEW
Workflows of Food Delivery Riders Under Algorithmic Management Under algorithmic management, food delivery riders’ work is shaped by digital systems governing time control, task arrangement, performance evaluation, and interaction, which collectively structure behavioural norms and work experiences. Time control imposes rigid schedules across all delivery stages, with countdown timers and penalties intensifying pace, stress, and time
Measuring workload of Food Delivery Riders Under Algorithmic Management 33 pressure (Feng et al., 2023; Zheng, Zhan and Feng, 2023). Task allocation is automated through real-time data, but information asymmetries and competitive order-grabbing create uncertainty and psychological strain (Feng et al., 2023). Performance evaluation depends on quantified metrics and gamified incentives, centralising control over labour intensity and increasing work demands through Digital Taylorism (Chen, 2022). Platform-mediated interactions, including navigation and notifications, further reinforce compliance and accelerate delivery work (Chen, 2022).
Food delivery work consists of order grabbing, riding, and delivery, all shaped by algorithmic management. In order grabbing, algorithmic task arrangement limits informed decision-making and increases unpredictability, especially for gig riders who must constantly refresh screens to compete for orders (Feng et al., 2023). During riding, strict time limits, restaurant delays, traffic, weather, and enforcement pressures push riders to speed up, increasing stress (Zheng, Zhan and Feng, 2023). In the delivery stage, piece- rate pay, tight deadlines, customer monitoring, and penalty risks intensify pressure and encourage riders to prioritize speed over safety (Feng et al., 2023; Griesbach et al., 2019). Algorithmic management fragments these workflows into precise time- based milestones, embedding efficiency and speed imperatives into every stage. While this design ensures platform efficiency, it also shifts the burden of delays and risks onto riders, making them the enforcers of “last-mile” delivery efficiency (Feng et al., 2023). Across all stages, algorithmic management induces four key behavioural rules among riders:
Rule 1: Faster deliveries provide more time for subsequent orders, increasing overall income.
Rule 2: On-time deliveries avoid algorithmic penalties for lateness.
Rule 3: Higher riding speeds allow for more delivery time but are constrained by riding complexities.
Rule 4: Maximizing concurrent orders increases earnings within the same timeframe, provided deliveries remain on schedule.
Measurement of Physical Workload To date, few studies have directly measured the physical workload of food delivery riders in real-time work conditions. Existing research predominantly relies on surveys or interviews. For instance, Li et al. (2022) utilized questionnaires to assess musculoskeletal discomfort among riders. However, methods from other industries offer valuable insights for physical workload measurement.
In the logistics sector, Dewi and Septiana (2015) assessed workload using calorie consumption metrics based on the Indonesia National Standard. Rim and Jung (2022) evaluated physical workload in package delivery tasks using Heart Rate Reserve (HRR) and Metabolic Equivalent of Task (MET), captured via wristbands during pickup and delivery tasks. Similarly, Foy and Chapman (2018) measured cognitive workload during driving using near- infrared devices, eye-tracking systems, skin conductance, heart rate, and respiratory frequency. Deng et al. (2019) investigated the correlation between
34 Zhang and Rau pedal force distribution and increased heart rate (HRI) during naturalistic driving.
Given the significant physical activity involved in food delivery simulation and the simplicity of heart rate collection, HRR emerges as an appropriate metric. HRR accounts for individual differences such as age (Korshøj et al., 2021; Rim and Jung, 2022), making it a robust indicator for evaluating riders’ physical workload. This study thus proposes the following research question: RQ1: Can laboratory settings effectively simulate the physical workload of different food delivery stages? What are the HRR indicators for resting, riding, and delivery stages?
Measurement of Psychological Workload The NASA-TLX is a widely used and reliable tool for assessing perceived psychological workload (Hart, 2006) and has been applied to food delivery riders (Reyes et al., 2022). While prior studies have examined factors such as self-efficacy, hazardous driving, risky attitudes, and job burnout (Zhan, Li and Zhao, 2023; Zheng, Zhan and Feng, 2023; Nguyen-Phuoc et al., 2024), comprehensive scales like NASA-TLX provide more robust workload assessment. Other self-assessment tools, such as general health questions (DeSalvo et al., 2006) and the Accumulated Fatigue Checklist, have also been employed to evaluate riders’ physical and psychological health (Zhan, Li and Zhao, 2023). Considering the multidimensional nature of workload, this study asks RQ2: Which dimensions of psychological workload are most critical during food delivery?
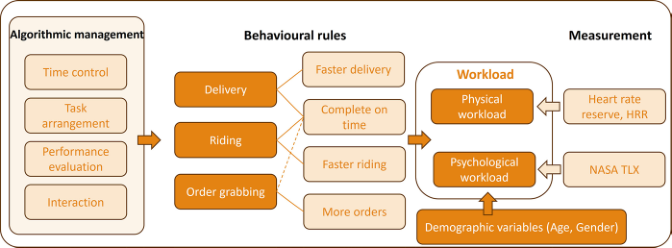
Figure 1: Formation and measurement framework of workload of food delivery riders under algorithmic management.
By integrating the above insights, this study constructs a framework (Figure 1) linking algorithmic management to riders’ behaviours and resulting workloads. Algorithmic management, characterized by time control, task arrangement, performance evaluation, and interaction shapes delivery, riding, and order-grabbing behaviours, generating physical and psychological workloads moderated by demographic factors (Reyes et al., 2022). Physical workload is measured using HRR (Korshøj et al., 2021; Rim and Jung, 2022), and psychological workload using the NASA-TLX (Reyes et al., 2022). This leads to RQ3: How do factors such as age, gender, and performance (delivery, riding, order grabbing) influence the assessment of workload intensity (physical and psychological)?
MATERIALS AND METHODS
Participants and Apparatus The experiment recruited 20 participants (ages 19-30 years, M = 22.86 years, SD = 3.72 years), including 10 males and 8 undergraduates, from a university in China.
Heart rate was continuously recorded using a Huawei Watch GT 3, with minute-level averages logged as the Device Heart Rate. Accuracy was ensured through calibration using a 15-second carotid pulse measurement at the end of each stage (resting/riding/delivery), multiplied by four to obtain the Calibrated Heart Rate.
A Python-based mobile application simulated a delivery rider’s app interface with three modules: New Tasks, To Pick Up, and In Delivery. Tasks were generated at irregular intervals with countdown timers, and participants interacted via time-limited buttons for order acceptance, pickup confirmation, and delivery completion, with delayed responses allowed after timeouts.
The riding simulation was implemented using the H5P platform. Four interactive videos (4-5 minutes each) were prepared to represent the delivery routes for two tasks. Interactive elements, such as prompts and single- or multiple-choice questions, were embedded in the videos.
Psychological workload was measured using the NASA Task Load Index (Hart, 2006), with six dimensions rated 0–100 and combined into a weighted score (0–5). After the experiment, participants completed an 8-item Behavioural Rules Verification Scale, with two items per each of four rules rated on a 7-point Likert scale (e.g., Rule 1: “I pick up and deliver at the fastest speed possible”).
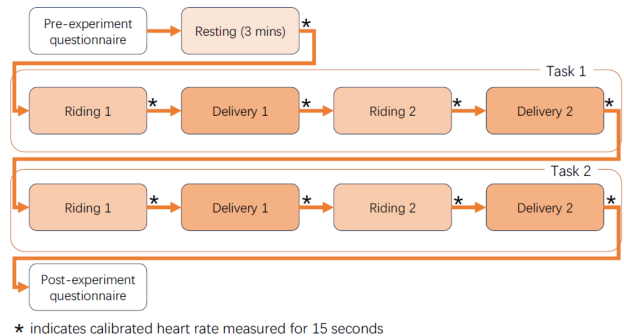
Procedure The experiment lasted about 60 minutes. Participants reviewed the procedure, provided informed consent, wore the heart rate device, completed a practice demonstration, and then proceeded to the formal experiment (see Figure 2).
Figure 2: Experimental procedure.
36 Zhang and Rau The experiment consisted of two fixed delivery orders. Orders were assigned at random intervals with randomized compensation, distance, and time limits, and participants could accept orders at any point before completing the second delivery. During each delivery, participants descended five floors, picked up a 1.5 kg weighted block, and returned upstairs; Delivery 1 used stairs, and Delivery 2 used an elevator. The riding stage was simulated with an interactive video requiring all questions to be answered correctly; participants could adjust playback speed or revisit questions but could not fast-forward.
Data Processing HRR was used as an indicator of physical workload to account for individual differences in age and fitness (Korshøj et al., 2021). To balance physical accuracy with operational constraints, we adopted the simplified calculation method described by Rim and Jung (2022):
HRR =
HRdelivery − HRresting HRmax − HRresting (1) where is the average heart rate during delivery. is the average heart rate during the initial 3-minute rest, and = 220 - age. The delivery stage was used as it best represents sustained physical exertion.
Performance was evaluated across three dimensions (delivery, order grabbing, and riding), each with a base score of 100, adjusted according to four behavioural rules and standardized using z-scores. Delivery performance rewarded on-time completion and early delivery, and penalized delays (Rule 1 and Rule 2). Order grabbing performance was based on reward value and time conflicts, with penalties for overdue deliveries (Rule 3); because frequent errors produced very low or negative scores, values below the 25th percentile were truncated. Riding performance was determined by time spent on interactive videos relative to their original duration, with scores averaged across four segments (Rule 4).
Statistical Analyses For heart rate, the normality assumption was not met; therefore, non- parametric tests (Wilcoxon tests or ARTANOVA) were used, with post hoc comparisons adjusted using the Holm method. For psychological and physical workloads, linear regression analyses were conducted with demographics and performance measures as predictors. Best subset selection based on adjusted R2 and BIC identified candidate models, which were further refined by removing non-significant predictors. A likelihood ratio test confirmed that the reduced models did not significantly compromise model fit. Workload measures were then categorized into low, medium, and high
Measuring workload of Food Delivery Riders Under Algorithmic Management 37 groups using quartiles, and t-tests compared key predictors and behavioural rule intentions between high- and low-workload groups to validate the workload assessment.
RESULTS
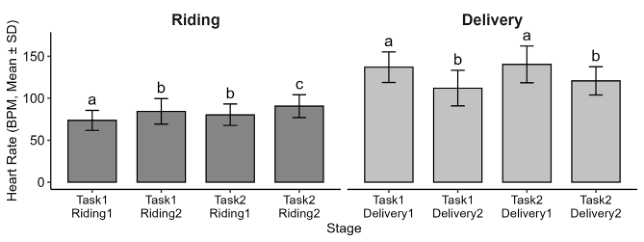
RQ1: Physical Workload The study effectively simulated the physical workload of food delivery in a laboratory setting. Calibrated Heart Rate confirmed the accuracy of the Device Heart Rate; therefore, Device Heart Rate was used in all subsequent analyses. Heart rate differed significantly across stages: resting (M = 73.55, SD = 10.34), riding (M = 82.20, SD = 14.53), and delivery (M = 127.47, SD = 22.51; F(2,38) = 149.99, p < .001, = .89). Post hoc analysis indicated significant differences between all stage pairs (all p < .001). Heart rate also varied significantly across riding stages (F(3,57) = 26.88, p < .001, = .59) and delivery stages (F(3,57) = 26.21, p < .001, = .58), as shown in Figure 3.
Figure 3: Heart rate across riding and delivery stages. Different letters denote significant post hoc differences (p < .05).
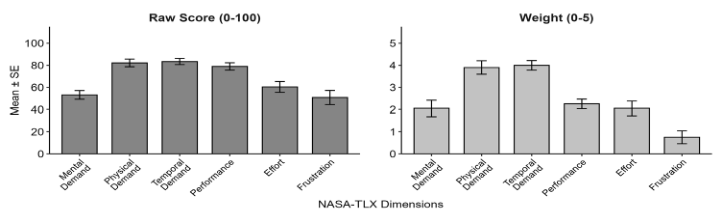
RQ2: Psychological Workload Participants identified the three most important dimensions of workload as temporal demand, physical demand, and effort, with the average scores of these dimensions following the same ranking (Figure 4).
Figure 4: Psychological workload (NASA-TLX): raw scores vs. importance weights.
For both psychological and physical workload, the fitted linear regression models included the same predictors (Table 1): delivery performance (DP) and riding performance (RP). The assumptions of multiple regression were largely met. Multicollinearity was not a concern (all VIFs < 2), and residual analyses indicated no serious violations of linearity, homoscedasticity, normality, or independence.
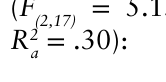
The regression model for psychological workload was significant (F(2,17) = 5.15, p = .02), explaining 37.8% of the variance (R2 = .38, R2
Equation reproduced from the original PDF.
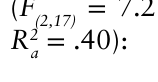
The regression model for physical workload was also significant (F(2,17) = 7.28, p = .01), accounting for 46.1% of the variance (R2 = .46, R2
Equation reproduced from the original PDF.Table 1: Linear regression results for psychological and physical workload.
Table available in the original PDF paper.
Response Predictor β SE t p (Intercept) 75.94 2.08 36.45 <.001*** DP 9.36 2.94 3.19 .005** Psychological Workload
RQ3b: Workload Group Comparison Psychological Workload was categorized into three quartile-based levels: low (0–25th percentile: 60.20–64.32, n = 5), medium (25th–75th percentile: 64.32–86.58, n = 10), and high (75th–100th percentile: 86.58–93.33, n = 5). Similarly, Physical Workload was classified as low (0–25th percentile: 0.10– 0.39, n = 5), medium (25th–75th percentile: 0.39–0.52, n = 10), and high (75th–100th percentile: 0.52–0.64, n = 5).
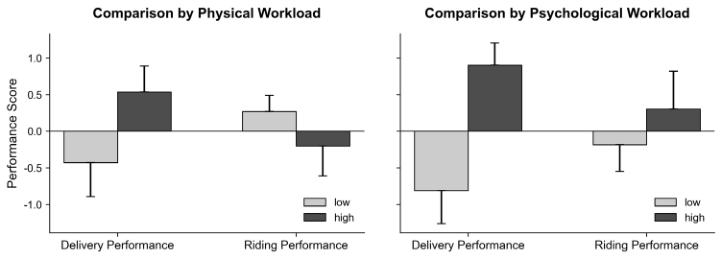
For the significant predictors in the regression models, group comparisons (Figure 5) showed that delivery performance was significantly higher in the high psychological workload group (M = 0.90, SE = 0.30) than in the low psychological workload group (M = −0.81, SE = 0.45), t = −3.17, p = .01. No significant differences were found for riding performance between psychological workload groups, nor for delivery or riding performance between physical workload groups (all p > .05).
Figure 5: Comparison of performance scores across workload levels.
For behavioural intentions, averaging the two items per rule, all four rules had mean scores above 4, supporting the rule assumptions. Among the intentions, only the intention to deliver faster differed significantly between workload levels: it was higher in the high psychological workload group (M = 6.60, SE = 0.29) than in the low group (M = 5.50, SE = 0.16), t = 2.50, p = .04, and higher in the high physical workload group (M = 6.70, SE = 0.20) than in the low group (M = 5.80, SE = 0.20), t = 2.00, p = .03.
DISCUSSION
Significant differences in heart rate indicate that the design captured distinct physical effort variations between seated riding and active delivery. However, the consistency of the measures across the riding stages suggests insufficient variability, indicating that the simulated tasks may not fully represent real- world riding and delivery conditions.
In terms of psychological workload, participants reported temporal demand, physical demand, and effort as the most prominent dimensions. These findings are partially consistent with Reyes et al. (2022), who also reported high physical demand and effort among delivery riders. However, temporal demand ranked lower in their study; this discrepancy may be due to the controlled and less dynamic nature of the simulated tasks or the uniformly high workload scores observed in this study. Overall, the results suggest that physical demand and effort are key contributors to delivery riders’ perceived workload, although future research should incorporate greater environmental variability and more representative task designs to better reflect real-world conditions.
Both psychological and physical workload models showed moderate predictive power, sharing two predictors: delivery performance (positive) and riding performance (negative). Despite their strong positive correlation (r = .68, p < .001), the negative coefficient for riding performance suggests a relative effect. Specifically, at a fixed delivery level, higher riding performance implies faster transit and a higher proportion of time spent on more strenuous tasks like walking or stair climbing. Thus, when controlling for shared variance, riding performance captures the lower workload intensity of riding relative to active delivery. Order grabbing performance was not retained in the
40 Zhang and Rau final model, possibly due to the simplified experimental setting. Participant feedback suggested that the lack of real delivery consequences led to random or strategic order grabbing, reducing the reliability of this measure. Future studies should introduce more realistic constraints on order assignment to improve its validity. Age and gender were also excluded from the models. Consistent with Reyes et al. (2022), age did not significantly predict psychological workload, and the student sample limited age variability. No significant gender effects were found, suggesting minimal influence of gender on perceived and physical workload in this context. Future research should recruit participants more representative of actual delivery riders.
Comparing high and low workload groups to verify the models, delivery performance differed significantly between psychological workload groups, while physical workload showed only marginal differences and riding performance showed none. This likely reflects the small sample size, which limited test power, and the high-pressure experimental setting, in which all participants fell into the high workload range (Reyes et al., 2022), reducing differentiation between groups.
CONCLUSION
This study provides an experimental framework for measuring riders’ workload under algorithmic management and offers new evidence and methods for complex delivery contexts. It successfully simulated physical and psychological workload in a laboratory setting, identifying key workload dimensions. Linear regression models showed moderate predictive power, with delivery and riding performance as main predictors. Limitations include sample size and controlled conditions. Future research should use larger, more representative samples, validate findings in real-world settings, refine performance metrics, and explore strategies to optimize task allocation for rider efficiency and well-being.
REFERENCES
Ahuja, K. et al. (2021) “Ordering in: The rapid evolution of food delivery,” McKinsey Insights, 22 September. Available at: https://www.proquest.com/ magazines/ordering-rapid-evolution-food-delivery/docview/2638062858/ se-2?accountid=14426. Chen, C. (2023) “Investigating the Effects of Job Stress on the Distraction and
Risky Driving Behaviors of Food Delivery Motorcycle Riders,” Safety and Health at Work, 14(2), pp. 207–214. Available at: https://doi.org/10.1016/j. shaw.2023.03.004. Chen, L. (2022) “Labor order under digital control: research on labor control of take-out platform riders,” The Journal of Chinese Sociology, 9(1), p. 17. Available at: https://doi.org/10.1186/s40711-022-00171-4. CNNIC (2024) The 54th Statistical Report on China’s Internet Development.
Beijing: China Internet Network Information Center. Available at: https://www. cnnic.com.cn/IDR/ReportDownloads/202411/P020241101318428715781.pdf (Accessed: January 18, 2026). Deng, T.-M. et al. (2019) “Pedal operation characteristics and driving workload on slopes of mountainous road based on naturalistic driving tests,” Safety Science, 119, pp. 40–49. Available at: https://doi.org/10.1016/j.ssci.2018.10.011.
Measuring workload of Food Delivery Riders Under Algorithmic Management 41 DeSalvo, K.B. et al. (2006) “Mortality prediction with a single general self-rated
health question,” Journal of General Internal Medicine, 21(3), pp. 267–275. Available at: https://doi.org/10.1111/j.1525-1497.2005.00291.x. Dewi, D.S. and Septiana, T. (2015) “Workforce Scheduling Considering Physical and Mental Workload: A Case Study of Domestic Freight Forwarding,” Procedia Manufacturing, 4, pp. 445–453. Available at: https://doi.org/10.1016/j. promfg.2015.11.061. Feng, X. et al. (2023) “Analysis of workload and labor intensity of food
delivery workers,” in J. Liu and J.S. Liu (eds.) China Salary Development Report (2023). Beijing: Social Sciences Academic Press, pp. 192–227. Available at: https://www.pishu.com.cn/skwx_ps/initDatabaseDetail?siteId= 14&contentId=15007715&contentType=literature. Foy, H.J. and Chapman, P. (2018) “Mental workload is reflected in driver behaviour, physiology, eye movements and prefrontal cortex activation,” Applied Ergonomics, 73, pp. 90–99. Available at: https://doi.org/10.1016/j.apergo.2018.06.006. Griesbach, K. et al. (2019) “Algorithmic Control in Platform Food Delivery
Work,” Socius, 5, p. 2378023119870041. Available at: https://doi. org/10.1177/2378023119870041. Hart, S.G. (2006) “Nasa-Task Load Index (NASA-TLX); 20 Years Later,” Proceedings of the Human Factors and Ergonomics Society Annual Meeting, 50(9), pp. 904– 908. Available at: https://doi.org/10.1177/154193120605000909. Korshøj, M. et al. (2021) “Heart rate during work and heart rate variability during
the following night: A day-by-day investigation on the physical activity paradox among blue-collar workers.,” Scandinavian journal of work, environment & health, 47(5), pp. 387–394. Available at: https://doi.org/10.5271/sjweh.3965. Li, Z. et al. (2022) “Risk factors for musculoskeletal disorders among takeaway riders: Up-to-date evidence in Shanghai, China,” Frontiers in Public Health, 10. Available at: https://doi.org/10.3389/fpubh.2022.988724. Nguyen-Phuoc, D.Q. et al. (2024) “What factors contribute to in-role and extra-role
safety behavior among food delivery riders?,” Transportation Research Part F: Traffic Psychology and Behaviour, 102, pp. 177–198. Available at: https://doi. org/10.1016/j.trf.2024.01.013. Park, S. and Ryoo, S. (2023) “How Does Algorithm Control Affect Platform Workers’ Responses? Algorithm as a Digital Taylorism,” Journal of Theoretical and Applied Electronic Commerce Research, 18(1), pp. 273–288. Available at: https://doi.org/10.3390/jtaer18010015. Reyes, J.E. et al. (2022) “Assessing the effect of physical health struggles of the
frontline delivery riders to their mental workload using NASA TLX,” in. 7th North American International Conference on Industrial Engineering and Operations Management, IEOM Society. Available at: https://doi.org/10.46254/ NA07.20220276. Rim, S.-C. and Jung, M.-C. (2022) “Evaluation of Workloads of Package Deliverers Focusing on Their Pickup and Delivery Tasks in Republic of Korea,” Sustainability, 14(9), p. 5229. Available at: https://doi.org/10.3390/su14095229. Zhan, J., Li, Y. and Zhao, Y. (2023) “More reliance, more injuries: Income dependence,
workload and work injury of online food-delivery platform riders,” Safety Science, 167, p. 106264. Available at: https://doi.org/10.1016/j.ssci.2023.106264. Zheng, Q., Zhan, J. and Feng, X. (2023) “Working safety and workloads of Chinese delivery riders: the role of work pressure,” International Journal of Occupational Safety and Ergonomics, 29(2), pp. 869–882. Available at: https://doi.org/10.1080 /10803548.2022.2085915.
LISTED IN THE AHFE DIGITAL BOOKSTORE CATALOGUE
Explore the complete digital volume
Social and Occupational Ergonomics
Read this individual research paper free through the original publisher, or explore the full digital proceedings book.
ISBN 979-8-950676-04-8
Explore this ISBN in the AHFE Bookstore ↗Listed in the July 2026 bookstore catalogue; search by ISBN to confirm current availability · Digital book purchase optional