Lucas Paletta, Michael Schwarz, Caroline Wollendorfer, Roland Perko (2021). Information Fusion for Driver Distraction Studies Using Eye Tracking Glasses. In: Advances in Human Aspects of Transportation: Part I. AHFE Open Access, vol. 15. https://doi.org/10.54941/ahfe100638
DIGITAL – Institute for Information and Communication Technologies, JOANNEUM RESEARCH Forschungsgesellschaft mbH, Graz, 8010, Austria b KfV – Austrian Road Safety Board, Schleiergasse 18, 1100 Vienna, Austria ↗
Eye tracking research about driver distraction, applied to real world driving tasks, has so far demanded a massive amount of manual intervention, for the annotation of hundreds of hours of head camera videos. We present a novel methodology that enables the automated integration of arbitrary gaze localizations onto a visual object and its local surrounding in order to draw heat maps directly onto the environment. Gaze locations are tracked in video frames of the eye tracking glasses’ head camera, within the regions about the driver’s environment, using optical flow methodology. The high robustness and accuracy of the optical flow based tracking - measured with a residual mean error of ca. 0.3 pixels on sequences, captured and verified in 576 individual trials - enables a fully automated estimation of the driver’s attention processes, for example in the context of roadside objects. We present results from a typical driver distraction study and visualize the performance of fully aggregated human attention behavior.
Driver distraction has for decades been a central focus of eye tracking research and applications (Young and Mahfoud, 2007). Driver distraction is one form of driver inattention and is claimed to be a contributing factor in over half of inattention crashes (NTHSA, 2009; World Health Organization, 2011). Eye tracking studies on driver attention have mainly been focused on studies in artificial environments, such as, in driver simulators (Zhang and Peterson, 2011; Paeglis et al., 2011; Ekanayake et al., 2013; Doshi and Trivedi, 2012). Analyzing the focus of attention in real world driving conditions from eye tracking data usually involves massive human resources for the manual annotation of tens or hundreds of hours of head camera videos, in particular if the experiments involve a substantial number of drivers and trials (Zhang and Peterson, 2011; Paeglis et al., 2011; Ekanayake et al., 2013).
We present a novel approach that enables the automated aggregation of gaze localizations from multiple drivers towards a reference road infrastructure and its environment. Gaze allocations in the driver’s environment are tracked with optical flow based computer vision methodology in the head camera video sequence and finally projected onto a selected key video frame. Gaze distributions of different drivers’ videos are aggregated by matching the respective key video frames. This technology enables for the first time, up to our knowledge, to estimate the driver’s distraction patterns from drivers’ eye tracking videos, with respect to the environment, in an automated manner.
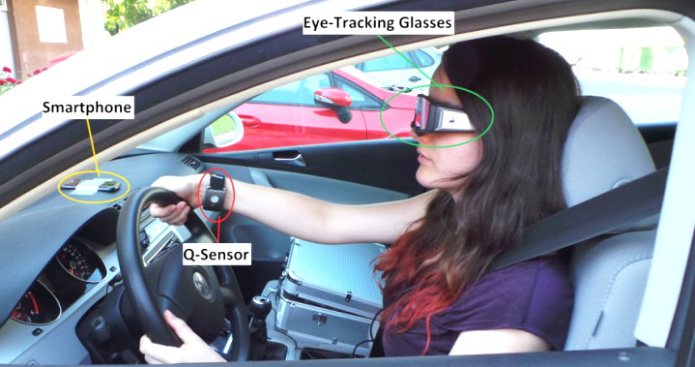
We applied the approach in a driver distraction study that would usually involve massive manual annotation including unpredictable error margins from human interaction. We demonstrate the successful approach with results from the fully automated aggregation of point-of-regards (PORs; Holmqvist et al., 2011), computation of dwell time and looking behavior on the target infrastructure. Figure 1 depicts the sensor setup used in the driver study: Eye Tracking Glasses (ETG) capture the eye movement behavior in a natural way, other sensors can be used for further data analysis that is not in the scope of this work.
Figure 1. Study on driver distraction using eye tracking glasses.
RELATED WORK
Eye tracking studies on driver attention have mainly been focused on studies in artificial environments, such as, in driver simulators (Ekanayake et al., 2013). (Harbluk et al., 2002) studied the impact of increased cognitive load while driving to drivers’ visual searching behavior. (Tijerina et al., 2004) examined drivers’ eye glance behavior away from the road scene ahead during car following. In (Chattington et al., 2009) driver distraction was investigated in the context of the effects of video and static advertising on human eye movements. The presented work is highly related to the one of (Fletcher et al., 2005). They presented a complete system that reads speed signs in real-time, compares the driver’s gaze, and provides immediate feedback if it appears the sign has been missed by the driver.
The presented work essentially extends the work in (Fletcher et al., 2005) by being capable of estimating the probability density of PORs with respect to its local neighborhood, in order to quantify the distraction effect caused by the sign as well as by its local environment, in an aggregated manner, i.e., over time and repetitive trials. From this it enables new avenues for estimating driver distraction.
VIDEO BASED MAPPING OF GAZE To automatically perform gaze mapping from eye tracking videos, a processing pipeline was developed, employing state-of-the-art computer vision techniques. The main concept is to track each POR from the frame of its occurrence over the whole video sequence, such that for each video frame all available PORs are mapped together with their trajectories through time. The workflow starts with a POR mapping from single video sequences followed by standard geometric image matching for the integration of POR information from multiple driver experiments.
Single Gaze Mapping. The mobile eye tracking system records a video of the driver’s view together with the Human Aspects of Transportation I (2021) coordinates of PORs for each video frame. To extract parameters for eye movement analysis, PORs have to be tracked over the video sequence. Standard methods for feature point tracking (such as, Lucas and Kanade, 1981; Tomasi and Kanade, 1991) and similar feature based methods (Kristan, M. et al. 2013) only yield reasonable accuracies if the points to be tracked are located on visually well-defined regions, i.e. on image locations with large local brightness variations (e.g. on corners of an object). Since PORs might often be located on comparably homogeneous image regions, such as the sky, the center of a billboard, or the road, outdoor driver’s gaze tracking requires a method which calculates the optical flow (i.e. the 2D shift vector) between two video frames, for each pixel, using global constraints to ensure a smooth solution (Zach et al., 2007).
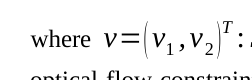
Typical variational formulation of the optical flow estimation required for gaze mapping over the video sequence is ❑
min
|Dv|+ λ‖ρ(v)‖1 Ω
Equation available in the original PDF paper.
0) the traditional
T : Ω→R
Equation reproduced from the original PDF.
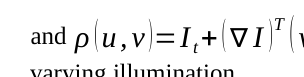
2 is the motion field, Ω the image plane, ρ (v )=It+ (∇I ) T (v−v optical flow constraint with I t the time derivative of the image sequence, ∇I the spatial image gradient, v 0 some given motion field, λ defines the tradeoff between data fitting and regularization, and |Dv| the distributional derivative which reduces to ‖∇v‖1. This formulation is based on constant pixel intensities over time. However, in our driving sequences this is not the case due to, e.g., sun flares, such that the extension in (Chambolle, A., and Pock , 2010) is used for the appropriate calculation in the specific application domain,
Equation available in the original PDF paper.
T (v−v
Equation reproduced from the original PDF.
0)+ βu with u:Ω →R and β the influence of the term which explicitly models the varying illumination.
(a) (b)
Figure 2. (a) Example of optical flow based POR trajectories (b) Single fixation mapping represented by resulting POR density.
With results of optical flow for the whole frame, the previously (tracked) PORs can be mapped to the next video frames by adding the according interpolated shift vector. It turned out that the input videos can be downscaled by a factor of two without losing essential accuracy but gaining a significant speed-up, and for robustness the resulting optical flow is median filtered with a spatial extend of 7x7 pixels. Overall, the coordinates of all PORs occurring in any previews video frame are known for the current, i.e. the latest, frame, simultaneously defining the trajectory through time for each POR (cf. Figure 2a). Next, each individual POR trajectory is analyzed. To be able to extract fixations, i.e., human gaze on the same location, we investigate if a POR from the previous frame projected to the current frame via tracking corresponds to the next occurring POR. A maximal distance threshold is defined (i.e., 0.5% of the image diagonal length) between subsequently tracked POR locations.
The main interest of the presented analysis is on the locations of attention in the traffic infrastructure, which consequently has to be annotated in the video sequences (regions of interest (ROIs), Figure 3); however, for a fully automated framework we imagine segmentation of optical flow information into semantic regions of interest, under verification by visual object detection.
−1 A
T A )
Aggregated Fixation Mapping. Two different types of aggregating the POR (or fixation) mappings are presented, as follows. First, all information from single fixation mapping can be collected for multiple videos holding the same scene (e.g. different drivers visiting the same scene or the same driver visits the location multiple times). In this case the parameters, e.g. histograms, can be aggregated for each ROI. Technically the same key frames are used which define the assignment of the ROIs to a unique region label, such that the aggregation is rather simple. Second, all tracked PORs coming from multiple videos can be transferred into one image, such that a focus of regard can be computed. The main difficulty is to find the geometric transformation between two video frames of different driving sessions. Our preferred solution is to employ the available key frame annotations and extract various corner points of the ROIs (the billboards to be specific). Then, a non-reflective similarity transformation is derived by solving the according over-determined linear equation system of the form Ax=b with x=( A
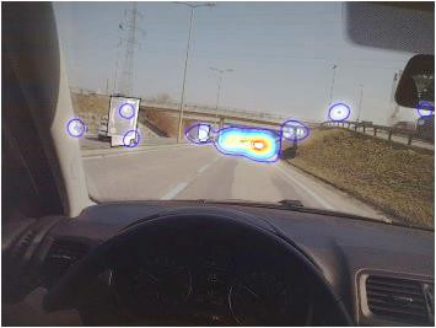
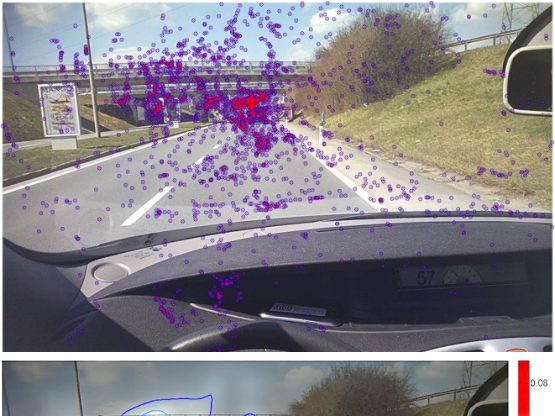
T b. Employing this transformation PORs can be transferred to one given video frame. For a more suitable visualization a density estimate is extracted by accumulating all those PORs in an image followed by a Gaussian smoothing. This density function can then be visualized by their brightness and contours (Figures 2b and 4).
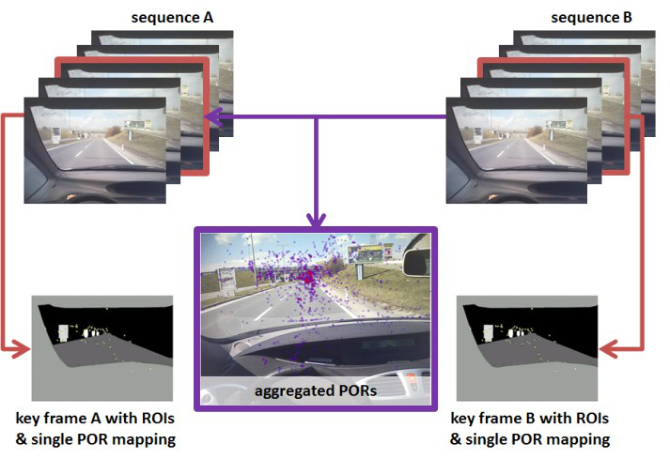
Figure 3 depicts in more detail the process of integrating single fixation mappings into aggregated fixation mappings. From any sequence of video frames, A, a specific key frame is selected (red frame) and annotated for its infrastructure objects; the single fixation mapping is then projected onto that key frame. In the same way, any other video sequence B will be treated, if it is about driving behavior about the same infrastructure objects, driving the same road. The integration of individual key frames and their single fixation mapping is dependent on the matching between the visual information in key frame A and the corresponding one in key frame B. As long as the key frame A origins from the same lane as B the proposed similarity transform yields highly accurate mappings. To avoid incorrect mappings the driving lane has to be determined. As all reference key frames A are selected from images stem from the right lane, key frames B from the left lane can be detected since the resulting transformations show scales below 0.8. That is the case as the billboards are closer to the driver on the left lane and the specific threshold was determined by experience. It turned out that more than 84% of key frames stem from the right lane and can therefore be correctly aligned.
Figure 3. Individual frame sequences determine the aggregated POR mapping resulting from geometrical image matching.
(a)
(b)
Figure 4. All fixations from 21 video sequences / single fixation mappings have been mapped into one final key frame. (a) Distribution of individual fixation location estimates in the key frame. (b) The resulting gaze density estimation super-imposed over the image (scaled in gaze points per pixel, right).
The study was performed with Eye Tracking Glasses (ETG) of SensoMotoric Instruments (SMI). According to national law on driver licenses, a horizontal field of view (FOV) of 120° must be guaranteed while ETG offer a FOV of 130-148° horizontal and 75-90° vertical FOV on average, for Caucasian type drivers. Calibration was performed using 3 points in a plane of distance ~4m; before and after the driving task, we asked users to fixate objects (traffic light, car, road sign) to check the accuracy of the calibration.
We performed two comparative eye tracking studies, involving car drivers into a driving task in the city of Graz (Austria), one before (November 2012) and one after (April 2013) the installation of advertising billboards. 12 drivers of different gender, age, and driving experience were asked to drive a prescribed track 2 times, each track being about 2 km long. Along the track, they passed 4 specific tracks of interest (Sequence I, II, III and IV) including 12 billboards, ROI #1 – ROI#12, of 7 different subjects in total. Billboards were mounted in the middle of the road, i.e., between two directional tracks. They contained subjects on both sides, therefore we can find different subjects at the same location but each being oriented towards an opposite side. The speed of the drivers could be estimated from GPS based trajectories and was approximately constant at 60 km/h.
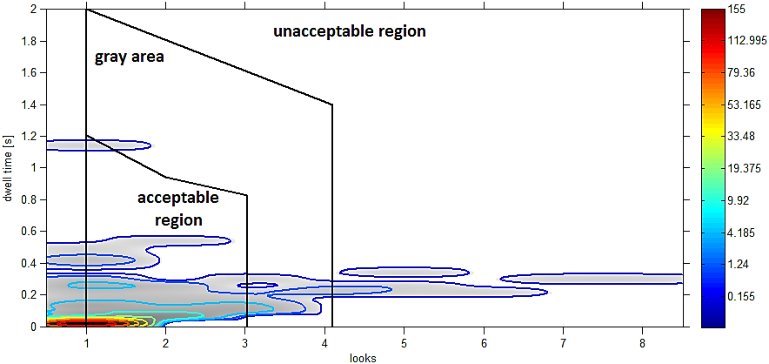
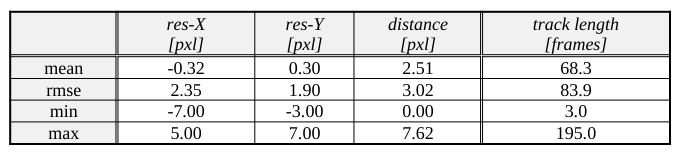
To be able to evaluate the potential accuracy of the optical flow based POR tracking 50 points were selected randomly from the 576 sequences at their first appearance, manually measured in the last frame of the sequence and then compared to the tracked point. The statistics of the residual errors in x, y and the distance in pixels are given in Table 1 together with the statistics on track length for those 50 points. Note that the maximal tracking length of 195 frames corresponds to 7.8 seconds of tracking. Manual measuring was done on pixel level and only on visually very distinct points such that the overall accuracy of tracking an arbitrary point is presumably worse. Anyway the accuracy is within a few pixels such that in the presented evaluation a POR will stay on the same object, which is the important aspect for this work. To be able to evaluate the transformation accuracy of aggregation mapping the statistics of the transformation residuals are given in Table 2. Those numbers represent the deviation of billboard corner points after transformation. Quantitative results of the automated processing of drivers’ video material are visualized in Figure 5.
(a)
(b)
(c)
Figure 5. Quantitative results of the fully automated processing and analysis of the 576 driver sequences. (a) Sample trial approaching 4 different billboards (ROI#1-4) association with ST (street), IN (vehicle inside) and BG (background). (b) Statistics on the fixations on billboard objects (ROI#1-12). (c) Risk diagram relating dwell and number of looks for decision systems (Zwahlen et al., 1988).
EXPERIMENTAL RESULTS In total, we collected 12 drivers’ experiments, 2 times for before/after comparison, each trial with 2 tracks, along 12 billboards within 4 test tracks of interest; we hence determined 12*2*2*12 = 576 video sequences, each including an approximation drive to a billboard appearance. This specific video frame refers to the key frame of the individual driver’s sequence. A comparison using complexity analysis between a standard ‘annotation’ tool versus our method quantifies the innovation: For the initial manual selection of attention objects, annotation of key frames, one needs 60 sec. with annotation (12 billboards, 5 sec. for each annotation) and 17280 sec. with our method (576 billboard appearances, A1=30 sec. each, complexity O*D*R*A1, O=12 number of objects, D=12 drivers, R=2*2=4 runs). Our method provides gaze distributions fully automated, whereas with annotation one needs F*D*R*A2, with F=800 frames to annotate, A2=3*4 sec. per annotation (4 sec. annotation; PORs outside the ROIs need to be annotated to be tracked in all 3 reference frames per sequence at the same time, for nearby ROIs in our case), with a total result of 460800 sec. for annotation (16 days, counting 8 hrs. per day) versus 17280 sec. (0.6 days) with a performance ratio for our method being 27 times faster. For large scale studies, e.g. with 4000 frames, 50 drivers, and 6 routes, it would amount to 14400000 sec. (annotation; 500 days) versus 108000 sec. (our: 3.8 days), being 133 times faster than manual annotation. Hence our method is suited very well for studies with F >> O which is usually the case in studies on driver attention.
Table 1: Accuracy of point tracking evaluated on 50 manually measured PORs.Table 2: Accuracy of the transformations for aggregation mapping.
Table available in the original PDF paper.
mean [pxl] std [pxl] min [pxl] max [pxl] 2.39 0.81 0.00 7.98
CONCLUSIONS
We presented a novel approach for estimating driver distraction in real driving tasks. The quantitative evaluation of the experiment has been outlined in a fully automated way, is highly feasible for large scale studies and takes attention objects as well as their environment into account. The tracking methodology, based on optical flow, proved to be highly accurate in the projection through long frame sequences and from this enables fully automated processing of large video databases for extensive driver studies.
The interpretation of the data from the concrete field trial demonstrate that visual orientation and persons are relevant, furthermore, that social gaze is capable to initiate social interactions with consequences on the overall evacuation results, and that orientation is highly focused on the ground during evacuation. We conclude from these significant cues that it is worth to continue with more focused studies on determining concrete parameters that we intend to provide to the interface of a cognitive simulation model.
ACKNOWLEDGMENTS
This work has been partially funded by the Austrian Research Prom. Agency by grant n°832045 (FACTS) and by the Austrian Road Safety Board.
REFERENCES
Chambolle, A., and Pock, T. (2010). A first-order primal-dual algorithm with applications to imaging. Technical Report, Institute for Computer Graphics and Vision, Graz University of Technology, Austria. Chattington, M., Reed, N., Basacik, D., Flint, A., and Parkes, A. (2009). Investigating driver distraction: the effects of video and
static advertising. Published project report PPR409. London, England: Transport Research Laboratory. Doshi, A. and Trivedi, M.M. (2012). Head and eye gaze dynamics during visual attention shifts in complex environments, Journal of Vision, 2012, 12(2):9, 1–16. Ekanayake, H.B., Backlund, P., Ziemke, T., Ram-Berg, R., Hewagamage, K.P., and Lebram, M. (2013). Comparing Expert
Driving Behavior in Real World and Simulator Contexts, International Journal of Computer Games Technology, Volume 2013, Article ID 891431. Fletcher, L., Loyb, G., Barnes, N., and Zelinsky, A. (2005). Correlating driver gaze with the road scene for driver assistance systems, Rob. and Auton. Systems 52, pp. 71–84. Harbluk, J.L., Noy, Y.I., and Eizenman, M. (2002). Impact of Cognitive Distraction on Driver Visual Behavior and Vehicle
Control. Transport Canada, TP# 13889. Holmqvist, K., Nyström, M., Andersson, R., Dewhusrt, R., Jarodzka, H., and van de Weijler, J. (2011) Eye Tracking – A Comprehensive Guide to Methods and Measures, Oxford University Press, 2011, pp. 187. Kristan, M. et al. (2013). The Visual Object Tracking VOT2013 challenge results. ICCV2013 Workshops, Workshop on Visual
Object Tracking Challenge. Lucas, B.D. and Kanade, T. (1981). An Iterative Image Reg-istration Technique with an Application to Stereo Vision. Proc.
International Joint Conference on Artificial Intelligence, pages 674-679. NTHSA (2009), An Examination of Driver Distraction as Rec-orded in NTHSA Databases. Research No. DOT HS 811 216. Paeglis, R., Bluss, K., and Atvars, A. (2011). Driving experience and special skills reflected in eye movements, Proc. of SPIE Vol. 8155. Tijerina, L, Barickman, F. S. and Mazzae E. N. (2004). Driver Eye Glance Behavior During Car Following. U.S. DOT and
NTSHA, Report Number: DOT HS 809 723. Tomasi, C. and Kanade, T. (1991). Detection and Tracking of Point Features. Carnegie Mellon University Technical Report CMU-CS-91-132. World Health Organization (2011). Mobile phone use: a growing problem of driver distraction. ISBN 9789241500890, Geneva. Young, M.S. and Mahfoud, J.M. (2007). Driven to distraction: Determining the effects of roadside advertising on driver
attention. Ergon. Research Group Report, Uxbridge, UK, Brunel Univ. Zach, C., Pock, T., and Bischof, H. (2007). A Duality Based Approach for Realtime TV-L1 Optical Flow. Proc. Symposium on Pattern Recognition (DAGM), Heidelberg, Germany, 214-223. Zhang, W. and Peterson, M. (2011). Predicting Patterns of Potential Driver Distraction Through Analysis of Eye-Tracking Data,
Proc. 3rd International Conference of Road Safety and Simulation, 2011. Zwahlen, H.T., Adams, C.C., and Debald, D.P. (1988). Safety aspects of CRT touch panel controls in automobiles. In: Vision in Vehicles – II, pp. 335-344.
LISTED IN THE AHFE DIGITAL BOOKSTORE CATALOGUE
Explore the complete digital volume
Advances in Human Aspects of Transportation: Part I
Read this individual research paper free through the original publisher, or explore the full digital proceedings book.
ISBN 978-1-4951-2097-8
Explore this ISBN in the AHFE Bookstore ↗Listed in the July 2026 bookstore catalogue; search by ISBN to confirm current availability · Digital book purchase optional