Cornu Joris, Brijs Kris, Daniels Stijn, Brijs Tom, Hermans Elke, Wets Geert (2021). Driving Behavior at Intersections Equipped with Red Light Cameras – A Monte Carlo Simulation Based on Driving Simulator Data. In: Advances in Human Aspects of Transportation: Part II. AHFE Open Access, vol. 16. https://doi.org/10.54941/ahfe100683
Background: Various impact evaluation studies of red light cameras (RLCs) showed an increase of rear-end collisions (up to 44%). Objective: To evaluate the driving and looking behavior of drivers at intersections equipped with RLCs in an urban area. Method: 63 participants passed an intersection without RLC, with RLC, and with RLC + warning sign (RLCWS) in a driving simulator. These data were used to estimate the risk of rear-end collisions by means of a Monte Carlo Simulation. Results: The relative risk of rear-end collisions for the intersection without RLC, with RLC, and with RLCWS was 1.97%, 12.65%, and 7.89% respectively. A higher percentage of participants observed the RLC when they stopped for the yellow light at the intersection with RLC, compared to the participants who did not stop (62% vs. 28%). Conclusion: Based on the Monte Carlo Simulation, risk of rear-end collisions increases when RLCs are installed. However, this risk decreases when a RLCWS is placed upstream. Application: Road administrations must consider the installation of RLCs very carefully. When RLCs are needed at certain intersections (e.g. to prevent red light running), road administrations should also deliberate about the potential of RLCWS in order to reduce the risk of rear-end collisions.
Red light running is a worldwide road safety problem. In 2009, it was the main crash cause in 5.3% of the fatal accidents and 3.7% of the seriously injured accidents (SWOV, 2011). Red light running at signalized intersections has a significant impact on road safety since this leads to more serious accidents, being side collisions or collisions with vulnerable road users (Kloeden, Ponte, & McLean, 2001; R. A. Retting, Ulmer, & Williams, 1999; Shin & Washington, 2007; SWOV, 2011). Therefore, road authorities most of the time place red light cameras (RLCs) at signalized intersections to prevent red light running and improve road safety (De Pauw, Daniëls, Brijs, Hermans, & Wets, 2012; Martinez & Porter, 2006). However, rear-end collisions tend to occur more frequently at these intersections. This is often the result of a sudden braking maneuver of the leading vehicle, resulting in the fact that the following vehicle cannot stop in time (Shin & Washington, 2007).
Some suggested countermeasures to decrease red light running are: increasing the duration of the yellow sign (McGee et al., 2012; R. A. Retting, Ferguson, & Farmer, 2008; R. Retting & Greene, 1997), improving visibility of traffic lights, reducing clutter around intersections, installing RLC warning signs, reducing speed limits near intersections, and improving consecutive signal coordination (Martinez & Porter, 2006; Quiroga, Kraus, van Schalkwyk, & Bonneson, 2003; R. A. Retting, Williams, Preusser, & Weinstein, 1995). Furthermore, RLCs are an effective tool to reduce red light running. Studies have shown that this reduction can be up to 44% (R. A. Retting, Ulmer, et al., 1999; R. A. Retting, Williams, Farmer, & Feldman, 1999). The effectiveness of RLCs is discussed in more detail below.
Urban areas are at greater risk for red light running crashes (De Pauw et al., 2012; R. A. Retting et al., 1995). Red light running even accounts for 22% of all urban crashes (R. A. Retting et al., 1995).
Effectiveness of red light cameras In general, the effectiveness of RLCs appears to be studied less extensively than the effectiveness of speed cameras. The studies which have been carried out primarily focus on the effects of RLCs on red light running and collisions (i.e. rear-end and side) at intersections. Erke (2009) performed a meta-analysis about the effectiveness of RLCs. After installing a RLC, an average increase of 13% was found in the number of injury crashes. When making a distinction between the accident type, an increase of 43% and a decrease of 10% was observed in the number of rear-end crashes and side collisions respectively.
Shin and Washington (2007) investigated the effectiveness of RLCs on 14 locations in Arizona by means of the Empirical Bayes method. They found a decrease of 20-45% in the number of side collisions. On the other hand, the rear-end collisions significantly increased by 41%.
Another study (Høye, 2013) found a non-significant decrease of all injury crashes by 13%. The number of right angle side collisions decreased by 13%, but the rear-end collisions increased by 39%. Furthermore, the effectiveness of RLCs tended to be higher when warning signs for the RLCs were set up at main entrances to areas with RLC enforcement than when each intersection with a RLC was signposted separately.
De Pauw et al. (2012) found an increase of 5-9% of the total injury crashes after the installation of RLCs at intersections. However, the serious accidents (i.e. seriously injured or death) showed a significant decrease of 14- 18%. The increase in the number of injury crashes can be mainly attributed to the increased number of rear-end collisions (44%). This number of rear-end collisions had a stronger rise at intersections in urban areas (+70%) than intersections outside the built-up area (+33%).
Persaud et al. (2005) conducted a before and after study with 132 locations equipped with RLCs. They found a significant decrease in the number of side collisions (16%) and increase for the rear-end collisions (24%). Thereby, they examined the spillover effects with a separate analysis for intersections where no RLC was installed. Spillover effects are those effects on the number of crashes at untreated intersections (i.e. no RLCs) that are close to an intersection with RLCs. There was a limited spillover effect (i.e. a slight decrease) for the number of right angle side collisions at intersections near intersections with RLCs. However, the number of rear-end collisions did not increase at the untreated intersections. Therefore, the authors concluded that the effect of RLCs is mainly restricted to the intersections equipped with RLCs (i.e. only a local effect).
Pulugurtha & Otturu (2014) also performed a before and after study to analyze the effectiveness of a RLC enforcement program. They indicated that RLCs lead to an increase in sideswipe and rear-end collisions at more than 50% of the signalized intersections.
A time series analyses showed that right angle collisions decreased by 46% at RLC intersections, but that there had also been an increase of 42% in rear-end crashes (Vanlaar, Robertson, & Marcoux, 2014). Results indicated that there were significantly fewer red light running violations after installing a RLC. Furthermore, RLCs had a protective effect on speeding behavior (also during green phases) at the intersections.
According to McCartt & Hu (2014) red light running declined significantly with 39% and 86% when traffic lights turned red for at least 0.5s and 1.5s respectively.
Porter et al. (2013) investigated the impact of a removal of the RLCs on red light running. The rate of red light running nearly tripled immediately after the removal of the RLCs and even quadrupled 1 year later. This means that there exists no time-halo effect concerning the use of RLCs. Human Aspects of Transportation II (2021)
There are significant variations with regard to the safety effects of RLCs between the different studies. Several factors that can play a role are: the visibility of the RLCs, the offense rate before placing the RLC, use of warning signs to announce the presence of a RLC, etc. (Erke, 2009). In conclusion, it can be said that many studies have found a decrease in the number of side collisions after the RLC was installed. On the other hand, these studies also observed an increase in the number of rear-end collisions.
Dilemma zone One of the main problems with signalized intersections is that drivers have to make a decision whether or not to stop at the yellow onset (Wilson, 2006; Yan, Radwan, Guo, & Richards, 2009; Zaal, 1994). This decision can be difficult, depending on the current speed and position of the vehicle. When the length of the yellow period is insufficient for the driver to stop comfortably, or to pass the stop line before the red phase has started, the driver is considered to be in the dilemma zone. The dilemma zone is a theoretical area of an intersection approach where a driver must take a decision (i.e. stop or go) when the traffic light is turned to yellow (McGee et al., 2012; Wilson, 2006; Yan et al., 2009). The actions of the driver (i.e. accelerate or brake) increase the potential for a dangerous situation (e.g. rear-end collision) to occur.
Especially when drivers approach a signalized intersection with a high speed, the dilemma zone problem results in that some drivers may stop abruptly while others may decide not to stop (or even accelerate). Such variation in driving behavior can lead to collisions (mainly rear-end collisions) on the intersection approach (Institute of Transportation Engineers (ITE), 2009; Yan et al., 2009) The boundaries of the dilemma zone are approximately 2.0-5.5 seconds from the stop line (Bonneson, Middleton, Zimmerman, Charara, & Abbas, 2002; Federal Highway Administration, 2005; McGee et al., 2012).
Warning signs RLC warning signs (RLCWSs) are in most cases set up to announce that the next intersection will be equipped with RLCs. Such warnings may have the potential to reduce the probabilities of collisions nearby intersections (Yan et al., 2009; Zaal, 1994). These warning signs can be placed at all RLC intersections or only at the main entrances to a specified area with multiple RLC intersections. If RLCWSs are only installed nearby these main entrances, spillover effects are more likely to occur because most drivers will not be aware of the exact locations of the RLCs (Høye, 2013).
Results indicated that the effects of RLCs are more favorable when not all RLC intersections are signposted separately (Høye, 2013). In general, drivers will have more respect for red lights when not all RLC intersections are signposted, which increases the favorable (i.e. prevention of red light running) and decreases the unfavorable (i.e. sharp braking maneuvers) effects of RLCs. These findings are supported by Zaal (1994). However, Zaal (1994) also indicated that generalized signposting can have a disadvantage. Generalized signposting may reduce the deterrent effect of site specific signposting, which possibly results in an increase of the number of accidents at potentially dangerous intersections.
Yan et al. (2009) investigated the effectiveness of a pavement marking with the word message “Signal Ahead”, which was placed upstream of signalized intersections. Results indicated that this marking had positive effects on the driving behavior at signalized intersections. The marking reduced the probabilities of both conservative-stop and risky-go decisions. Moreover, the marking contributed to a lower red light running rate and resulted in a lower deceleration rate for drivers who stopped at higher speed limit intersections.
Because rear-end collisions are the most common accident type at signalized intersections, Ni & Li (2013) studied the effectiveness of green signal countdown devices (GSCD). GSCD display the remaining seconds of the current signal status. These devices have been widely installed in Asia, but have both advantages and disadvantages. GSCD shortened the dilemma zone and reduced the number of rear-end collisions near the stop line during the yellow phase. On the other hand, these devices evoked risky car following behavior and resulted in higher rear-end collision probabilities during the flashing green phase (i.e. end of green phase). Therefore, Ni & Li (2013) recommended that GSCD should be installed cautiously.
OBJECTIVES The primary objective of this study is to evaluate the driving and looking behavior of drivers at signalized intersections equipped with RLCs in an urban area. For this purpose, 1 real world location was selected and rebuilt in the driving simulator at the Hasselt University’s Transportation Research Institute. At this location, 2 conditions (i.e. RLC and RLCWS) and one control condition (i.e. no RLC) are examined. The driving parameters are used to estimate the relative risk of rear-end collisions under these 3 conditions. We address the following research questions:
1. Is there a difference in decision behavior (i.e. stop or go) between the 3 conditions?
2. Is there a difference in (relative) risk of rear-end collisions between the 3 conditions?
3. Is there a difference in looking behavior (i.e. regions of interest) between: a. the control and RLC condition? b. the RLC and RLCWS condition?
METHODOLOGY
Participants Sixty-three volunteers (all gave informed consent) participated in the study. No outliers were identified based on the three interquartile distance criteria. Thus, the sample contained 63 participants (39 men), approximately equally divided over four age categories from 20 to 75 years old (mean age 46.2; SD age 18.1). All participants had at least two years of driving experience.
Driving simulator and eye tracker The experiment was conducted on a medium-fidelity driving simulator (STISIM M400; Systems Technology Incorporated). It is a fixed-based (i.e. drivers do not get kinesthetic feedback) driving simulator with a force- feedback steering wheel, brake pedal, and accelerator. The simulation includes vehicle dynamics, visual/auditory (e.g. sound of traffic in the environment and of the participant’s car) feedback and a performance measurement system. The visual virtual environment was presented on a large 180° field of view seamless curved screen, with rear view and side-view mirror images. Three projectors offer a resolution of 1024 x 768 pixels and a 60 Hz frame rate. Data were collected at frame rate.
The eye movements of the participants were recorded while driving through the scenario, making use of a camera-based eye tracking system (faceLAB 5 Seeing Machines). The recorded eye tracking data were analyzed with the EyeWorks software package.
Scenario Road segment selection and description
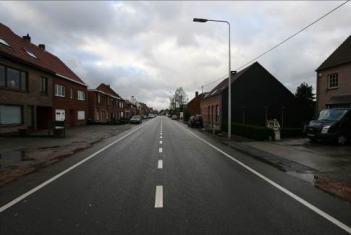
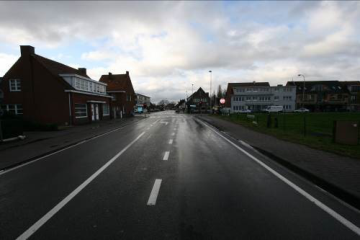
The real world location was selected in consultation with the Flemish road authorities. At this intersection, the road authorities have recently (i.e. summer of 2013) installed a RLC. In this manner, it is possible to validate the driving simulator data with the real world data (i.e. data were recorded both before and after the installation of the RLC at this intersection). Moreover, this location is situated inside a built-up area, which is very interesting because most rear-end collisions appear to take place in urban areas (De Pauw et al., 2012; R. A. Retting et al., 1995). The road segment approaching the intersection has a speed limit of 50km/h (built-up area) with 2x1 lanes (cf. figure 1). The intersection is equipped with a 35m-long separate lane for the left turn traffic (cf. figure 2). Furthermore, an adjacent cycling path starts 50m before the intersection.
Road segment development To rebuild the selected location in the driving simulator environment, a procedure called geo-specific database modeling (Yan, Abdel-Aty, Radwan, Wang, & Chilakapati, 2008) was adopted. This procedure consists of replicating a real world driving environment in a simulated virtual environment and is to be differentiated from simulator research where often the driving scenarios are fictive. In order to reproduce the existing situation as realistic and detailed as possible, we made use of photographs, videos, detailed field measurements, AutoCAD drawings, and Google Street View. A picture of the real world environment and the simulated replica can be found in figures 1 and 2.
Scenario design The overall scenario is a systematic combination of the real life replicated section with a set of 2-4km long filler pieces, differing from the analysis sections with respect to design, speed limit, and surrounding environment and meant to provide some variation throughout the scenario.
Figure 4 gives an overview of the intersection and the approaching segment, including the placing of the RLC and RLCWS. The analysis zone has a length of 500m, whereby the stop line at the intersection is set at the relative distance of 0m (cf. figure 4). The traffic lights are placed 5m beyond the stop line (i.e. down the road). Participants have always been confronted with a leading vehicle (at 65m) and a following vehicle (at 25m) when approaching the intersection. These vehicles did not influence the stop/go decision of the participants, since the distance headway was sufficiently large and the leading vehicle always drove through the green phase. The signal light turned from green to yellow when participants were 2.5s removed from the stop line (i.e. time headway of 2.5s). In this way, each participant had an equal time interval to react to the yellow onset. The yellow time interval remained for 3.8s. This is in line with the yellow time interval standards from the literature (Bonneson et al., 2002; Federal Highway Administration, 2005; Institute of Transportation Engineers (ITE), 2009; McGee et al., 2012).
All participants are exposed to 3 conditions (i.e. passed the intersection 3 times):
Control condition: no RLC was installed
RLC condition: a RLC was installed 15m before the stop line
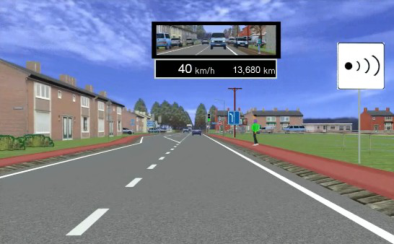
RLCWS condition: a RLC was installed 15m before the stop line and a RLCWS (cf. figure 3) was placed 50m before the stop line.
Procedure and design Participants were asked for their voluntary cooperation and requested to fill out a form with some personal data (e.g. gender, driving experience, date of birth, etc.). After a general introduction, drivers acquainted themselves with the driving simulator by handling various traffic situations (e.g. highway, curves, traffic lights, urban and rural areas) during two practice trips of 4km each. Subsequently, the eye tracking equipment was calibrated. Then participants completed the experimental trip of 14.8km, resulting in a randomized within (3 conditions: control, RLC, RLCWS) subjects design. Subjects were asked to drive as they normally would do with their own car and apply the traffic laws as they would do (or would not do) in reality. A GPS voice instructed them during the trip.
Figure 1. Real world vs. simulator image at approaching road segment.Figure 2. Real world vs. simulator image at intersection.Figure 3. Red light camera warning sign (RLCWS).Figure 4. Scenario overview.
Figure available in the original PDF paper.
Data collection and analysis Dependent measures
Driving performance measures for both longitudinal and lateral control were recorded by the simulator. For this study, measures for longitudinal control are particularly of interest. The speed [m/s] of the participants at the yellow onset is used in the Monte Carlo Simulation below. Furthermore, mean acceleration/deceleration (acc/dec) [m/s²] is also an important measure regarding the chance of rear-end collisions. Another dependent measure (i.e. distance headway) needed for the Monte Carlo Simulation was gathered at the real world location by means of observations.
Concerning the eye tracking data, the percentage of participants that fixated on the regions of interest (ROI) and the mean fixation duration are analyzed when the participants approached the intersections. Here we make a distinction between the participants who stopped for the yellow light (i.e. ‘stop’) and drove through (i.e. ‘go’).
Data analysis The risk of rear-end collisions for each condition is estimated by means of a Monte Carlo Simulation using a normal distribution. These risk values are not expressed as absolute values, but as relative values (i.e. to compare the 3 conditions). The distance headway data observed at the real world location (i.e. field observations) are gathered by means of a (semi-automatic) conflict observation technique during 24 hours. For practical reasons, the data could only be collected for the control (n = 18) and RLC (n = 9) conditions. Therefore, the data from the RLC condition is also used for the RLCWS condition. Only situations where 2 vehicles (i.e. a following and a leading vehicle) were approaching the intersection while the traffic lights turned from green to yellow and the leading vehicle stopped were taken into account. To calculate the risk of rear-end collisions for each condition, the following parameters are used:
Following vehicle o V0: mean speed at the yellow onset (based on simulator data). Since the participants were the leading vehicle and we have no speed data for the following vehicle, the speed of the following vehicle will be equal to the speed of the leading vehicle.
o a: maximum deceleration value (based on simulator data), assuming that the driver in the following vehicle can adjust his/her behavior based on the leading vehicle and even can make an emergency stop when necessary. Since the highest overall value is selected, the maximum deceleration rate will be constant for all conditions.
o treaction: reaction time (based on the literature; (Caird, Chisholm, Edwards, & Creaser, 2007; Liu, Bonsall, & Young, 2003; Yan et al., 2008)), with respect to the decision of the leading vehicle to stop.
Distance headway: distance between the end of the leading vehicle and the front of the following vehicle (observed at real world location).
Leading vehicle o V0: mean speed at the yellow onset (based on simulator data).
o a: mean deceleration value (based on simulator data).
For the leading vehicle no reaction time was included in the Monte Carlo Simulation because the reaction time of the following vehicle was selected with respect to the stopping maneuver of the leading vehicle. The Monte Carlo Simulation was performed using Microsoft Excel with 100,000 iterations for each condition. The stopping distance is calculated for both the following and leading vehicle. A rear-end collision will occur when the sum of the stopping distance of the following vehicle and the distance headway is larger than the stopping distance of the leading vehicle.
For the looking behavior, several regions of interest (ROI) are selected: leading vehicle, traffic light, rear view mirror, speedometer (on screen, below the rear view mirror), RLC, and RLCWS. The mean fixation duration for these ROI are analyzed using the EyeWorks software package. Fixation durations of less than 0.05s are not taken into account. Subsequently, paired samples t-tests on a 5% confidence level were conducted using SPSS.
RESULTS
Decision behavior
First of all, we give an overview of the decision behavior (i.e. ‘stop’ or ‘go’) for the 3 conditions. In the control condition 7 (i.e. 11%) participants stopped for the yellow sign. For the RLC and RLCWS conditions the number of participants who did not drive through was 8 (i.e. 13%) and 19 (i.e. 30%), respectively. This means that most drivers drove through the yellow phase in the control condition (n = 56), followed by the conditions RLC (n = 55) and RLCWS (n = 44).
Risk of rear-end collisions
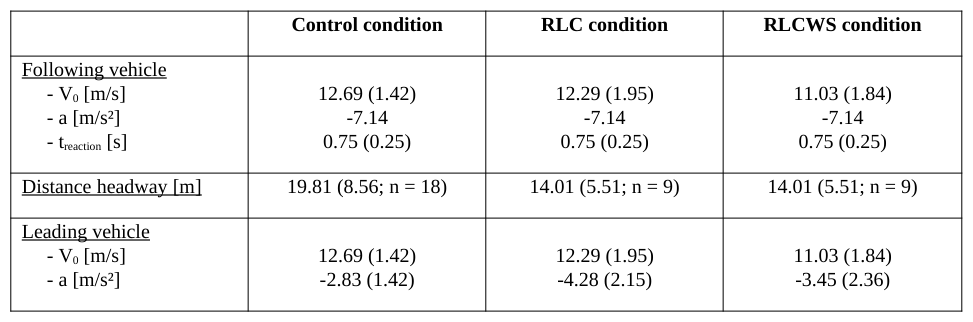
Table 1 presents the parameter values (including SD) that were used for the Monte Carlo Simulation. The stopping distances for both the following and the leading vehicle were calculated. A rear-end collision occurred when the sum of the stopping distance of the following vehicle plus the distance headway was larger than the stopping distance of the leading vehicle. Given the fact that there were 100,000 iterations for each condition, the number of rear-end collisions that took place was 1,973; 12,646; and 7,984 for the control, RLC, and RLCWS condition respectively. This means that the relative risk for a rear-end collisions equals:
1.97% for the control condition;
12.65% for the RLC condition;
7.98% for the RLCWS condition.
Table 1: Parameter values (mean and SD) used for the Monte Carlo Simulation Control condition RLC condition RLCWS condition
Looking behavior Number of participants that fixated on ROI
Figure 5a shows that the number of participants that fixated on the ROI is approximately equal for the 3 conditions when participants drove through (i.e. ‘go’). However, in the RLCWS condition participants fixated more on the RLC compared to the RLC condition. Remarkable is that 50% of the participants who did not stop at the intersection fixated on the RLCWS and that approximately 70% fixated on the traffic light (in each condition).
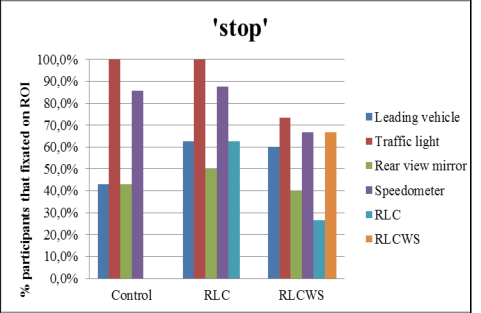
Figure 5b depicts the looking behavior of the participants who stopped. Here, 100% of the participants fixated on the traffic light in the control and RLC condition, compared to 72% in the RLCWS condition. Furthermore, more participants fixated on the RLC in the RLC condition than in the RLCWS condition. In the RLCWS condition almost 70% of the participants fixated on the warning sign.
(a) (b)
Figure 5. Number of participants that fixated on ROI (a) ‘go’ and (b) ‘stop’.
Mean fixation duration The mean fixation duration for the participants who drove through and stopped are visualized in figures 6a and 6b, respectively. For the ‘go’ situation, no significant differences for the ROI between the conditions exist. The mean fixation duration for the RLC tends to differ between the RLC and RLCWS condition, but this difference is not significant (t (13) = 1.47; p = 0.167).
For the participants who stopped (cf. figure 6b) there seems to be a difference in mean fixation time for the traffic light, rear view mirror and speedometer between the control and RLC condition. Although, these differences are not statistically significant at a 5% confidence level. Between the conditions RLC and RLCWS also no statistically significant differences appear at a 5% confidence level. However, a significant difference in mean fixation time for the RLC exists between the RLC and RLCWS condition at a 10% confidence level (t (4) = 2.46; p = 0.070).
( b)
Figure 6. Mean fixation duration for (a) ‘go’ and (b) ‘stop’.
Figure available in the original PDF paper.
DISCUSSION
In this study, a real world intersection was selected and replicated in the driving simulator. The participants passed this intersection 3 times: control condition (i.e. no RLC), RLC condition, and RLCWS condition. The results concerning the decision behavior (i.e. ‘stop’ or ‘go’), the risk of rear-end collisions, and the looking behavior are discussed below.
Decision behavior Results showed that 11%, 13%, and 30% of the participants decelerated and stopped at the intersection in the control, RLC, and RLCWS condition respectively. This means that slightly more participants stopped when a RLC was installed. When a warning sign (i.e. RLCWS) was placed at the roadside, it led to a further increase of the stopping maneuvers. These findings are in line with several studies (Høye, 2013; McCartt & Hu, 2014; Pulugurtha & Otturu, 2014; R. A. Retting, Williams, et al., 1999; Zaal, 1994) which found a significant decrease in the red light running behavior at intersections.
Risk of rear-end collisions The relative risk of a rear-end collision is equal to 1.97%, 12.65%, and 7.89% in the control, RLC, and RLCWS condition respectively. This indicates that the presence of a RLC increases the risk of a rear-end collision. Several international studies support this increase (up to 44%) in rear-end collisions (De Pauw et al., 2012; Erke, 2009; Høye, 2013; Persaud et al., 2005; Pulugurtha & Otturu, 2014; Shin & Washington, 2007; Vanlaar et al., 2014). However, when a warning sign is placed in the approaching segment towards the intersection, this risk decreases but is still higher compared to situations where no RLC is present (i.e. control condition). Other studies (Høye, 2013; Ni & Li, 2013; Zaal, 1994) also found a lower risk of rear-end collisions when a warning sign was installed before (i.e. upstream) RLCs. In general, such RLCWS decreases the unfavorable (i.e. sharp braking maneuvers) effect of RLCs.
Concerning the parameter values used for the Monte Carlo Simulation, there are some interesting conclusions. Firstly, the mean driving speed at the yellow onset is the highest in the control condition (12.69m/s) and the lowest in the RLCWS condition (11.03m/s). Both values lie below the speed limit of 50km/h (i.e. 13.89m/s). The warning sign is probably responsible for this difference in speed, but no evidence is found in the literature. Secondly, the maximum deceleration rate from the simulator study is equal to -7.14m/s². Yan et al. (2008) observed a slightly higher value of -8.21m/s². Subsequently, mean deceleration values of -2.83m/s², -4.28m/s², and -3.45m/s² were found for the control, RLC, and RLCWS condition respectively. We can conclude that the deceleration value is the highest for the RLC condition, but decreases to a more ‘normal’ value in the RLCWS condition. A normal, comfortable braking deceleration value that is recommended is -3m/s² (Koppa, 2003; Liu et al., 2003; McGee et al., 2012; Yang, Han, & Cherry, 2013). Høye (2013) also found a smaller deceleration value when a warning sign was installed. Finally, the distance headway (observed at the real world location) for the control (19.81m) and RLC (14.01m) condition differs slightly. However, these values are based on a very small dataset and are both lower than the average distance headway (25-35m) found in the literature (Liu et al., 2003; Yan et al., 2008).
Looking behavior To our knowledge, no (simulator) study investigated the looking behavior of drivers nearby intersections equipped with RLCs and RLCWSs to date. Concerning the looking behavior no statistically significant differences were found between the 3 conditions. However, some interesting conclusions regarding the looking behavior can be listed up:
‘Only’ 70% of the drivers who did not stop fixated on the traffic light. However, this does not mean that the other 30% of the drivers did not notice the traffic light (cfr. peripheral vision; (Dewar & Olson, 2007)).
A higher percentage of the participants who stopped observed the RLC (62% vs. 28%) and the RLCWS (68% vs. 51%) compared to the participants who did not stop.
In general, a higher percentage of the participants who stopped fixated on their rear view mirror and speedometer than the participants who did not stop.
Mean fixation duration for both rear view mirror and speedometer was longer in the RLCWS condition compared to the RLC condition. On the other hand, mean fixation duration for the RLC was longer in the
RLC condition than in the RLCWS condition. This can possibly be explained by the fact that participants who have already noticed the RLCWS, do not look at the RLC anymore.
Mean fixation duration for both rear view mirror and speedometer was longer for the participants who stopped in comparison with the participants who did not stop.
Participants who stopped had a longer mean fixation duration for the RLCWS compared to drivers who did not stop (0.38s vs. 0.23s).
LIMITATIONS AND FUTURE RESEARCH The issue of external validity often is raised when discussing the results of research employing driving simulators. However, the geo-specific database modeling technique increases the reliability and validation of the experiment and the results (Yan et al., 2008). In addition, the simulator used in this study is equipped with a 180° field of view, which satisfies the prescribed minimum of 120° field of view for the correct estimation of longitudinal parameters (Kemeny & Panerai, 2003). Besides that, it would be possible to fill out the parameters for the following vehicle more accurately if the data observed at the real world location should be more elaborated.
Future research about the use of RLCs can be done concerning the spillover effects and the speeding behavior during green (i.e. speed on green). This study is mainly focused on the braking maneuvers at intersections. Furthermore, the impact of a varying distance between the RLC and the RLCWS could be investigated. The distance between the RLC and the RLCWS was held constant within this study (i.e. 35m). Finally, it should be interesting to carry out more research on the looking behavior at intersections equipped with RLCs and RLCWSs.
CONCLUSION AND POLICY RECOMMENDATIONS Based on the Monte Carlo Simulation, the relative risk of rear-end collisions increases when a RLC is installed (12.65% compared to 1.97%). However, this risk decreases (7.89%) when a warning sign announcing the presence of a RLC is placed upstream. In conclusion, installing a RLCWS means that less drivers will look to the RLC, but more drivers will stop (safely) for the yellow light. Although RLCs lead to an increase in rear-end crashes, they can be useful to prevent red light running. This means that road administrations must consider the installation of a RLC very carefully. When RLCs are needed at certain intersections (e.g. to prevent red light running), road administrations should also deliberate about the potential of a RLCWS in order to reduce the risk of rear-end collisions.
REFERENCES
Bonneson, J., Middleton, D., Zimmerman, K., Charara, H., & Abbas, M. (2002). Intelligent Detection-Control System for Rural Signalized Intersections (No. FHWA/TX-03/4022-2). FHWA. Caird, J. K., Chisholm, S. L., Edwards, C. J., & Creaser, J. I. (2007). The effect of yellow light onset time on older and younger
drivers’ perception response time (PRT) and intersection behavior. Transportation Research Part F: Traffic Psychology and Behaviour, 10(5), 383–396. doi:10.1016/j.trf.2007.03.002 De Pauw, E., Daniëls, S., Brijs, T., Hermans, E., & Wets, G. (2012). Effectevaluatie van snelheids- en roodlichtcamera’s op gewestwegen in Vlaanderen (No. RA-2012-001). Diepenbeek, Belgium: Steunpunt Verkeersveiligheid. Dewar, R., & Olson, P. (2007). Human factors in traffic safety. Tucson: Lawyers & Judges Publishing Company, Inc. Erke, A. (2009). Red light for red-light cameras?: A meta-analysis of the effects of red-light cameras on crashes. Accident
Analysis & Prevention, 41(5), 897–905. doi:10.1016/j.aap.2008.08.011 Federal Highway Administration. (2005). Traffic Control Systems Handbook. Washington, D.C.: FHWA. Høye, A. (2013). Still red light for red light cameras? An update. Accident Analysis & Prevention, 55(0), 77–89.
doi:10.1016/j.aap.2013.02.017 Institute of Transportation Engineers (ITE). (2009). Traffic Engineering Handbook (6th ed.). Washington, D.C.: ITE. Kemeny, A., & Panerai, F. (2003). Evaluating perception in driving simulation experiments. Trends in Cognitive Sciences, 7(1), 31–37. doi:10.1016/S1364-6613(02)00011-6 Human Aspects of Transportation II (2021)
Kloeden, C. N., Ponte, G., & McLean, A. J. (2001). Travelling speed and the risk of crash involvement on rural roads (No. CR 204). South Australia: Adelaide University - Road Accident Research Unit. Koppa, R. J. (2003). “Human Factors” Chapter 3 of: Gartner, N.H., Messer, C.J. and Rathi, A.K. (Eds) Traffic Flow Theory.
Washington, D.C.: Transportation Research Board Monograph, National Research Council. Liu, R., Bonsall, P., & Young, W. (2003). Modelling safety related driving behaviour: impact of parameters values. Association for European Transport. Martinez, K. L. H., & Porter, B. E. (2006). Characterizing red light runners following implementation of a photo enforcement
program. Accident Analysis & Prevention, 38(5), 862–870. doi:10.1016/j.aap.2006.02.011 McCartt, A. T., & Hu, W. (2014). Effects of red light camera enforcement on red light violations in Arlington County, Virginia.
Journal of Safety Research, 48(0), 57–62. doi:10.1016/j.jsr.2013.12.001 McGee, H., Moriarty, K., Eccles, K., Liu, M., Gates, T., & Retting, R. (2012). Guidelines for Timing Yellow and All-Red Intervals at Signalized Intersections (No. 731). Washington, D.C.: Transportation Research Board. Ni, Y., & Li, K. (2013). Estimating Rear-end Accident Probabilities at Signalized Intersections: A Comparison Study of
Intersections With and Without Green Signal Countdown Devices (Accepted Manuscript). Traffic Injury Prevention. doi:10.1080/15389588.2013.845752 Persaud, B., Council, F., Lyon, C., Eccles, K., & Griffith, M. (2005). Multijurisdictional Safety Evaluation of Red Light Cameras. Transportation Research Record: Journal of the Transportation Research Board, 1922, 29–37. doi:10.3141/1922- 05 Porter, B. E., Johnson, K. L., & Bland, J. F. (2013). Turning off the cameras: Red light running characteristics and rates after
photo enforcement legislation expired. Accident Analysis & Prevention, 50(0), 1104–1111. doi:10.1016/j.aap.2012.08.017 Pulugurtha, S. S., & Otturu, R. (2014). Effectiveness of red light running camera enforcement program in reducing crashes: Evaluation using “before the installation”, “after the installation”, and “after the termination” data. Accident Analysis & Prevention, 64(0), 9–17. doi:10.1016/j.aap.2013.10.035 Quiroga, C., Kraus, E., van Schalkwyk, I., & Bonneson, J. (2003). Red light running: a policy review (No. CTS-02/150206-1).
Texas: Texas Transportation Institute. Retting, R. A., Ferguson, S. A., & Farmer, C. M. (2008). Reducing red light running through longer yellow signal timing and red light camera enforcement: Results of a field investigation. Accident Analysis & Prevention, 40(1), 327–333. doi:10.1016/j.aap.2007.06.011 Retting, R. A., Ulmer, R. G., & Williams, A. F. (1999). Prevalence and characteristics of red light running crashes in the United
States. Accident Analysis & Prevention, 31(6), 687–694. doi:10.1016/S0001-4575(99)00029-9 Retting, R. A., Williams, A. F., Farmer, C. M., & Feldman, A. F. (1999). Evaluation of red light camera enforcement in Oxnard, California. Accident Analysis & Prevention, 31(3), 169–174. doi:10.1016/S0001-4575(98)00059-1 Retting, R. A., Williams, A. F., Preusser, D. F., & Weinstein, H. B. (1995). Classifying urban crashes for countermeasure
development. Accident Analysis & Prevention, 27(3), 283–294. doi:10.1016/0001-4575(94)00068-W Retting, R., & Greene, M. (1997). Influence of Traffic Signal Timing on Red-Light Running and Potential Vehicle Conflicts at Urban Intersections. Transportation Research Record: Journal of the Transportation Research Board, 1595, 1–7. doi:10.3141/1595-01 Shin, K., & Washington, S. (2007). The impact of red light cameras on safety in Arizona. Accident Analysis & Prevention, 39(6),
1212–1221. doi:10.1016/j.aap.2007.03.010 SWOV. (2011). Fact sheet - Effects of police enforcement of safety devices, of moped helmet use, and of red light running.
Leidschendam: SWOV. Vanlaar, W., Robertson, R., & Marcoux, K. (2014). An evaluation of Winnipeg’s photo enforcement safety program: Results of time series analyses and an intersection camera experiment. Accident Analysis & Prevention, 62(0), 238–247. doi:10.1016/j.aap.2013.09.023 Wilson, A. (2006). Handboek verkeerslichtenregelingen. Ede: CROW. Yan, X., Abdel-Aty, M., Radwan, E., Wang, X., & Chilakapati, P. (2008). Validating a driving simulator using surrogate safety
measures. Accident Analysis & Prevention, 40(1), 274–288. doi:10.1016/j.aap.2007.06.007 Yan, X., Radwan, E., Guo, D., & Richards, S. (2009). Impact of “Signal Ahead” pavement marking on driver behavior at signalized intersections. Transportation Research Part F: Traffic Psychology and Behaviour, 12(1), 50–67. doi:10.1016/j.trf.2008.07.002 Yang, Q., Han, L. D., & Cherry, C. R. (2013). Some measures for sustaining red-light camera programs and their negative
impacts. Transport Policy, 29(0), 192–198. doi:10.1016/j.tranpol.2013.06.006 Zaal, D. (1994). Traffic Law Enforcement: A review of the literature. Monash University.
LISTED IN THE AHFE DIGITAL BOOKSTORE CATALOGUE
Explore the complete digital volume
Advances in Human Aspects of Transportation: Part II
Read this individual research paper free through the original publisher, or explore the full digital proceedings book.
ISBN 978-1-4951-2098-5
Explore this ISBN in the AHFE Bookstore ↗Listed in the July 2026 bookstore catalogue; search by ISBN to confirm current availability · Digital book purchase optional