Virginia P. Sisiopiku, Md Mozahidul Islam, Shannon Wittig, Sharon C. Welburn, Despina Stavrinos (2021). Perceived and Real Impacts of Digital Advertising Billboards on Driving Performance. In: Advances in Human Aspects of Transportation: Part II. AHFE Open Access, vol. 16. https://doi.org/10.54941/ahfe100703
This paper explores perceived and real impacts of digital advertising billboards on driving performance of individuals from representative samples across the lifespan. Perceived impacts were assessed through an online driver questionnaire that documented perceptions and attitudes of Alabama motorists as they relate to roadside billboards. The questionnaire solicited demographic information, inputs on driving patterns and attitudes, drivers’ experiences with advertising billboards, and perceptions regarding presence and type of advertising billboard and traffic safety. Actual impacts of digital advertising billboards on driving performance were examined using a data-informed, empirical driving simulator study. Driving performance variables of interest were electronically coded by the simulator (i.e., lane deviations, speed exceedances, and crashes and statistical analyses were performed to test whether digital billboards presented driving performance decrements. The paper provides detailed description of the study approach and major findings and discusses conclusions and recommendations. The study sheds light on the impact of roadside advertisements on driving performance across the lifespan which, in turn, provides useful insights on the potential links between digital outdoor advertising and traffic safety.
Roadside advertising billboards are used for advertisement of various products and services and are meant to attract drivers’ attention to the message or information conveyed by the billboards. According to the Outdoor Advertising Association of America (OAAA), there were over 365,000 unique billboard faces in the United States in 2013 (Outdoor Advertising Association of America [OAAA], 2013). Roadside advertising billboards can be either static or digital. Static billboards show the same message for an extended period of time (typically days). They are the traditional type of outdoor advertising and the most commonly used type of advertising billboards in the United States. The digital billboards (DBBs) were introduced in the recent years and utilize light-emitting diode (LED) technology to show multiple messages one after another that are updated using computer input. Because DBBs flash images every four to ten seconds (Copeland, 2010), a single board can advertise to far more clients than a traditional board, making them an attractive advertisement option. Thus, despite the fact that DBBs are initially more expensive to build compared to their static counterparts, over time they prove to be cost-effective. While static billboards are still dominant, digital billboards are a fast growing sector of the outdoor advertising market (OAAA, 2013).
The increased number and sophistication of DBBs raises questions about their potential impact on traffic safety. As an advertising medium, DBBs purposely encouraging drivers to shift their attention away from the driving task. Moreover, DBBs brightness may be especially problematic at night and may affect the driver’s ability to observe changes in the surrounding environment such as brake lights or signal changes. Also, frequently changing images may compel more glances, and sequential messages may hold drivers’ gazes longer until the entire message is read. Lastly, targeted messages that promote interactivity with the driver are particularly troublesome as they are hypothesized to be distracting to the driver (Sisiopiku et al, 2013).
Several studies have been performed worldwide to document the relationship between roadside advertising billboards, driver distraction, and traffic safety. These include a) crash studies analyzing historical crash records, b) laboratory studies using driving simulators, and c) naturalistic studies observing driver behaviors on-road using instrumented vehicles. A comprehensive synthesis of the literature is available at Sisiopiku et al. (2013) while Wallace (2003), Coetzee (2003), Molino et al. (2009), and Wachtel (2009, and 2011) provide useful insights on the subject of outdoor advertising and driver distraction through literature reviews and meta-analyses.
Several earlier studies provide some evidence for a correlation between advertising billboards and increased driver distraction. However, local conditions, experimental settings, and other factors may play a role in the impact of driver distraction due to advertising billboards on traffic safety. Overall, the outcomes of earlier research studies have resulted in somewhat contradictory conclusions, indicating a need for further research. Furthermore, earlier studies have looked at the distractive effects of billboards in the general population; however, little research has been done to examine how these distractive effects differ across the lifespan, namely young drivers, middle aged drivers, and older adults (65 years and older).
To bridge existing knowledge gaps, this study investigated the potential relationship between DBBs and traffic safety based on perceived and real impacts of DBBs on individual drivers across the lifespan. In order to determine the perceived impacts of roadside advertisement, an online driver questionnaire survey was conducted and used to document perceptions and attitudes of Alabama motorists as they relate to roadside billboards. The real impacts of DBBs on driver performance where obtained from the driving simulator experimental study. This study focused on the effect of external distractions from billboards on driving performance.
SURVEY OF ROAD USERS
Methods
One straightforward approach toward understanding transportation users’ choices and behaviors is through questionnaires. In the present research, an online questionnaire instrument was developed and used in 2013 to gather and analyze data from Alabama road user’s perceptions and attitudes related to roadside advertising billboards. The questionnaire included a total of 22 questions that assessed several variables of interest including demographic information (e.g., age, ethnicity, and gender), exposure (driving patterns and experience, frequency of billboard encounters), driver’s behaviors, attitudes, and perceptions toward billboards with respect to safety and efficiency, and respondents’ stated preferences regarding placement, frequency and regulation of roadway advertising billboard. To ensure random sampling, a company specialized in web based surveys was hired to recruit a diverse group of survey participants. In order to be eligible to participate in the survey, subjects had to possess a valid driver’s license and reside in Alabama.
Analysis In aggregate, 295 respondents from Alabama participated in this survey. Incomplete questionnaire responses were omitted in order to maintain consistency for analysis. Eventually, responses from 231 participants across the lifespan were used in the analysis. The questionnaire extracted information related to driver demographics, driving experience level, perception towards billboards, in general, and digital billboards, in particular, attitudes related to use of information billboards, and perceptions on traffic safety with respect to billboards and digital billboards.
Participants’ questionnaire responses were collected and then processed using ‘Microsoft Excel’ to make usable for analysis.
Results
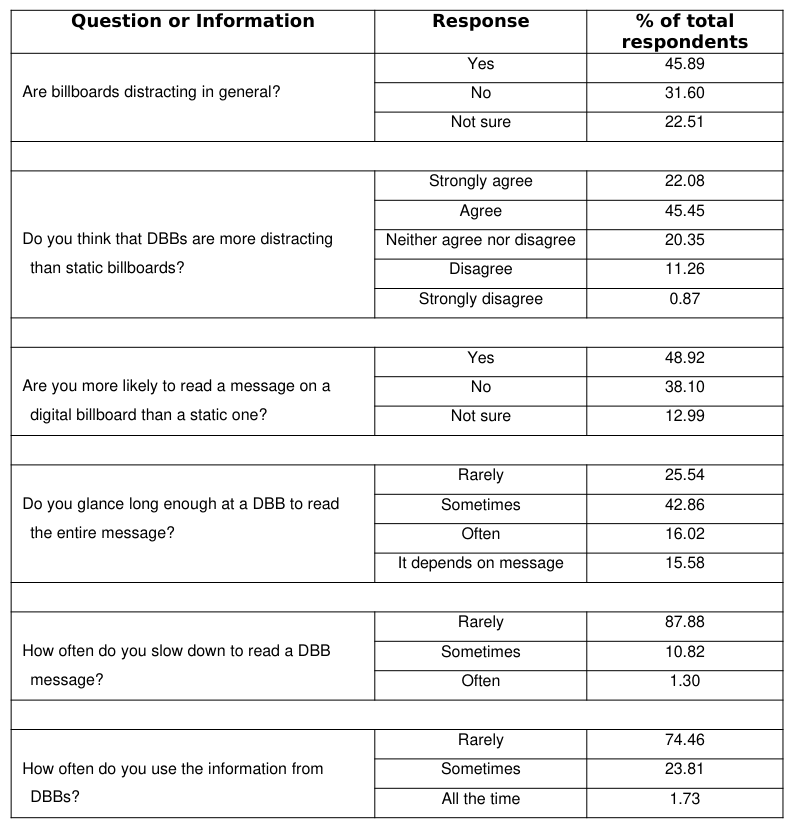
Out of 231 questionnaire respondents, 133 (57.58%) were male and 98 (42.32%) were female drivers. Aggregate responses from the questionnaire are summarized in Table 1.The findings reveal that 45.89% of respondents find billboards distracting in general, and an overwhelming 67.53% perceive DBBs as more distracting than static billboards. Moreover, the majority responded that they are more likely to read a message on a DBB rather than a static billboard. The majority (58.88%) also admitted that they stare at a DBB long enough to read the entire message but they rarely slow down (87.88%) when doing so. Interestingly, while responders admit that the messages posted on DBBs capture their attention, three fourths of them (74.46%) state that they rarely use the information.
Table 1: Aggregate response from online questionnaire survey Question or Information Response % of total respondents
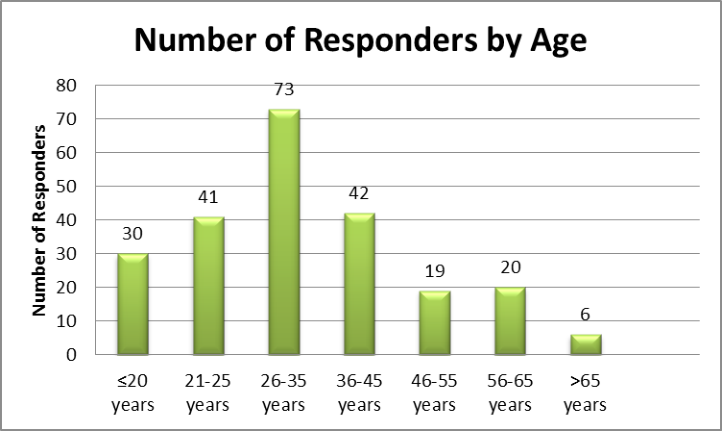
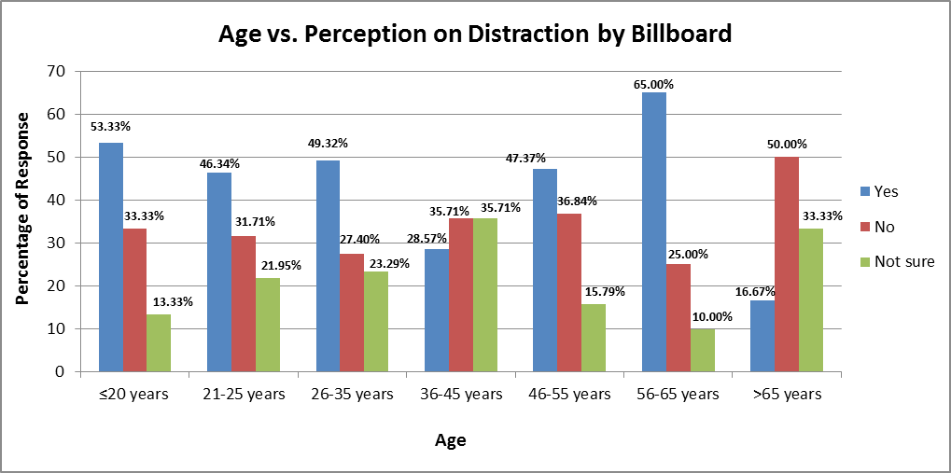
For further analysis, the drivers were categorized into 7 age classes as summarized in Figure 1. Approximately 13% of responders were under 20 years of age and 11.26% were older than 55. The responses were then stratified according to the age the participants. When asked about their perception as it related to billboard distraction, 106 respondents (45.89%) reported that billboards cause ‘distraction.’ The respondents in the 56-65 year old bracket had maximum rate of agreement on the issue of distraction from presence of billboard (65%). The younger driver population, i.e., drivers of ≤20 years and 21-25 years of age also had a high percentage on the agreement that the billboards cause distraction (53.33% and 46.34%, respectively). The findings are summarized in Figure 2.
Figure 1: Number of respondents with age classFigure 2: Age vs. perception on distraction by billboard
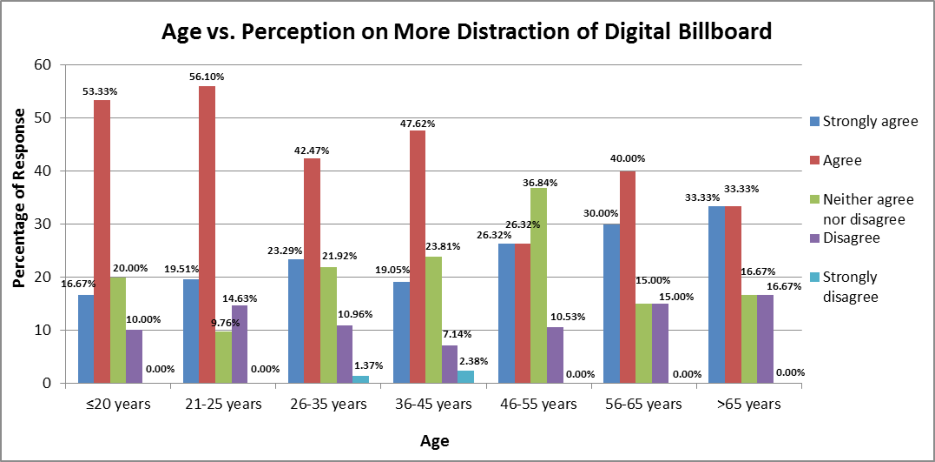
When asked if DBBs are more distracting than static billboards, nearly half of the respondents (45.45%) agreed on the greater distracting power of the digital billboards compared to static billboards. Also, as shown in Figure 3, approximately 56%of those 21-25 years of age agreed that digital billboards are more distracting. The percentage is higher than any measures from other age classes. Their immediate juniors (≤20 years) were not far behind (53.33%) to accept the notion of potentially more distracting power of digital billboards. So, it can be inferred that, the rate of acceptance of potential distraction by digital billboards in this study was higher among young drivers.
Figure 3: Age vs. perception on more distraction of digital billboard
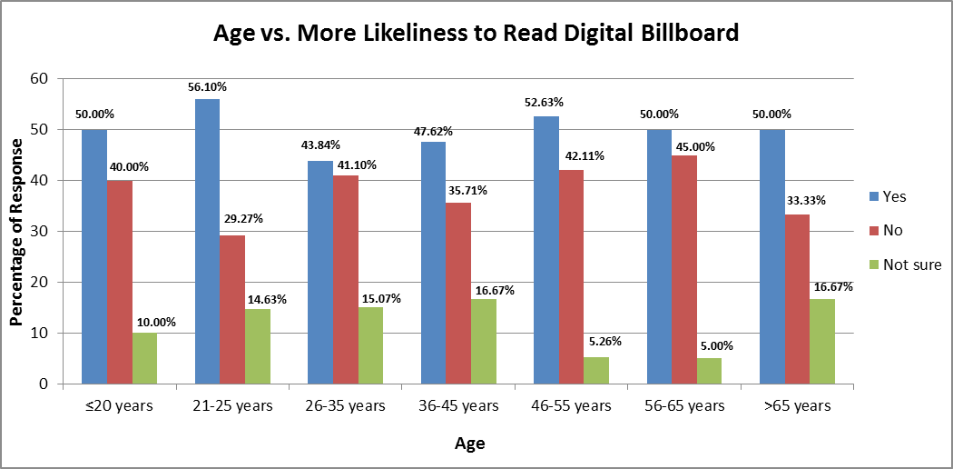
Almost half of the respondents also mentioned that they are more likely to read messages from digital billboards (48.92%). This is a clear intention of the road users to be tempted by messages from digital billboards. Taking gender into consideration, the tendency was greater among male drivers (52.63%) than their female counterparts (43.88%). Interestingly, as depicted in Figure 4, this response was fairly consistent across all age groups, including the elderly.
Figure 4: Age vs. more likeliness to read digital billboard
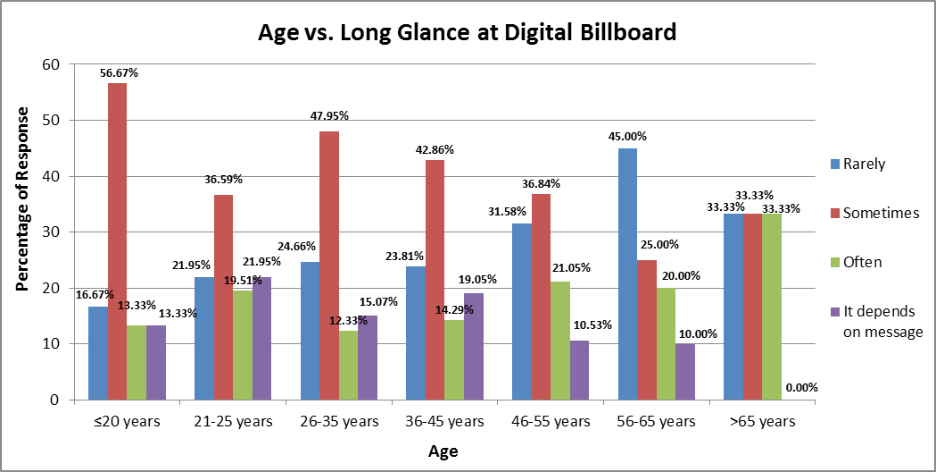
The analysis also revealed that over 42% of the road users sometimes glance at the digital billboard for significantly long time. Although the exact time was not described, the term ‘long’ may be akin to several seconds. This rate was highest among the participants when asked about long glance, meaning that the digital billboards can make people to look at them for a significantly ‘long’ time. This scenario (long glance at digital billboard) was further broken down by age class and the results are shown in Figure 5. More than half (56.67%) of the young drivers (≤20 years of age) ‘sometimes’ looked at the digital billboard for a long time, which is quite natural because the respondents of this age might have a curiosity to the appearance and messages of digital billboards. Though they sometimes glance for a long time, a small percent of drivers across the lifespan reported doing it ‘often’.
Figure 5: Age vs. long glance at digital billboard
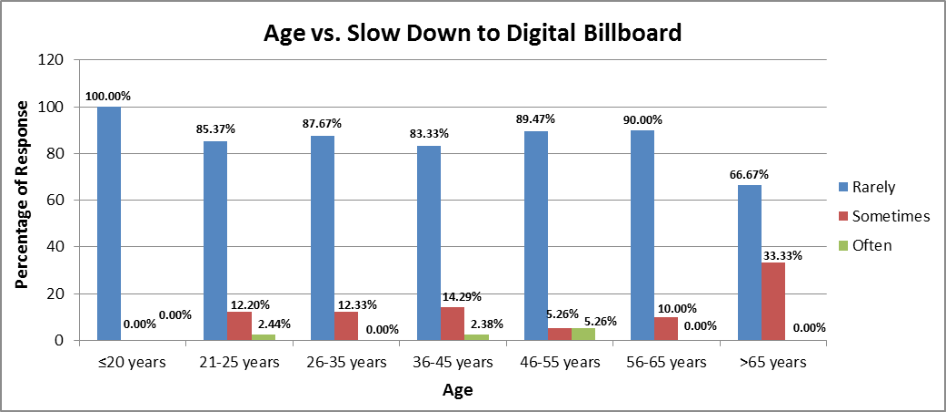
It can be deduced from the analysis of the responses that the overwhelming majority of the questionnaire participants (87.88%) had a rare tendency to slow down near digital billboards. Very small percentage of the drivers ‘sometimes’ reduced their speed (10.82%). Figure 6 shows the result of ‘slow down at digital billboard’ scenario based on age. The youngest driver group (≤20 years) rarely reduced their vehicle speed disregarding the presence of digital billboard.
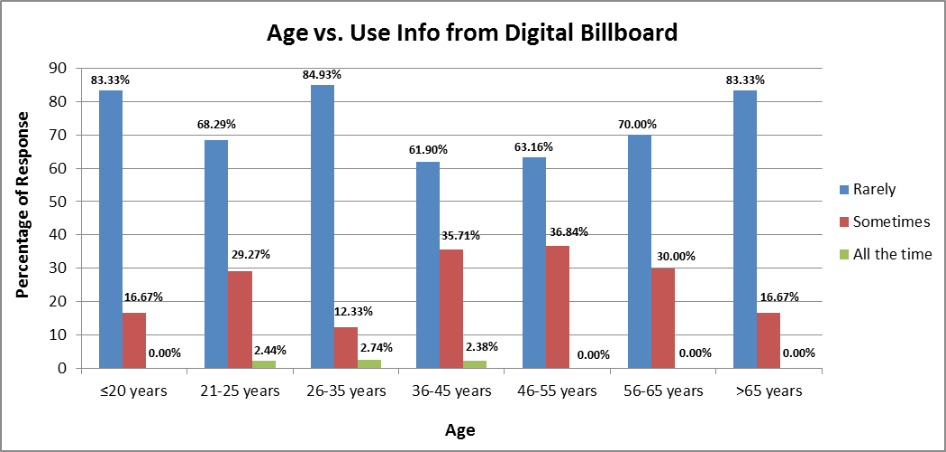
Interestingly, most of the participants stated that they rarely used information from digital billboards, and just over one-fifth of them (23.81%) used the information sometimes. The rate was highest (36.84%) for participants between 46 and 55 years of age. As can be seen in Figure 7, the youngest population group and the older population (>65 years) showed almost no intention to use digital billboard’s information.
Survey participants were asked also their opinion regarding the need for stricter regulation of billboards. Nearly 60% of responders suggested that there should be restrictions on all billboard locations for the purpose of traffic safety and agreed on the need for better regulation of the size and number of DBBs.
Figure 6: Age vs. slow down to digital billboardFigure 7: Age vs. use of information from digital billboard
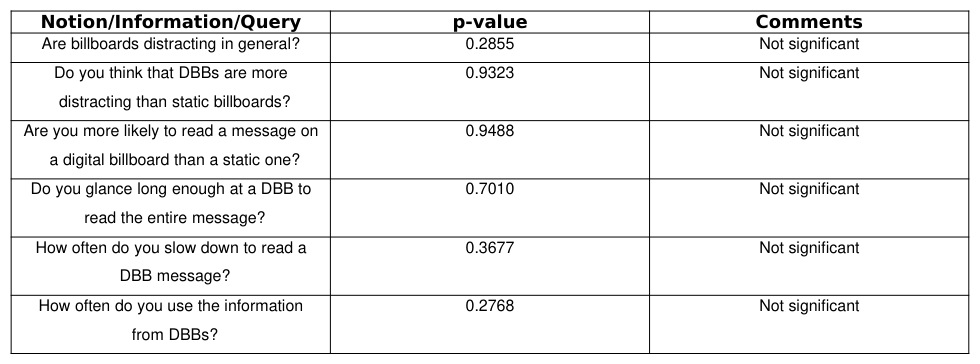
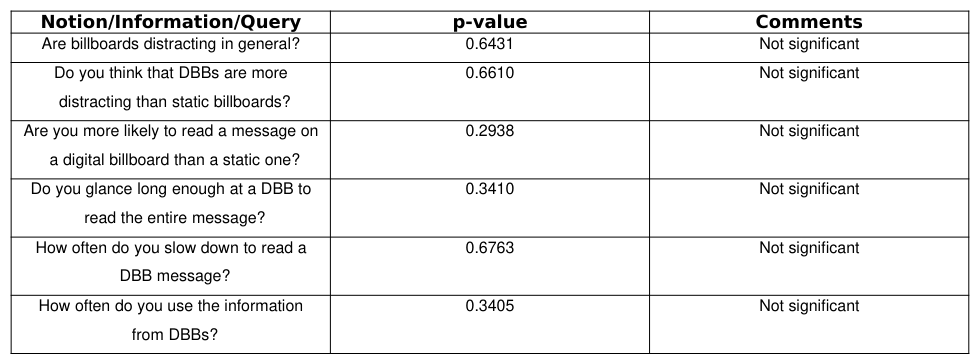
Apart from the general analysis of the responses between genders and age groups, chi-square test has been performed across age groups and gender separately. The observed values for the chi-square test have been found from the survey itself and the expected values have been determined. The result of this test has been presented in Tables 2 and 3.
The p-values from Table 2 suggest that there is no significant difference among responses across different age groups of drivers when asked for their perception and/or actions. From Table 3 it can be implied that, there is no significant differences between the responses of male and female drivers when asked for their perception and/or actions.
Table 2: Chi-square test result for age groups Notion/Information/Query p-value Comments Are billboards distracting in general? 0.2855 Not significantTable 3: Chi-square test result for male and female Notion/Information/Query p-value Comments Are billboards distracting in general? 0.6431 Not significant
Discussion
The analysis of the driver questionnaire has produced some interesting findings regarding the perceptions and attitudes of Alabamians with respect to DBBs. Younger drivers (≤20 years and 21-25 years) have a significant agreement rate on the distraction caused by the billboards in general. They also provided similar opinions when asked if digital billboards are more distracting than static billboards. So, this younger driver group actually perceived the distraction caused by billboards and also the higher distraction level when the billboards are digitized. It has also been revealed that young drivers usually have a long glance at digital billboards but very rarely slow down. This behavior might be a matter of concern as it could lead to potential risk for traffic crash occurrence.
Another interesting finding is that the older population group (>65 years) was more likely to use information from digital billboards but barely used the information conveyed by the billboards. In fact, the effectiveness of billboards, in general, and DBBs in particular to convey a message to the drivers is found to be questionable since the vast majority of respondents confirmed that they rarely use information from outdoor advertising billboards.
The analysis of aggregate responses of the drivers showed that almost half of the participants agreed that billboards distract drivers while 22.51% ‘were not sure’. A similar percentage of drivers perceived that the digital billboards are more distracting than their static counterparts. The online survey also suggests that more than 40 percent of the drivers looked at the digital billboards for a sufficiently long time, but most of the drivers barely slowed down. This behavior is a matter of concern as the combination of speed and inattention is found to increase the risk for a crash. Last but not least, survey responders emphasized the need for stricter regulation of DBBs and restriction of size and frequency of placement for the benefit of traffic safety.
At the end, chi-square test has been performed across age groups and genders discretely. There was no significant difference in the responses among the drivers groups. No significant change was also found between the responses of male and female drivers when asked about their perception or action while driving.
DRIVING SIMULATOR STUDY
Method
The current study aimed to evaluate the distractive effects of roadside billboards through the use of a driving simulator, providing a safe environment for imposing driver distractions. Participants were recruited using advertisements on social networking websites, flyers, and letters and were asked to drive through a simulated scenario embedded with a variety of billboards (static and digital).Sixty-six participants were recruited and divided into three groups: 16–19 years old for teens (n = 20), 35–55 years old for middle adults (n = 21), and 65 and older for older adults (n = 25).
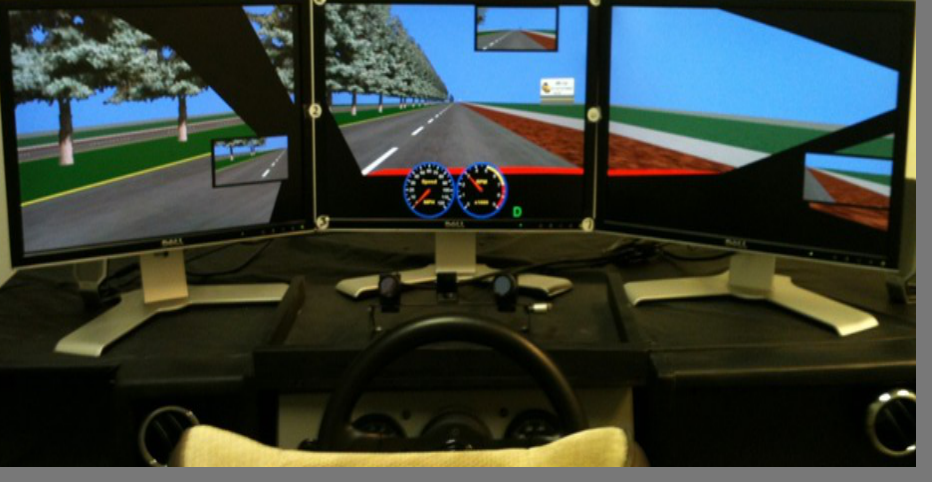
Participants were familiarized with the simulator during a brief, 2.84 mile, standardized four lane highway calibration scenario to assure that they met a minimum standard proficiency with basic driving tasks. Participants then engaged in a driving task comprised of driving on a 16-mile simulated four lane bi-directional highway with a median during daytime. A variety of billboards were programmed to appear at predetermined distances within the scenario, and participants were instructed to drive as they normally would on a real interstate. A posted speed limit of 65 mph was displayed periodically throughout the scenario More specifically, the simulation was displayed on three, 20” LCD computer monitors, providing a 135° field of view. Participants sat within the simulator’s passenger compartment, which provided a view of the roadway and dashboard instruments, including a speedometer. The vehicle was controlled by moving a steering wheel in a typical driving manner and depressing accelerator and brake pedals accordingly. An on-board stereo sound system provided naturalistic engine sounds, external road noise, and sounds of passing traffic (see Figure 8).
The driving simulation displayed a mixture of digital and static billboards interspersed throughout the drive and always appeared on the right side of the road. A total of 16 billboards were presented in the simulation drive. Each billboard was presented once per simulation, thus the billboard order was fixed across participants. Transition times for the digital billboards varied to mimic naturalistic digital billboards, which transition at different points in time while a driver passes. Two transition time points were established at 250 feet and 500 feet away from the billboard to ensure clear visibility of both first (initial) and second (changed) advertisements. Therefore, if the billboard was digital, the first advertisement would change to another advertisement once the participant passed the predetermined marker (i.e., 250 or 500 feet from the billboard) while driving.
The 16-mile drive was further broken into four equal parts for development purposes. Each part consisted of the following: 1) a billboard that transitioned (i.e., changed from one advertisement to another) when the driver was 500 feet away from it, 2) a billboard that transitioned (i.e., changed from one advertisement to another) when the driver was 250 feet away from it, 3) a billboard that was static and therefore did not transition, and 4) a segment that did not include a billboard at all. Each of these 4 parts spanned one mile each and were populated in a randomized order according to a Latin square design.
Analysis
Key driving variables were coded electronically by the simulator and analyzed across four conditions: 250-foot billboard transition, 500-foot billboard transition, static billboard, or no billboard present. These include a) the number of speed limit exceedances, i.e., situations in which the participant’s speed exceeded 69 miles per hour (mph) as recorded by the simulator, b) the number of road edge excursions, i.e., situations in which the right tire touched or crossed the right line of the road, and c) the total number of motor vehicle collisions, i.e., situations in which the driver made contact with another vehicle or structure within the scenario.
Figure 8: Photo of driving simulator
To examine the impact of billboards on various components of driver distraction, primary analyses involved a series of Repeated Measures ANOVAs (RM ANOVA) where the between subjects factor was age group (teen, middle, older) and the within-subjects factor was billboard type (static vs. digital, not present vs. static vs. 250-ft transition vs. 500-ft transition). Interactions between age group and billboard type were tested using RM ANOVAs. Degraded driving performance (e.g., speed exceedances, motor vehicle collisions, and road edge excursions) served as dependent variables.
Results
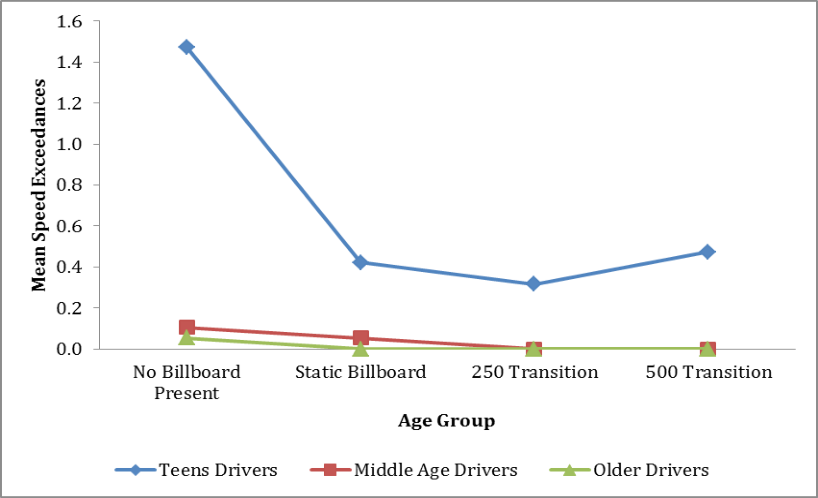
Consideration of participants’ demographic information showed no significant differences of gender and ethnicity across age groups. As Figure 9 shows, a marginally significant difference among age groups for speed exceedances was observed among age groups (F (2, 54) = 2.85, p = 0.066). In a pairwise comparison of age groups, teens had significantly more speed exceedances than older drivers (p = 0.042). The results show no significant interaction between billboard type and age group (p = 0.635). There was not a significant main effect of road edge excursions (F (2, 54) = 0.551, p = 0.580). However, there was a marginally significant effect of billboard type on road edge excursions (p = 0.071). A closer pairwise RM ANOVA showed that there was statistically significant more road edge excursions in the no billboard condition compared to all other billboard conditions (no billboard vs. static billboard, p = 0.045; no billboard vs. 250 transition, p = 0.037; no billboard vs. 500 transition, p = 0.045) (Figure 10).Furthermore, there was no interaction of billboard type and age group (p = 0.141). Finally, there was only one motor vehicle collision across all age groups, which is too few to produce significant findings (F (2, 54) = 1.000, p = 0.375). Human Aspects of Transportation II (2021)
Figure 9: Mean frequency of speed exceedances
0.9
0.8
0.7
0.6
Teen
0.5
0.4
Middle
0.3
Older
0.2
Mean Road Edge Excursions
0.1
No Billboard Present Static Billboard 250 Transition 500 Transition 0.0
Figure 10: Mean road edge excursions
Figure available in the original PDF paper.
Discussion
This study is among the first to look at billboard distraction across different age groups, namely teens and older drivers, who have the highest rates of motor vehicle collisions. Overall, participants in the driving simulator study had fewer speed exceedances when there was a billboard present, indicating that their attention may have been captured by the billboards resulting in a slowed speed. Teens, as expected, had more speed exceedances than middle aged and older drivers. Also, in the presence of billboards, the number of speed exceedances across all age groups was significantly reduced. Finally, fewer road edge excursions were recorded in the presence of billboards of any type as compared to the no billboard condition. These findings suggest that there is an impact of billboard distraction on driving performance, which could be attributed to drivers paying more attention to the billboard.
CONCLUSION AND FUTURE STEPS This paper explored perceived and real impacts of digital advertising billboards on driving performance of individuals in Alabama from representative samples across the lifespan. This work presents a contribution to the traffic safety research as it provides some insights that can help inform future public policy relating to driver distraction and billboards, especially in regards to regulations for billboard use. The findings offer support to future interventions such as incorporating billboard awareness into driver education courses for teen drivers, since younger drivers’ performance was most affected out of all age groups.
The online survey suggested that more than 40 percent of the drivers admitted looking at the digital billboards for a sufficiently long time, but most of the drivers rarely slow down. However, some inconsistencies in responses were observed, indicating that some respondents might indicate one perception in general but that perception might not necessarily reflect on their action when put in a real situation. This is further supported by the findings of the simulation study that showed participants having fewer speed exceedances when there was a billboard present, indicating that their attention may have been captured by the billboards resulting in a slowed speed.
A close observation of the drivers’ actual behavior in a naturalistic study environment would be more suitable to capture the real reaction of drivers as they approach a static or digital advertising billboard, and it is recommended for future study. Moreover, an expansion of the questionnaire survey sample to include responses from other states is planned for the near future. Statistical comparisons will be performed to establish if regional differences affect the findings of the study. Also, the scope of the driving simulation study will be expanded to investigate the effect of external distractions from billboards on driver's visual and cognitive attention.
A limitation of the current work is the lack of significant results in performance degradation. This may be due to the fact that hazards were not presented throughout the simulation - there were not ample opportunities to crash. Rather, the simulation was a mundane driving situation. Speed exceedances seemed to have the largest impact in this study, perhaps because the scenario was a straight road, which could have been interpreted as boring by participants. In addition, there was not a significant increase in road edge excursions. Consideration of within lane deviation may pick up subtleties in swerving that went undetected. Future studies should look at lane deviation as a measure of driving performance.
ACKNOWLEDGMENT
Funding for this study is provided by US DOT/RITA through the National Center for Transportation Systems Productivity and Management (NCTSPM) and the Alabama Department of Transportation (ALDOT). The support of the study sponsors is greatly appreciated.
REFERENCES
Coetzee, J. (2003). The Evaluation of Content on Outdoor Advertisements. Presented at the Southern African Transport Conference, 14-16 July 2003. Copeland, L. (2010). More Communities Banning ‘Television on a Stick.’ USA Today; 23 Mar 2010. Molino, J.,Wachtel, J.,Farbry, J., Hermosillo, M., Granda, T. (2009). The Effects of Commercial Electronic Variable Message
Signs (CEVMS) on Driver Attention and Distraction: An Update. Publication FHWA-HRT-09-018.FHWA, Feb 2009.
Outdoor Advertising Association of America [OAAA]. (2013). Out of home media formats: Number of out of home displays (2013), October 14, 2013, from http://www.oaaa.org/OutofHomeAdvertising/OOHMediaFormats/OOHMediaFormats.aspx Sisiopiku, V.P., Hester, D., Gan, A., Stavrinos, D., Sullivan, A. (2013). “Roadside Advertising and Traffic Safety”, 3 rdAnnual
International Conference on Civil Engineering, Athens, Greece. Wachtel, J. (2009). Safety Impacts of the Emerging Digital Display Technology for Outdoor Advertising Signs.Project 20-7 (256), Final Report.NCHRP, Apr 2009. Wachtel, J. (2011). Digital Billboards, Distracted Drivers. Planning, Vol. 77, Issue 3, Mar 2011, pp. 25-27. Wallace, B. (2003). Driver Distraction by Advertising: Genuine Risk or Urban Myth? Proceedings of the Institution of Civil
Engineers: Municipal Engineer, Vol. 156, No. 3, Sept 2003, pp. 185-190.
LISTED IN THE AHFE DIGITAL BOOKSTORE CATALOGUE
Explore the complete digital volume
Advances in Human Aspects of Transportation: Part II
Read this individual research paper free through the original publisher, or explore the full digital proceedings book.
ISBN 978-1-4951-2098-5
Explore this ISBN in the AHFE Bookstore ↗Listed in the July 2026 bookstore catalogue; search by ISBN to confirm current availability · Digital book purchase optional