Curtis Craig, Marshall Mabry, Bradley Drahos, William Kessler, Thomas Lenz, Kara Olander, Nichole Morris (2024). An assessment of two pedestrian safety inventories. In: Advances in Human Factors of Transportation. AHFE Open Access, vol. 148, pp. 507–517. https://doi.org/10.54941/ahfe1005242
Pedestrian safety inventories for auditing roadway features and infrastructure are a promising way to rapidly assess pedestrian injury likelihood in a city location, particularly when the auditor can score the location remotely via tools such as Google Street View (GSV). This study provided a preliminary assessment of whether two remote assessment inventories were as reliable as in-person auditing, and whether the two tools were associated with pedestrian safety measures. The researchers repeatedly performed crossings at six locations to collect safety outcome data. For the safety inventories, one team of coders scored the locations in-person, and a separate team of coders scored the locations in GSV. Analyses indicated generally good agreement between the in-person and GSV scores, and a significant relationship between the inventory scores and driver yielding/stopping rate to the crossing pedestrians. The two inventories were predictive for different reasons, and future research will further assess and refine them.
In 2021, worldwide road deaths numbered approximately 1.19 million, rep- resenting the leading cause of death for people aged 5–29 years of age, and globally 23% of these deaths were pedestrians, ranging from 15% in Southeast Asia to 29% in the Western Pacific region (WHO, 2023). Besides fatalities, injury crashes can result in sustained difficulties for a surviving pedestrian, including cognitive and physical problems (Dean, 2022). Further- more, when considering more affluent countries and regions, improvements in pedestrian safety and walkability result in increased walking rate in pop- ulations that would otherwise drive or use other forms of transportation (Gilderbloom et al., 2015). This in turn contributes to sustainable trans- portation goals and improved public health (Howell et al., 2019). Therefore, both road safety and specifically pedestrian safety remain major focuses for engineers, urban planners, and human factors professionals in surface transportation.
Role of Infrastructure in Pedestrian Crashes The physical structure and features of roadways play a significant role in pedestrian crash risk and the rate of dangerous driver-pedestrian conflicts. While a complete review of roadway features significantly related to crash risk is beyond the scope of this article (see Stoker et al., 2015), some of the roadway features known to affect crash risk include: number of lanes (Morris et al., 2020), traffic signal presence (Zegeer et al., 2006), pedestrian refuge islands (Pulugurtha et al., 2012), crosswalk markings (Craig et al., 2023), intersections compared to midblock segments (Quistberg et al., 2015), street lighting (Gitelman et al., 2012), crosswalk visibility (Sawar et al., 2017), and the presence of public transportation stations such as bus stops (Craig et al., 2019). Given that infrastructure plays an outsized role in pedestrian crash risk, traffic engineers and urban planners would benefit from the ability to reliably assess a given location for estimated pedestrian crash risk and then propose an intervention to reduce risk if needed. Zegeer and colleagues (2006) intro- duced a pedestrian safety index based on a combination of camera data assessing behaviours along with subjective ratings at multiple sites across three cities in the United States. The key contributors to pedestrian safety in that index were the presence of signals, stop signs, number of lanes, 85th
percentile speed, traffic volume, and the character of the local land use (e.g., commercial area).
Remote Pedestrian Safety Infrastructure Assessment While the aforementioned pedestrian safety index is useful (Zegeer et al., 2006), application of the index requires access to a database of the relevant variables (e.g., average ADT, 85th percentile speed), with accurate and recent data, or an in-person assessment of the site in question, imposing significant travel and time costs on the auditor. However, technological and adminis- trative developments in collecting and maintaining mapping data introduces new potential avenues for safety assessment, such as the use of photographic footage of locations from Google Street View (GSV) in Google Maps. Since 2007, footage of locations has been reliably updated every 1–3 years as a rule of thumb. While this type of footage does not permit reliable data for speed and traffic volume, the other elements that contribute to pedestrian crash risk are available. Furthermore, advances in the research literature on which roadway features contribute to pedestrian crash risk allows for a more comprehensive assessment of relevant variables (Stoker et al., 2015). Two such remote pedestrian inventories include the Inventory for Pedestrian Safety Infrastructure (IPSI; Nesoff et al., 2018) and a Google Street View pedestrian audit safety tool (GSV-PAST; Mooney et al., 2020), the latter borrowing from a remote assessment method used to determine the likelihood of pedestrian injury severity (Hanson et al., 2013).
The IPSI was intended as a remote assessment tool to assess the risk of overall pedestrian injury around a specific location or corner store, although it is unclear whether the emphasis during tool development was on reduc- ing injury severity or likelihood (Nesoff et al., 2018). The IPSI requires
An Assessment of Two Pedestrian Safety Inventories 509
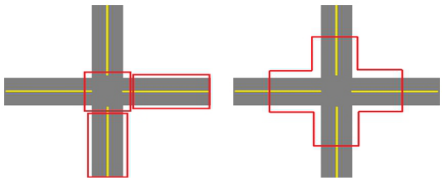
assessing a full city block through GSV, split into 3 segments: an initial road segment between two intersections, the intersection of interest, and an adjoin- ing perpendicular road segment between two intersections (see Figure 1). The two road segments are audited with the same road segment questions, 20 questions per road segment, while the intersection has a separate set of 11 questions, resulting in a 51-item inventory. The reliability assessment of the IPSI indicated that the inventory had good-to-great levels of inter- rater reliability (Nesoff et al., 2018). The GSV-PAST was similarly intended as a remote assessment tool for pedestrian safety assessment, utilizing GSV (Mooney et al., 2020). The methodology for assessment with the GSV-PAST requires the auditor to remotely position themselves at the centre of the inter- section of interest in GSV, make a full rotation, and travel two clicks or steps into each leg of the intersection before answering the items in the 22-item inventory (see Figure 1). The 22-item inventory was the final selection of an original 38 item inventory retaining items with an inter-rater agreement kappa f at least 0.35 or higher (Mooney et al., 2020).
Figure 1: Coded sections of the intersection and midblock as originally prescribed in the IPSI (left) and the GSV-PAST (right).
There are a few concerns with the two remote pedestrian assessment inven- tories. First, neither inventory produces a single score to estimate the overall pedestrian crash risk of an intersection or block. This means the auditor must use their judgment to determine whether a location poses unacceptable risks to pedestrians requiring treatment. Second, the remote inventories pro- vided reliability assessments with multiple remote coders but did not provide but did not provide similar comparative assessments with in-person coders. Because the footage on GSV can be years out of date, it is unclear whether scoring is consistent between in-person scoring and GSV scoring. Third, the assessment of the two remote inventories were purely focused on reliability, not validity. An assessment of validity, specifically construct validity, requires demonstrating that the measure is associated with the construct of inter- est (e.g., pedestrian crash risk), and whether said measure can predict risk. Such an approach was used to design the questions used in other pedestrian assessment tools (Zegeer et al., 2006).
The Present Study The goal of the present study was to provide an initial assessment of these two remote assessment tools for pedestrian safety by comparing both remote and
in-person methods with the same inventory items, while also testing whether the two inventories were associated with pedestrian-driver conflict outcomes. The scoring associations with these risk outcomes were made with two simple scoring systems to generate a single score of risk.
To test for association with pedestrian crash risk, it was necessary to use a proxy measure, as pedestrian crashes are too infrequent for the con- text of validity assessment. Therefore, the research team employed staged crossings at marked crosswalks at selected sites, as poor driver yielding/stop- ping rates have been associated with more pedestrian crashes at uncontrolled intersections (Schneider et al., 2017). By using a staged crossing methodol- ogy, the research team can generate numerous driver-pedestrian conflicts and record their outcomes on both unsignalized (e.g., partially stop-controlled) and signalized intersections.
If both inventories are reliable and valid, then the predictions were that (1) inter-rater reliability would be high across assessment modalities and (2) there would be a statistically significant relationship between the scores gen- erated by both inventories for a given site and the yielding/stopping rates generated by staged crossings at the site in the expected direction, with higher risk scores associated with more observed risky yielding/stopping behaviour.
METHOD
Pedestrian crash risk was measured indirectly by generating driver-pedestrian conflicts via staged crossings. The research team used a well-established crossing protocol for the unsignalized sites (Morris et al., 2020), and a modification of a crossing protocol for the signalized sites (Morris et al., 2023).
Staged Crossing Procedure Staged crossings focused on right-turning drivers at signalized sites and drivers going straight on unsignalized sites, as these two manoeuvres are most likely to generate legal conflict points with crossing pedestrians on marked crosswalks. Visits occurred in teams of two, with one team member serving as a staged crossing pedestrian, the other as an observer/coder, and the two switching roles midway through the site visit to share the exposure risk. The crosser neared the crosswalk as drivers approached, while allowing time for vehicles to see and respond to a pedestrian crossing. The staged crosser initi- ated the crossing by putting one foot in the street of the marked crosswalk and waiting for an indication of yielding or stopping by the approaching driver. For signalized sites with right-turning drivers, this attempt occurred on the activation of the green light and walk signal and the pedestrian observed a turn signal to indicate a driver intended to turn right. Drivers turning at sig- nalized sites at the far side of the street were counted as failing to stop if they turned while the staged pedestrian was halfway across the street in the first direction of travel. For unsignalized sites, the staged crossers utilized a pre- defined “dilemma zone” defined by the signal timing formula to guide when they should initiate the crossing to allow adequate time for drivers to see and react to crossing pedestrians. See Morris and colleagues (2020) for details on
An Assessment of Two Pedestrian Safety Inventories 511
the dilemma zone. For unsignalized sites, there were up to 20 crossings per site visit. For signalized sites, there were up to 20 walk cycles coded, with walk cycles lacking turning vehicles marked as non-events. For safety rea- sons, crossings occurred between 9:00 and 16:00 and did not occur during inclement weather (e.g., rain, snow). Site visits generated a count of vehicles yielding and not yielding to pedestrians.
Site Characteristics All sites were in Minneapolis, MN, USA. Minneapolis is in the upper Mid- western area of the continental United States and is an urban location with a population of over 400,000, with a population density of 3,074.21/km2 in 2020. It is also part of the larger Minneapolis-Saint Paul metropolitan area comprising 3.6 million inhabitants, with a population density of 1,001.7/km2
in 2020.
The sites were selected in cooperation with the City of Minneapolis as part of a larger project investigating the relative pedestrian safety effects of pedestrian infrastructure. See site details in Table 1, with traffic volume estimates taken from the Minnesota Department of Transportation’s Traf- fic Mapping Application. The data collected and reported here comprises the baseline assessment period of the overall project, measuring driver-pedestrian behaviour prior to the installation of the infrastructure.
Table 1. Site characteristics and crossing details.
Table available in the original PDF paper.
Location Type Traffic Volume (AADT)
Target Crosswalk Location
Crossing Dates (2023) Crossing or Cycle Count 31 July – 17 August 90
Bloomington Ave & E 24th St
Signalized 4,650 East leg of Intersection
31 July – 17 August 140
N 33rd Ave & N Lyndale Ave
Unsignalized 6,545 North leg of intersection
31 July – 17 August 178
N Lyndale Ave & 34th Ave N
Unsignalized 6,545 North leg of intersection
28 July – 8 August 80
Nicollet Ave & E 26th St Signalized 8,100 North leg of intersection
3 August – 17 August 120
Pillsbury Ave & W 36th St
Unsignalized 8,600 East leg of Intersection
31 July – 17 August 92
W 31st St & Pillsbury Ave
Signalized 8,000 South leg of intersection Note. The posted speed limit at each site was 25 mph, approximately 40 km/h.
Inventory Scoring Procedure The scoring of the six sites with the two safety inventories occurred in two modes, in-person or through GSV. Separate teams of two coders scored the two modes, with an individual coder scoring each site with both inventories in counterbalanced order. In practice, this meant that one team member would score one site with the IPSI and then the GSV-PAST, the other team member would score the same site with the GSV-PAST first, then the IPSI. The first team member would then score the next site with the GSV-PAST, then the
IPSI, while the second team member would score the next site with the IPSI, then the GSV-PAST, etc.
For IPSI scoring, two blocks are scored separately (see Figure 1, left). For signalized sites, the blocks scored were the two blocks traversed by right- turning vehicles that would conflict with a pedestrian crossing at the specified crosswalk (see Table 1). For the unsignalized sites, the selection of the second block was left to the discretion of the coding team, but the first block coded was the block that overlapped the target crosswalk at the site (see Table 1). The coding team reported that they always selected the proceeding straight segment on these sites, like the specific assessment method for IPSI described later.
In-person scoring required coders to walk on foot to the areas of assess- ment in the two inventories. For the IPSI (Figure 1, left), the team member would walk down the full length of the first block, noting features of the roadway, and score the first block questionnaire. Then they would stand at the corner of the relevant intersection and score the intersection question- naire. Finally, the individual would walk down the full length of the second block and score the second block questionnaire. For the GSV-PAST (Figure 1, right), the team member would start at the intersection, scan it for relevant features, and then proceed down each leg of the intersection about one-third of the distance of the block, to approximate the ‘two-click’ rule for viewing the legs specified for the GSV mode by Mooney and colleagues (2020). Once completed, the coder would then complete the GSV-PAST questionnaire.
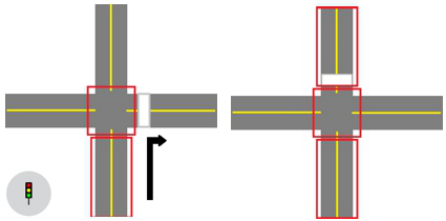
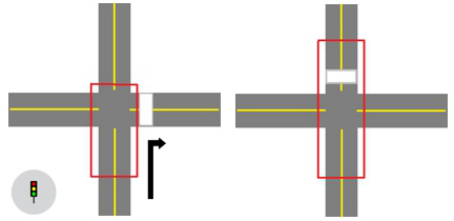
GSV scoring followed the procedure described in the supplemental materi- als by Nesoff and colleagues (2018) and Mooney and colleagues (2020). Like in-person scoring, the GSV coders scored the sites in counterbalanced order. However, because both inventories were intended to assess the entire intersec- tion and/or block, whereas our behaviour measures focused on one crosswalk at the intersection/block, the GSV coders also provided a secondary, specific scoring approach with the two intersections, focusing on segments of the intersection that would most likely contribute to driver-pedestrian conflict outcomes. Scoring with this second specific assessment method is described in Figure 2 and Figure 3.
Figure 2: The secondary specific assessment for the IPSI, with signalized sites (left) and unsignalized sites (right). The white stripe is the target crosswalk.
An Assessment of Two Pedestrian Safety Inventories 513
Figure 3: The secondary specific assessment for the GSV-PAST, with signalized sites (left) and unsignalized sites (right). The white stripe is the target crosswalk.
Inventory Measure Creation To assess construct validity and determine whether there was a relationship between the inventories and the outcome measure of the staged crossings (e.g., yielding rate), the responses on the inventories were converted to an overall measure of risk. This was done by imputing a binary increase in the level of risk per question in both inventories, from baseline (0) or minor risk, to an increase in risk (1), with each response in the inventories getting a zero or one. The specification of what qualified as a baseline or an increase in risk was based on the pedestrian safety research literature partially referenced in the introduction. The resulting assortment of zero and one scores was then summed to provide a single score of risk, with higher numbers representing increased risk to pedestrian safety.
Because all responses represented either no change or an increase in risk, a minor change was made in scoring for the GSV-PAST. This inventory has three items that are scored if bicycle lanes were present at the site, and scoring those would result in an increase in risk for any site that had bicycle lanes. Therefore, the questions on bicycle lane characteristics were not included in the summary score, except for a question on whether a bicycle lane was present.
RESULTS
Reliability for the original scoring assessment method (Figure 1), consider- ing the resulting risk scores, observed Krippendorff’s alpha (α) for the IPSI as α = 0.871, and for the GSV-PAST as α = 0.818, between all coding teams across modalities. This indicates good reliability between in-person and GSV approaches.
Driver-Pedestrian Conflict Outcomes The yielding and non-yielding counts per crossing/cycle were converted into percentage non-yielding rate with a denominator of total vehicles in conflict with the crossing pedestrian. The analyses used generalized linear models with a normal probability distribution and identity link function. The pro- ceeding set of analyses assumed an auditor would only have knowledge of factors available through the inventory, and only controlled for extraneous facets, including the gender composition of the staged pedestrian team and whether there were known new elements in the roadway that would affect driver behaviour (e.g., newly painted crosswalk markings), coded in a binary
variable as a novelty factor. Preliminary analyses observed that these two fac- tors contributed to the non-yielding rate, but crossing time of day did not, therefore the latter variable was excluded. The results of the initial analyses are presented in Table 2. Analyses accounted for block selection by in-person teams for the IPSI method.
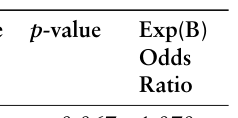
Table 2. Initial analyses on non-yielding rate and inventory risk scores.
Table available in the original PDF paper.
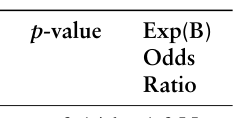
B (SE) AIC Wald Chi-Square (df)
Equation reproduced from the original PDF.
IPSI Original In-Person
0.213 (0.040) 226.876 28.570 (1) <0.001 1.237
IPSI Original GSV 0.106 (0.010) 512.824 107.221 (1) <0.001 1.112 GSV-PAST Original In-Person 0.202 (0.022) 534.207 82.024 (1) <0.001 1.224 GSV-PAST Original GSV
0.249 (0.024) 513.528 106.512 (1) <0.001 1.283
IPSI Specific GSV 0.046 (0.003) 451.456 185.445 (1) <0.001 1.047 GSV-PAST Specific GSV Note. Each risk score is part of a separate analysis with its corresponding goodness of fit.
Given the disagreement between in-person and GSV IPSI score associations with non-yielding percentage, a closer examination of agreement between the two modalities with the IPSI observed a tendency for disagreements for ques- tions on whether there were marked crosswalks with no traffic control, the number of intersecting street segments, the presence of a traffic median, and the presence of bus stops. Zegeer and colleagues (2006) observed that signal presence and traffic volume predicted risk, therefore a secondary analysis was conducted with the same factors as presented in Table 2, but also controlling for whether the site was signalized or unsignalized and vehicle count per site visit is presented in Table 3.
Table 3. Secondary analyses controlling for site type and estimated vehicle volume.
Table available in the original PDF paper.
B (SE) AIC Wald Chi-Square (df)
Equation reproduced from the original PDF.
IPSI Original In-Person
Equation reproduced from the original PDF.
IPSI Original GSV −0.084 (0.024) 443.040 12.253 <0.001 0.919 GSV-PAST Original In-Person 0.027 (0.028) 454.211 0.944 (1) = 0.331 1.027 GSV-PAST Original GSV
Equation reproduced from the original PDF.
IPSI Specific GSV 0.027 (0.013) 450.573 4.600 (1) =0.032 1.028 GSV-PAST Specific GSV Note. Each risk score is part of a separate analysis with its corresponding goodness of fit.
An Assessment of Two Pedestrian Safety Inventories 515
CONCLUSION
The hypothesis was that both inventories were reliable across assessment modality and valid in respect to pedestrian risk. Assessment of validity found that most of the calculated risk scores were significantly associated with the likelihood of drivers not yielding or stopping for the staged pedestrian, except for the in-person IPSI original scoring method. Finally, the secondary analy- sis observed that two major explanatory factors for the observed relationship between the inventory scores and yielding rates are the presence of traffic sig- nals and questions related to traffic volume (e.g., lane count, number of street segments). The IPSI scores from GSV was still associated with non-yielding rates.
The two inventories were found to have good reliability across assessment modality as measured by Krippendorff’s alpha. As indicated in the results section, there were a few disagreements between the modalities for IPSI for the original scoring method, which may be due to the context. With GSV, an auditor can take their time to review the guidelines when they are uncertain of how to score a particular feature, whereas an individual scoring in person may not find this review as easy to accomplish, leading to inconsistencies. These inconsistencies may account for the results in Table 2.
When controlling for the presence of traffic signals and vehicle count, the GSV-PAST was no longer significantly associated with non-yielding percent- age, whereas the IPSI remained associated (Table 3), but the original scoring method (Figure 1) was significant in the opposite direction and the specific scoring method (Figure 3) in the same direction. After controlling for other significant factors for risk (signals/volume), introducing more sources of risk values in a second block in the original method calculation resulted in flipping the direction of association.
Future studies should consider: (1) More sites and crossing data, given that only six sites with a relatively narrow distribution of infrastructure charac- teristics were considered, (2) re-score the sites with the inventories after any installation of pedestrian safety infrastructure, to determine if changes in con- flict behaviour are associated with pre-post installation score changes, and (3) re-examine scoring approaches (e.g., weighted measures) to ensure that any single score or index effectively and accurately capture pedestrian crash risk, given that the scoring approach used here used a simple binary scoring system from baseline to increasing risk.
The preliminary assessment of these two inventories indicates that there is a potentially valuable and valid use of remote inventories to predict pedes- trian crash risk. If the sensitivity can be improved via adjustment of the questions or the scoring, while more reliably including other measures such as speed limits and land use, the inventories may provide significant sup- port for new diagnostic technologies to assist traffic engineers in measuring pedestrian risk.
ACKNOWLEDGMENT
The authors would like to acknowledge Mitchell Kiecker, David Glyer, and the other members of the MnDOT and LRRB Technical Advisory Panel.
REFERENCES
Craig, C. M., Drahos, B. A., Morris, N. L., and Van Houten, R. (2023). The sustained and generalized effects of multifaceted treatment on unsignalized pedestrian crossings. Journal of Transport & Health, 31, 101648. Craig, C. M., Morris, N. L., Van Houten, R. and Mayou, D. (2019). Pedestrian
safety and driver yielding near public transit stops. Transportation Research Record, 2673(1), pp. 514–523. Dean, T. (November 22, 2022). “He was fast he ran you right over’: what it’s like to get hit by an SUV.” The Guardian Website: https: //www.theguardian.com/world/2022/nov/22/he-was-fast-he-ran-you-right-o ver-what-its-like-to-get-hit-by-an-suv [Accessed: 15 March 2023]. Gilderbloom, J. I., Riggs, W. W., and Meares, W. L. (2015). Does walkability matter?
An examination of walkability’s impact on housing values, foreclosures and crime. Cities 42, pp. 13–24. Hanson, C. S., Noland, R. B. and Brown, C. (2013). The severity of pedestrian crashes: An analysis using Google Street View imagery. Journal of Transport Geography, 33, pp. 42–53. Howell, N. A., Tu, J. V., Moineddin, R., Chu, A., and Booth, G. L. (2019). Association
between neighborhood walkability and predicted 10-year cardiovascular disease risk: The CANHEART (cardiovascular health in ambulatory care research team) cohort. Journal of the American Heart Association, 8 (21), e013146. Mooney, S. J., Wheeler-Martin, K., Fiedler, L. M., LaBelle, C. M., Lampe, T., Ratanatharathorn, A., Shah, N. N., Rundle, A. G. and DiMaggio, C. J. (2020). Development and validation of a Google Street View pedestrian safety audit tool. Epidemiology, 31(2), pp. 301–309. Morris, N. L., Craig, C. M., Drahos, B., Tian, D., Van Houten, R., Mabry, M., and
Kessler, W. (2023). Multi-city study of an engineering and outreach program to increase driver yielding at signalized and unsignalized crosswalks. Minnesota Department of Transportation. Retrieved from the University of Minnesota Digital Conservancy, https://hdl.handle.net/11299/258929. Morris, N. L., Craig, C. M., and Van Houten, R. (2020). Effective interventions to reduce multiple-threat conflicts and improve pedestrian safety. Transportation Research Record, 2674(5), pp. 149–159. Nesoff, E. D., Milam, A. J., Pollack, K. M., Curriero, F. C., Bowie, J. V., Gielen, A. C.
and Furr-Holden, D. M. (2018). Novel methods for environmental assessment of pedestrian injury: Creation and validation of the inventory for pedestrian safety infrastructure. Journal of Urban Health, 95, pp. 208–221. Pulugurtha, S. S., Vasudevan, V., Nambisan, S. S., and Dangeti, M. R. (2012).
Evaluating effectiveness of infrastructure-based countermeasures for pedestrian safety. Transportation Research Record, 2299(1), pp. 100–109. Quistberg, D. A., Howard, E. J., Ebel, B. E., Moudon, A. V., Saelens, B. E., Hurvitz, P. M., Curtin, J. E. and Rivara, F. P. (2015). Multilevel models for evaluating the risk of pedestrian–motor vehicle collisions at intersections and mid-blocks. Accident Analysis & Prevention, 84, pp. 99–111. Schneider, R. J., Qin, X., Shaon, M. R. R., Sanatizadeh, A., He, Z., Wkyhuis, P., Block,
B., Santiago, K., and Bill, A. (2017). Evaluation of Driver Yielding to Pedestrians at Uncontrolled Crosswalks. University of Wisconsin-Madison Traffic Opera- tions and Safety (TOPS) Laboratory, Madison, WI, USA. Retrieved from: https:// wisconsindot.gov/Documents/safety/education/pedestrian/wipedstudy.pdf.
An Assessment of Two Pedestrian Safety Inventories 517
Stoker, P., Garfinkel-Castro, A., Khayesi, M., Odero, W., Mwangi, M. N., Peden, M., and Ewing, R. (2015). Pedestrian safety and the built environment: a review of the risk factors. Journal of Planning Literature, 30(4), pp. 377–392. WHO (2023). Global status report on road safety 2023 [online]. Available at: https:
//www.who.int/publications/i/item/9789240086517 [accessed: 17 January 2024]. Zegeer, C. V., Carter, D. L., Hunter, W. W., Stewart, J. R., Huang, H., Do, A. and Sandt, L. (2006). Index for assessing pedestrian safety at intersections. Transporta- tion Research Record, 1982(1), pp. 76–83.
LISTED IN THE AHFE DIGITAL BOOKSTORE CATALOGUE
Explore the complete digital volume
Advances in Human Factors of Transportation
Read this individual research paper free through the original publisher, or explore the full digital proceedings book.
ISBN 978-1-964867-24-3
Explore this ISBN in the AHFE Bookstore ↗Listed in the July 2026 bookstore catalogue; search by ISBN to confirm current availability · Digital book purchase optional