Students' Compatibility (2022). University Classrooms and. In: Advances in Ergonomics In Design, Usability & Special Populations: Part I. AHFE Open Access, vol. 18. https://doi.org/10.54941/ahfe100794
Luís Sousa, Maria Eugénia Pinho, Pedro Arezes and Joaquim Góis, Faculty of Engineering, University of Porto, Rua Doutor Roberto Frias, 4200–465 Porto, Portugal ↗
This study aimed to assess the compatibility between students’ anthropometric dimensions and 9 school furnitures (5 chairs and 4 tables) available in the classrooms of the Faculty of Engineering of the University of Porto (FEUP). 206 students (131 males and 75 females) from different courses, with ages ranging from 18 to 35 years old, were measured by using both a stationary and a portable anthropometer. A set of 14 static anthropometric dimensions were collected. This enabled the creation of the anthropometric database of the faculty’s student population. Students’ majority (69.9%) reported feeling discomfort while using the classroom furniture. The interpretation of the obtained factor plans highlights not only a difference between genders, but also differences regarding the importance of anthropometric variables in the explanation of the perceived comfort. The results show that most of the chairs are incompatible with users’ characteristics, being noticeable a significant difference between fixed and adjustable type chairs. Likewise, when used with the chairs, tables also revealed significant incompatibilities. This study seems to indicate that classroom furniture is usually selected and acquired without due previous ergonomic concern, which often results in its inadequacy and mismatch with the end users anthropometric characteristics.
Products are designed for a specific function and are expected to demand benefits to the user. However they can only fulfill their purposes when people are able to use them well. Ergonomics is the tool that enables the fitting of the product, with the user and the environment, whether it is for work or leisure, providing an easy, effective and safe work (Mokdad and Al-Ansari, 2009). The principle of user-centered design was defined as the fit of the design of an object, a system or an environment that are intended to human use to the physical and mental characteristics of its human users, as well as for the demand of the task (Pheasant and Haslegrave, 2006).
One way of designing the task, based on the physical characteristics of the user, is doing it according to the anthro- pometric characteristics of the populations, such as body size (reach, body segment length, and height), shape (seg- ment circumferences, widths), strength and working capacity (Barroso et al., 2005; Chuan et al., 2010).
Anthropometric studies of the Portuguese population are recent and until 2005, there was a lack of anthropometric data from the Portuguese population. Previously, only Padez (2002) conducted a study in which she gathered data obtained by the army, consisting of stature measurements of the 18 year old young men that went to military service. Later, Barroso et al. (2005) measured a sample of the Portuguese population, and created the first anthropometric Ergonomics In Design, Usability & Special Populations I (2022) database of this population, comprising 25 static anthropometric dimensions. Despite the existence of this database and its high relevance, the student population of a university is, in its majority, much more narrowed to young peo - ple (18 to 25 years old). Thereby, the use of that database would probably result in some error due to two main rea- sons: (1) its age range goes from 18 to 65 years old; (2) the time gap between the two studies. The first one reflects the accentuation of the spinal curvature in people with ages greater than 40 years old (Pheasant and Haslegrave, 2006) which results in a lowering of people’s stature. The second reason may be supported by the expected change in some anthropometric characteristics due to the secular trend (Arezes et al., 2006). Also, Padez (2002) estimated an increase of 9.9 mm per decade in Portuguese male stature, while another study (Kaya et al., 2003), carried out among Turkish individuals between 15 and 18 years old, suggests that anthropometric databases should be updated every 5 years due to the effects of regional altitude and climate in the national anthropometric properties.
The classroom is a learning environment in which the furniture is an important physical element that is expected to facilitate learning, providing a comfortable and stress-free environment. However, inadequate school furniture may lead to the adoption of poor sitting postures in the classroom (Geldhof et al., 2007; Koskelo et al., 2007) and thereby impair the learning process. However, other studies show that these requirements are often neglected when design- ing the furniture (Corlett, 2006; Parcells et al., 1999), and hence mismatch between the dimensions of school furni- ture and students’ anthropometric measures usually occurs (Castellucci et al., 2010; Gouvali and Boudolos, 2006; Panagiotopoulou et al., 2004; Parcells et al., 1999). Poor sitting posture in the classroom is one of the main negative effects of bad furniture design on students (Dianat et al., 2013).
Students spend a considerable part of the day at school, and the majority of that time is spent in sitting position while doing their school work (Castellucci et al., 2010; Macedo et al., 2013). Since the use of fixed-type furniture in schools is common and students spend most of their time sitting in school, school furniture should match students’ requirements. However, studying in fixed-type furniture may induce constrained postures (Gouvali and Boudolos, 2006; Parcells et al., 1999). Given that people differ in size and postural preferences, workstations with adjustable seats are preferred as they have a significant positive effect on muscle tension and sitting posture, promote health and comfort (Koskelo et al., 2007; Thariq et al., 2010) and may be related to better academic grades (Koskelo et al., 2007).
Commonly schools and universities use to choose fixed-type chairs and tables because of adjustable chairs higher price and maintenance costs (Straker et al., 2006). Side-mounted desktop chairs are often used in university class- rooms. However, their correct design has been neglected, and Thariq et al. (2010) study shows that side-mounted chairs in their learning environment do not meet postural and comfort requirements of university students.
The lack of an anthropometric database of the Portuguese student population highlights the relevance of the current study. A three-fold objective was set: (1) to build an anthropometric database for the student population of the Fac- ulty of Engineering of the University of Porto (FEUP), (2) to assess the level of mismatch between student’s anthro- pometric dimensions of the Portuguese students of FEUP and the furniture dimensions by comparing their anthropo- metric dimensions with the dimensions of the available furniture, and (3) to find out if there is any statistically sig- nificant association between students’ perceived discomfort, related to the use of the classroom furniture, and the mismatch found between students’ anthropometric measurements and the school furniture dimensions.
MATERIAL AND METHODS Subjects
Two hundred and six students (131males and 75 females) from a universe of 7295 FEUP students were measured. The sample was mostly composed by students from the integrated master programs, but also includes students from undergraduate and master programs. Their ages range from 18 to 35 years old,, and they were selected when passing through the hall of the building where most classes are taken.
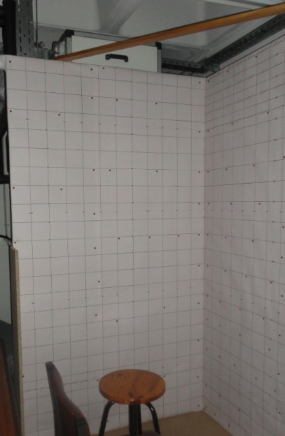
Equipment used for the anthropometric data collection Most measurements were taken on a stationary anthropometer (see ) built for the specific purpose of this study, with students sitting on a bench. Wood panels were arranged as a corner and covered with graph paper. To calibrate this anthropometer a self-retracting tape measure was used to overlap the lines of the paper with the lines of the measure.
Ergonomics In Design, Usability & Special Populations I (2022)
As an aid to the measurements, grid lines were drawn every 100 mm and the corresponding value was marked. Since the measurement of some anthropometric dimensions on the static anthropometer required the adoption of postures that could influence the results, a portable anthropometer (Holtain’s Harpender anthropometer) was used to collect the corresponding data.
Figure 1. Stationary anthropometer with 1200 × 1500 × 2100 (depth, width, height), in mm
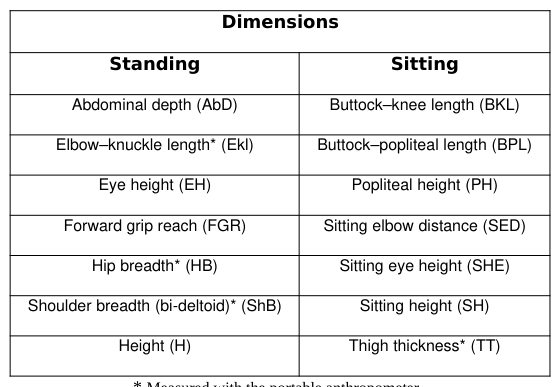
Data collection procedure A total of 14 static anthropometric dimensions were measured for each individual. Six dimensions were measured with the individual standing, while the remaining anthropometric measurements were obtained while the individual was seated. The dimensions measured in both standing and sitting positions are detailed in Table 1.
Table 1. Dimensions measured in standing and sitting positions
* Measured with the portable anthropometer Note: the remaining dimensions were measured on the stationary anthropometer
The anthropometric measures were taken with the subject in a relaxed and erect posture. Each student was measured Ergonomics In Design, Usability & Special Populations I (2022) in thin and tight cloths (T-shirt, shirt or thin sweatshirt), jeans, skirts or dresses. The standing dimensions were taken with the student standing erect to the anthropometer with their bare feet. The sitting dimensions were taken with the student seated erect onto the anthropometer, with knees bent 90°, and feet (without shoes) flat on the floor. The body dimensions were measured as described in ISO 7250-1:2008 (ISO, 2008).
Data treatment procedure First, Kolmogorov–Smirnov test was performed to study the normality of the anthropometric data’s distribution. Then, mean and standard deviation were calculated for all the measured dimensions. Later, Student’s t-test was used to test if the anthropometric dimensions of female and male populations were statistically different. In order to mea- sure data dispersion, the coefficient of variation (CV) was also calculated:
Types of furniture provided for FEUP students’ use FEUP’s furniture is diverse and so 5 types of chairs were measured: C1 – Old design chair with flat perpendicular surfaces (seat and back support); C2 – New design chair with rounded front edge and concavities in the seat and back support. The angle between the seat and the back is higher than 90º; C3 – New design chair with a more eccen- tric design, a rounded front edge and concavities in the seat and back. The angle between the seat and the back is slightly larger than 90º; C4 – Chair with adjustable height, with wheels and footrest. Its design is alike the C2 chair; C5 – Side-mounted desktop chair with a folding seat. The side-mounted desktop is on the right side of the chair.
The measured tables were: T1 – Old design table with metal frame and wood table top; T2 – New design table with metal frame and wood table top; T3 – Adjustable table with new design metal frame and wood table top; T4 – Table from the chair type 5 with armrest and a small space to lay notebooks.
As observed in the several analyzed classrooms, the following furniture combinations are used: Comb1 – C1 with T1; Comb2 – C2 with T2; Comb3 – C3 with T2; Comb4 – C4 with T3; Comb5 – C5 with T4.
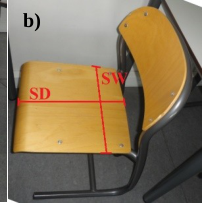
Dimensions of the available chairs and desks The dimensions of the classroom furniture were taken by the same measurer with a metal tape measure. The criteria, in Error: Reference source not found, used for the measurement of each dimension are defined as follows: Seat Height (SH) – vertical distance from the floor to the middle point of the front edge of the seat; Seat Depth (SD) – distance from the back to the front of the seat; Seat width (SW) – horizontal distance between the lateral edges of the seat; Seat to Desk Clearance (SDC) – distance from the top of the front edge of the seat to the lowest structure point below the desk; Seat to Desk Height (SDH) – vertical distance from the top of the middle of the seat to the top of front edge of the desk.
a)
b)
Figure 2. Representation of the classroom furniture measures: (a) lateral view and (b) top view Ergonomics In Design, Usability & Special Populations I (2022)
Anthropometric dimensions selected for the mismatch assessment From the total of 14 anthropometric dimensions measured only 6 of them were taken into account: Hip breadth (HB), Buttock–knee length (BKL), Buttock–popliteal length (BPL), Popliteal height (PH), Sitting elbow height (SEH), and Thigh thickness (TT).
Match and mismatch criteria Applied anthropometry and ergonomic principles were considered to evaluate the classroom furniture. Equations en- abling the determination of each furniture dimension were used. These equations are based in two types of criteria: “one way” or “two way”.
• “One way” means that only a minimum or a maximum value is required. Two levels (‘‘Match’’ and ‘‘Mis- match’’) were defined.
• “Two way” criteria require the establishment of two limits, and 3 levels: A minimum limit (High mis- match) and a maximum limit (Low mismatch), and, in between the limits, the dimension is adequate (Match).
Popliteal height and seat height mismatch: Based on published literature (Castellucci et al., 2010; Dianat et al., 2013), the mismatch between popliteal height (PH) and seat height (SH) is defined by the equation 1: (PH+30)cos30°≤SH ≤(PH +30 )cos5° (1)
Buttock-popliteal length and seat depth mismatch: Based on existing studies (Castellucci et al., 2010; Dianat et al., 2013; Parcells et al., 1999), the mismatch between buttock-popliteal length (BPL) and seat depth (SD) is defined by the equation 2: 0.80×BPL≤SD ≤0.95×BPL (2)
Hip width and seat width mismatch: Based on existing studies (Castellucci et al., 2010), the mismatch between hip width (HW) and seat width (SW) is defined by the equation 3: HW <SW (3)
Thigh thickness and seat to desk clearance: Based on published studies (Castellucci et al., 2010; Parcells et al., 1999), the mismatch between thigh thickness (TT) and seat to desk clearance (SDC) is defined by the equation 4: TT +20<SDC (4)
Sitting elbow height and seat to desk height mismatch: Based on recent studies (Castellucci et al., 2010; Dianat et al., 2013), the mismatch between sitting elbow height (SHE) and seat to desk height (SDH) is defined by the equa- tion 5: SEH ≤SDH ≤SEH+50 (5)
Questionnaire used in the discomfort survey A questionnaire-based survey was used, just before students’ measurement, to assess their perceived discomfort dur- ing the classes. Students’ responses to the question “When using the furniture available in classrooms and/or com- puter rooms, do you feel any discomfort?” are analyzed in this paper.
The multiple correspondence analysis (MCA) is a method used for factorial analysis of data, which objective con- sists in the description of the relational structures subjacent to the starting data. Through bi-dimensional graphics (factorial plans) obtained by reducing the spatial dimensionality of the raw data, MCA allows to visualize not only the internal relation system of each and every one of the variable sets (matrix rows) or the individuals (matrix lines) but also the existing relation system sets between variables and individuals. One of the advantages in the use of Ergonomics In Design, Usability & Special Populations I (2022)
MCA over other factor methods lies in the possibility of simultaneous visualization of the structures between vari- ables and individuals. MCA will be fully used for the description of the structural relation between variables.
Once our initial data matrix contains variables of different nature (e.g. the variable “Height” is quantitative and the variable “discomfort” is qualitative), a previous encoding of the initial data was carried out to ensure variables’ ho- mogeneity. Previously defined criteria were used in the classification (categories) of some measurable ordinal vari- ables in order to form classes, which will be subjected to detailed analysis.
Being Q the total number of variables and rj the number of categories in which the variable I is subdivided, the total number of data matrix rows (total of Q variable categories) is given by the equation 6:
Equation reproduced from the original PDF.
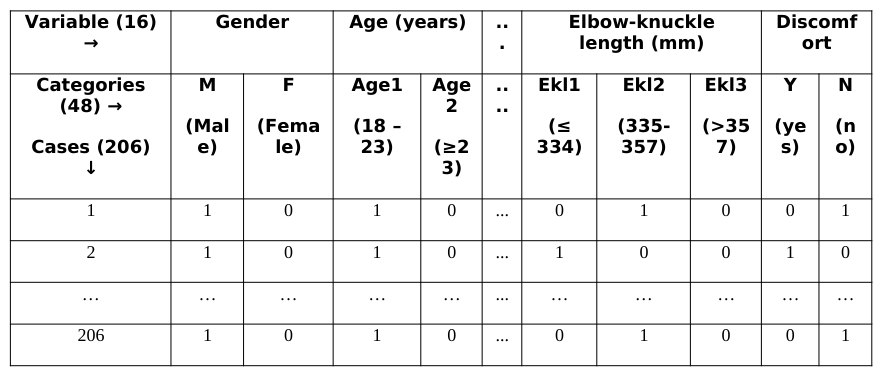
If X is the matrix with n lines (n individuals) by p rows (p categories) filled in terms of presence/absence by the bi- nary encoding present in the equation 8: xij={ 1−if individualihas occurrence∈category j 0−ot herwise , [Equation or mathematical symbol available in the original paper PDF] xij [Equation or mathematical symbol available in the original paper PDF] X (8)
It becomes possible to build the logic description board (encoded matrix) present in Table 2:
Table 2. Logic description board (presence/absence), matrix with Q variables (Q = 16) e p categoriesEquation reproduced from the original PDF.
This coding system ensures that whatever the nature of the variables, the sum in line of the values that come up in the table is constant and equal to the number of variables Q, bringing a statistic homogeneity that is required for sub- sequent processing.
For this case, our table is a matrix with 48 rows of which sum in line is always equal to 16 (number of variables) and which sum in row gives us the absolute frequency of each variable’s category. For each variable, the sum of the ab- solute frequencies of its categories is always equal to the number of individuals n, therefore the total in line and in row reproduces nQ. This is an important property as the table of data may be taken as a juxtaposition of contingency tables. This method is based on the works of Burt (1950), and developed by Benzécri (1973) and Lebart (1975), with the objective of questionnaire data treatment.
All the anthropometric dimensions were encoded in three categories (e.g., Ekl1, Ekl2, Ekl3): 1 – smaller, 2 – aver- age, 3 – Higher. As for the other variables (gender, age, discomfort) they were divided in two categories.
Ergonomics In Design, Usability & Special Populations I (2022)
RESULTS AND DISCUSSION
Students’ anthropometric dimensions A great majority (89%) of the participants are younger than 25 years old. That is reflected on the range of ages of the sample, 18-35 years. However, there is a predominance of younger students, 18-24 years. According to the statistics from FEUP, the sample characteristics (age and female percentage) ensure the intended representativeness of the student population.
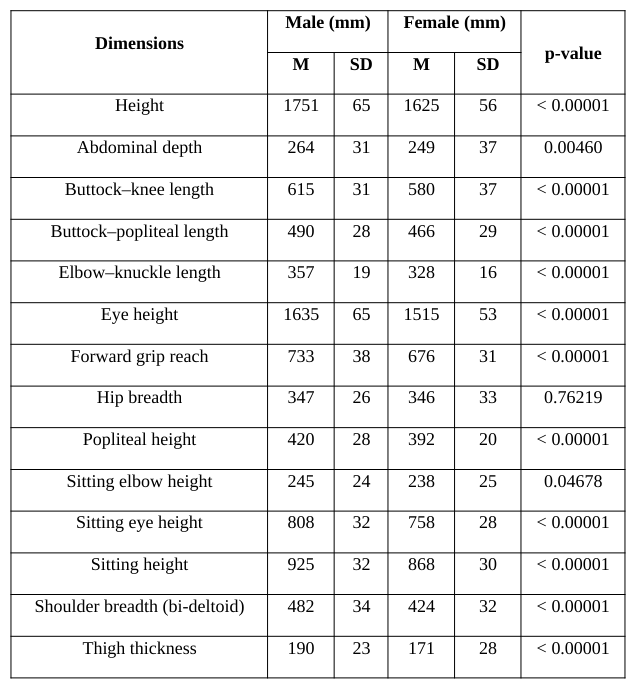
The results of Kolmogorov-Smirnov test showed that all the anthropometric dimensions, for both genders, are nor- mally distributed. Mean and standard deviation values for the 14 anthropometric dimensions measured in both gen- ders as well as the p-value computed by Student’s t-test are presented in Table 3Error: Reference source not found. The results indicate that male have greater anthropometric dimensions, except for the hip breath. In this case, there is no significant difference between both genders. This can be explained by the participant’s young age, which bodies are still developing.
Table 3. Mean (M), standard deviation (SD), in mm, of the male (n=131) and female (n=75) population and the mean comparison
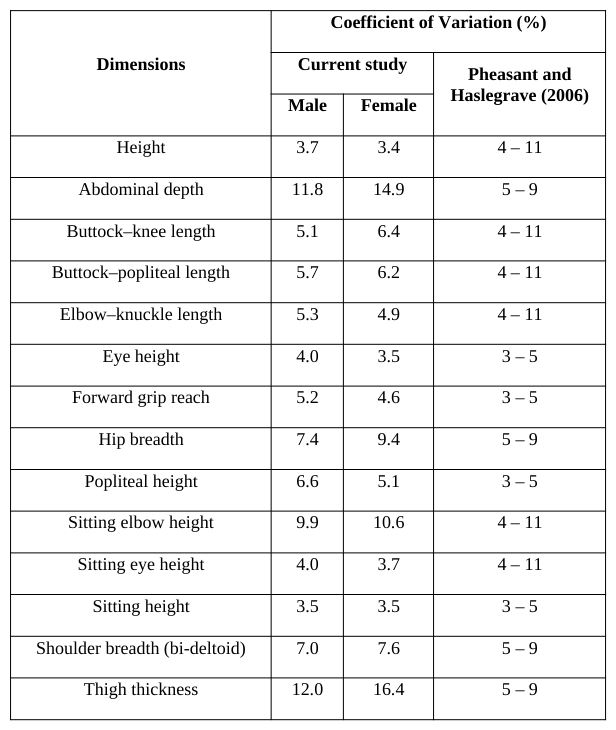
When compared with the characteristic ranges (see ) defined in Pheasant and Haslegrave (2006), lower CV was found in just one anthropometric dimension (male and female height). Nevertheless, about 70% of the dimensions are between the recommended ranges. Exceptions also occur with the values obtained for forward grip reach, hip breadth, popliteal height, thigh thickness and abdominal depth whose values are higher than the reference values by Pheasant and Haslegrave (2006). For the last two, a possible explanation can be the fact that these dimensions are Ergonomics In Design, Usability & Special Populations I (2022) associated to body soft tissue, particularly fat and muscle. With regard to the remaining dimensions, explanation for the CV values found is possibly associated with the need to enlarge the study sample.
Table 4. Coefficient of variation: results of the current study and the characteristic value range according to literature
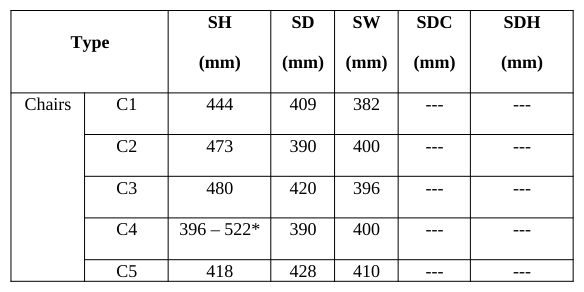
The dimensions of the available furniture (tables and seats) are presented in Table 5.
Table 5. Furniture dimensions, in mm SH SD SW SDC SDH
Ergonomics In Design, Usability & Special Populations I (2022)
* Values vary due to the adjustability of the furniture
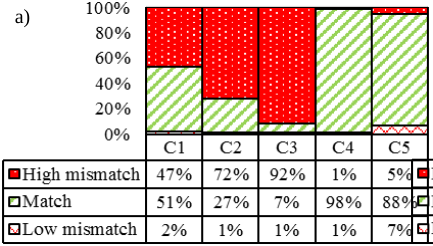
Mismatch between FEUP’s furniture and students’ anthropometric dimensions For the seat height (see Figure 3), a “High mismatch” was found for most male students (92% in C3, 72% in C2) while only 1% of the students are included in the “Low mismatch” group. In the case of the “High mismatch” most of the students will not be able to support their feet on the floor, generating increased pressure on the soft tissues of the thighs (Gouvali and Boudolos, 2006). Even though chair C1 has a lower “High mismatch” (47%) it still has a low “Match” with only 51% of the students. Chairs C4 (98%) and C5 (88%) have high levels of Match with the male population. For the female population the situation is still worse, with larger “High mismatches” in chairs C1 (91%), C2 (95%) and C3 (99%). Chair C4 remains with a good “Match” for 95% of the female population while C5 “Match” lowers to 51%.
a) b)
Figure 3. Mismatch between PH and SH for: a) male population; b) female population.
For the seat depth (see ) chair C4 has the lower “Match” with only 46% of the male population. All the other chairs have “Match” levels with more 70% of the population. With the female population only chairs C1 (84%), C3 (82%) and C5 (72%) have better “Match” with the hip breadth. C2 chair has a “High mismatch” with 69% and C4 with 61% of that population. The “High mismatch” may cause compression on the thighs and block the blood circulation causing discomfort (Gouvali and Boudolos, 2006) and also restrain the use of the back rest inducing kyphotic pos- tures (Castellucci et al., 2010).
Ergonomics In Design, Usability & Special Populations I (2022)
C1 C2 C3 C4 C5 0%
Figure 4. Mismatch between BPL and SD for: a) male population; b) female population.
Figure available in the original PDF paper.
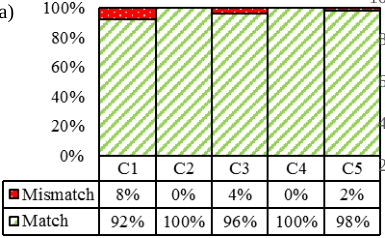
Concerning the seat width (see Figure 5), all the chairs have high levels of “Match”, once all of them are larger than 90%. For the female population only C1 chair has a lower “Match” with 88% of that population, unlike all the other chairs that have a “Match” with more than 90%.
100%
a) b)
80%
60%
40%
20%
C1 C2 C3 C4 C5 0%
Figure 5. Mismatch between HB and SW for: a) male population; b) female population.
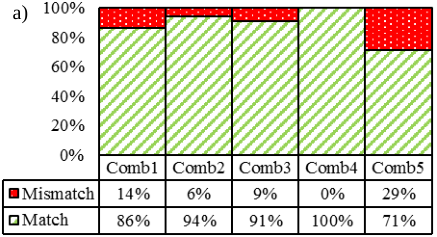
The seat to desk clearance (see Figure 6) is compatible with 86% of the male population in Comb1, 71% in Comb 5 and with more than 90% in Comb2 to Comb4. All combinations are compatible with more than 90% of the female population. This situation of mismatch produces mobility restriction due to the contact of the thighs with the desk (Parcells et al., 1999).
a) b)
Figure 6. Mismatch between TT and SDC for: a) male population; b) female population
As for the seat to desk height, Comb2 has a “High mismatch” with 50% of the male population and Comb3 with 38%. This requires them to work with shoulder flexion, causing muscle work load, discomfort and pain in the shoul- der region (Parcells et al., 1999). There is a “Low mismatch” in Comb5 with 96% of the population and with 29% in Comb1. Only Comb4 has a perfect “Match” with 100% of the students. In the female population the larger “High mismatch” belongs to Comb2 (65%), Comb3 (53%) and Comb1 (29%). Comb 5 has a “Low mismatch” with 53% of the female population and Comb4 has a 100% “Match”.
a)
b)
Ergonomics In Design, Usability & Special Populations I (2022)
Figure 7. Mismatch between SEH and SDH for: a) male population; b) female population
Perceived discomfort The survey results show that the majority of the students (69,9%) admitted to have felt discomfort while using the classrooms’ and the computer rooms’ furniture (tables and chairs). Perceived discomfort was higher among female students (74.7%) when compared with their male colleagues (67.2%).
From the enormous profusion of outputs obtained, only those considered relevant to our work were retained and in- terpreted. The F1 axis (see Figure 9) represents about 25% of the total variability of the considered data. Analyzing the projections of the different categories, along the F1 axis and considering that each category is only considered if its absolute contribution, for that axis, is over the value of 100/p (where p is the number of categories, in our case p = 48), we can establish that male students are the ones with bigger dimensions (negative semi-axis), in general, and the female students have the smaller dimensions (positive semi-axis). We can also perceive that these two groups are negatively correlated. These results allow us to assess the consistency of the collected data.
As for the factorial plan composed by the F1-F3 axis (see Figure 8), that comprises 7.9% of the sample, we will only interpret the categories projected on the F3 axis, as the F1 was already interpreted. There is a positive association be- tween the abdominal depth, the thigh thickness and the hip breadth, whether in the smaller (positive semi-axis) or the bigger (negative semi-axis) students. This may occur due to the fact that these are soft tissues which depth is as- sociated with body fat. There is also a negative correlation between these two groups.
Even though the F7 axis (see Figure 10) is responsible for a small percentage (3.8% of the sample) of the original to- tal data variability explanation, in part due to the large considered categories, we were able to establish the some correlations as follows. There is a correlation between the absence of discomfort and male (Male) younger (AGE1) students with average abdominal depth (AbD2) and smaller forward grip reach (FGR1). As for the presence of the discomfort there is a correlation with the older (Age2) female (Fem) students with smaller shoulder breadth (ShB1), average forward grip reach (FGR2), and higher popliteal height (PH3) and buttock-popliteal length (BPL3). These two groups are negatively correlated.
PH2 BPL1 BKL1 ShB3 HB1 -0.3 Male Age1 FGR1 AbD2 -0.6 N
-0.9 Applied Human Factors and Ergonomics International -1.2 -0.9 -0.6 -0.3 0.0 0.3 0.6 0.9 1.2 1.5 F1
Figure 10. Multiple Correspondence analysis. Factorial Plan F1,F7
Figure available in the original PDF paper.
CONCLUSIONS
Fourteen body measurements of Portuguese university students were summarized in this paper and they enabled the anthropometric characterization of the Portuguese student population of FEUP.
The results show that none of the chairs are adequate for the user population. However, one of the analyzed chairs (C4), with its adjustability, has characteristics that allow it to better adjust to the students’ needs. With a seat with a lesser depth would be adequate to most of the students.
Seat Height and Seat to Desk Height, were found the furniture dimensions with a higher level of mismatch, which may result in discomfort and pain on the posterior surface of the knee and shoulder.
The survey data revealed that the majority of students feel discomfort while using the classroom and computer room furniture, thus validating the results obtained for the mismatch.
The MCA allowed us to conclude that, for 25% of the sample, the male students are the ones with bigger dimen- sions, in general, and the female students have the smaller dimensions.
Also for 7.9% of the sample we were able to conclude that there is an association between the abdominal depth, the thigh thickness and the hip breadth, whether in the smaller or the bigger students.
For a smaller percentage of the sample (3.8%) we concluded that male younger students with average abdominal depth and smaller forward grip reach do not feel discomfort while using the school furniture. On the other hand the older female students with smaller shoulder breadth, average forward grip reach, and higher popliteal height and buttock-popliteal length are the ones that feel more discomfort while using the school furniture.
The results of this study seem to indicate that classroom furniture is usually selected and acquired without due previ- ous ergonomic concern, which often results in its inadequacy.
REFERENCES
Arezes, P. M., Barroso, M. P., Cordeiro, P., Costa, L. G. d., and Miguel, A. S. (2006). “Estudo Antropométrico da População Portuguesa”: ISHST - Instituto para a Segurança, Higiene e Saúde no Trabalho. Barroso, M. P., Arezes, P. M., da Costa, L. G., and Sérgio Miguel, A. (2005). Anthropometric study of Portuguese workers. Inter-
national Journal of Industrial Ergonomics, 35(5), 401-410. Benzécri, J. P. (1973). “L'analyse des données: L'analyse des correspondances”: Dunod. Burt, C. (1950). The Factorial Analysis of Qualitative Data. British Journal of Statistical Psychology, 3(3), 166-185. doi: 10.1111/j.2044-8317.1950.tb00296.x Castellucci, H. I., Arezes, P. M., and Viviani, C. A. (2010). Mismatch between classroom furniture and anthropometric measures
in Chilean schools. Applied Ergonomics, 41, 563 - 568.
Ergonomics In Design, Usability & Special Populations I (2022)
Chuan, T. K., Hartono, M., and Kumar, N. (2010). Anthropometry of the Singaporean and Indonesian populations. International Journal of Industrial Ergonomics, 40(6), 757-766. Corlett, E. N. (2006). Background to sitting at work: research-based requirements for the design of work seats. Ergonomics,
49(14), 1538-1546. Dianat, I., Karimi, M. A., Hashemi, A. A., and Bahrampour, S. (2013). Classroom furniture and anthropometric characteristics of Iranian high school students: Proposed dimensions based on anthropometric data. Applied Ergonomics, 44(1), 101-108. Geldhof, E., Clercq, D. D., Bourdeaudhuij, I. D., and Cardon, G. (2007). Classroom postures of 8–12 year old children. Er -
gonomics, 50(10), 1571-1581. Gouvali, M. K., and Boudolos, K. (2006). Match between school furniture dimensions and children's anthropometry. Applied Ergonomics, 37(6), 765-773. ISO. (2008). ISO 7250-1:2008 Basic human body measurements for technological design -- Part 1: Body measurement defini-
tions and landmarks. International Organization for Standardization, Geneva, Switzerland. Kaya, M. D., Hasiloglu, A. S., Bayramoglu, M., Yesilyurt, H., and Ozok, A. F. (2003). A new approach to estimate anthropometric measurements by adaptive neuro-fuzzy inference system. International Journal of Industrial Ergonomics, 32(2), 105- 114. Koskelo, R., Vuorikari, K., and Hänninen, O. (2007). Sitting and standing postures are corrected by adjustable furniture with
lowered muscle tension in high-school students. Ergonomics, 50(10), 1643-1656. Lebart, L. (1975). “L'orientation du dépouillement de certaines enquêtes par l'analyse des correspondances multiples” Consommation (pp. 73-96): Dunod. Macedo, A., Martins, H., Santos, J., Morais, A., Brito, A., and Mayan, O. (2013). “Conformity between Classroom Furniture and
Portuguese Students’ Anthropometry: A Case Study”. Paper presented at the International Symposium on Occupational Safety and Hygiene, Guimarães - Portugal. Mokdad, M., and Al-Ansari, M. (2009). Anthropometrics for the design of Bahraini school furniture. International Journal of Industrial Ergonomics, 39(5), 728-735. Padez, C. (2002). Stature and stature distribution in Portuguese male adults 1904–1998: The role of environmental factors. Amer-
ican Journal of Human Biology, 14(1), 39-49. doi: 10.1002/ajhb.10017 Panagiotopoulou, G., Christoulas, K., Papanckolaou, A., and Mandroukas, K. (2004). Classroom furniture dimensions and anthropometric measures in primary school. Applied Ergonomics, 35(2), 121-128. Parcells, C., Stommel, M., and Hubbard, R. P. (1999). Mismatch of classroom furniture and student body dimensions: Empirical
findings and health implications. The Journal of adolescent health : official publication of the Society for Adolescent Medicine, 24(4), 265-273. Pheasant, S., and Haslegrave, C. M. (2006). “Bodyspace: Anthropometry, Ergonomics, And The Design Of Work”: Taylor & Francis Group. Straker, L., Pollock, C., and Burgess-Limerick, R. (2006). Excerpts from CybErg 2005 discussion on preliminary guidelines for
wise use of computers by children. International Journal of Industrial Ergonomics, 36(12), 1089-1095. Thariq, M. G. M., Munasinghe, H. P., and Abeysekara, J. D. (2010). Designing chairs with mounted desktop for university students: Ergonomics and comfort. International Journal of Industrial Ergonomics, 40(1), 8-18.
Ergonomics In Design, Usability & Special Populations I (2022)
LISTED IN THE AHFE DIGITAL BOOKSTORE CATALOGUE
Explore the complete digital volume
Advances in Ergonomics In Design, Usability & Special Populations: Part I
Read this individual research paper free through the original publisher, or explore the full digital proceedings book.
ISBN 978-1-4951-2106-7
Explore this ISBN in the AHFE Bookstore ↗Listed in the July 2026 bookstore catalogue; search by ISBN to confirm current availability · Digital book purchase optional