Lara Reisab, Emília Duartec, Francisco Rebeloab (2022). Evaluation of an Experimental Virtual Environment Prototype for Older Population Warning Studies. In: Advances in Ergonomics In Design, Usability & Special Populations: Part I. AHFE Open Access, vol. 18. https://doi.org/10.54941/ahfe100823
Over the years, different types of Virtual Environment (VE) systems have become commercially available, thereby giving rise to several types of human performance studies. However, in the field of safety communications, VE usability knowledge regarding older populations is scarce. In this context, this paper discusses the main findings gathered regarding a pilot study which aimed to assess usability issues associated to an experimental VE prototype. Such a VE was designed for conducting ergonomic studies with older populations (50-70 years old) and safety warnings. The nature of both this study, and its sample, is justified by the fact that, as one grows older, the ability to interact and comply with warnings, as well as technology, is adversely affected by several perceptual and/or cognitive deficits. Based on such facts, the present study sought to understand if the VE prototype’s system set-up could be successfully used by older populations. In order to undergo such an evaluation, such a study composed of two key moments: to examine if older users could perform certain interactions inside the VE; and to analyze whether they could perceive the VE´s graphical information. The study’s results provide important insights that may enhance VE interaction and warnings design research.
This paper presents the definition and results of a pilot study which was carried out to evaluate usability issues regarding an experimental Virtual Environment (VE) prototype that was specifically designed for conducting ergonomic studies with older populations/ users (i.e., 50 to 70 years old) and safety warnings. Topics such as, VE navigation, the visibility/ legibility/ readability/ perception of graphical VE information, and VE simulator sickness, were addressed.
Such a study was developed within the scope of a larger research project which proposes to: 1) highlight the use and effectiveness of technology-based safety warnings as inclusive solutions for compensating and/or assisting age- related deficits; as well as 2) promote Virtual Environments (VEs) as feasible research tools for enhancing the field of warning research.
The nature of both this pilot study and its sample, as well as the larger research project, is justified by the fact that, as one grows older, the ability to notice, encode, comprehend, interact and comply with warnings (i.e., relevant safety cues/ signals/ communications placed in the physical environment), as well as technology (e.g., computers and digital/virtual objects, products, scenarios and devices) is adversely affected by several perceptual and/or cognitive deteriorations (e.g., Czaja & Lee, 2007; Mayhorn & Podany, 2006; McLaughlin & Mayhorn, 2014; Rousseau, Lamson, & Rogers, 1998). These include declines in the visual, auditory and cognitive capacities. The most common age-related deficits include, for example: 1) visual modality impairments, such as diminished visual acuity, greater glare sensitivity, reduced ability to perceive colors, decreased contrast sensitivity, temporal resolution deterioration; 2) auditory deficits, such as difficulty in distinguishing between high frequencies, as well as different tones, voices and/or speech sounds in noisy backgrounds; 3) tactile changes, such as reduced capacity to accurately judge force; and 4) cognitive deficits, such as reduced level of visual and situation awareness, decreased visual search, increased attentional distraction, diminished reaction times; among others.
Based on such facts, the present pilot study’s main goal sought to understand if older populations could have an adequate and satisfactory interaction with the VE prototype’s VR system set-up. In order to undergo such an evaluation, such a study composed of two key moments, namely: 1) to examine if older populations/ users could perform certain interactions inside the VE; and 2) to analyze whether they could perceive the VE´s visual and graphical information/ stimuli. When compared to conventional and/or traditional evaluation methods (i.e., ‘pen- and-paper’ or computer format tests), this VE prototype encompasses several advantages for research in the fields of Human Factors and Ergonomics. With an interactive, more engaging and life-like scenery/ setting, it provides the means to: assess the older users’ behavioral and subjective experiences (i.e., level of engagement and state of mind/ well-being); while dynamically modifying, controlling and adapting the system’s technicalities (i.e., different types of interaction tasks, techniques, devices and levels of immersion).
With the advanced development of various complex technologies, different types of VE systems have become commercially available, thereby giving rise to several types of human performance studies. Together with the expansion of such systems and assessments, several usability principles and evaluation methods have emerged to ensure the optimal creation, effectiveness and satisfaction of VEs (e.g., Bowman, Gabbard, & Hix, 2002; Hix & Gabbard, 2002; Wilson, 1999). However, although the applications of VEs in various scientific domains are considerable, in the field of safety communications, VE usability knowledge regarding older populations is scarce and very much in its infancy. The current body of VE warning research raises some concerns when generalizing and applying their principles to real-world problems and users, since the majority of the performed studies used younger adult populations (i.e., mainly university students) and/or specific target groups (e.g., participants with various degrees of cognitive and/or health disabilities/disorders) as research subjects. Furthermore, the few existent studies, which used older age groups and VEs, highlight important performance differences when compared to younger adults, as well as report the occurrence of some Virtual Reality Induced Symptoms and Effects (VRISE) ( e.g., Liu, 2009; Moffat, Zonderman, & Resnick, 2001; Nichols & Patel, 2002).
Therefore, in order to assess the feasibility of using a VE for conducting warning research with older populations/ users, the current study structured and founded its evaluation under one of the main VE usability taxonomies, which research has identified as the Behavioral Domain (e.g., Gabbard, Hix, & Swan, 1999). In other words, the way the users view/ visualize, feel, communicate, behave and interact with the VE’s system interface (i.e., all icons, texts, graphics, devices, locomotion, etc.). Consequently, based on the existing literature (e.g. Bowman, Johnson, & Hodges, 1999; Gabbard, 1997; Stanney, Mollaghasemi, Reeves, Breaux, & Graeber, 2003), the present pilot study’s usability evaluation was two-folded: 1) on the one hand, a VE system analysis was performed to ensure that the older users could interact with the VE prototype’s physical, technological and/or constructional components; and 2) on the other hand, a VE user analysis was conducted to certify that the older users’ capacities (i.e., perceptual, cognitive and motor skills), well-being and safety were duly accounted for.
EXPERIMENTAL APPROACH Participants
The study used a sample of six adult volunteers, aged between 50 to 70 years old (Mean Age = 58.2, SD = 4.34). Of these, 3 were men (Mean Age = 56.7, SD = 1.89) and 3 were women (Mean Age = 59.7, SD = 1.89). Upon arrival to the laboratory, the participants were asked to fill in a consent form and were screened for color vision deficiencies, using the Ishihara Test (Ishihara, 1988). In conclusion, none of the participants reported mental/ physical conditions nor color limitations which could prevent them from participating in the study. In addition, participants filled in a demographic questionnaire. The most significant data gathered from this questionnaire was: 1) all participants reported that they used corrective lenses (i.e., they had a corrected 20/20 vision) to watch TV/ movies, work on the computer and/or read books/ magazines; 2) that they had had some experience with computer/ videogames (i.e., they played sporadically); and 3) that none of them had ever used the experiment’s interaction equipment/ devices before.
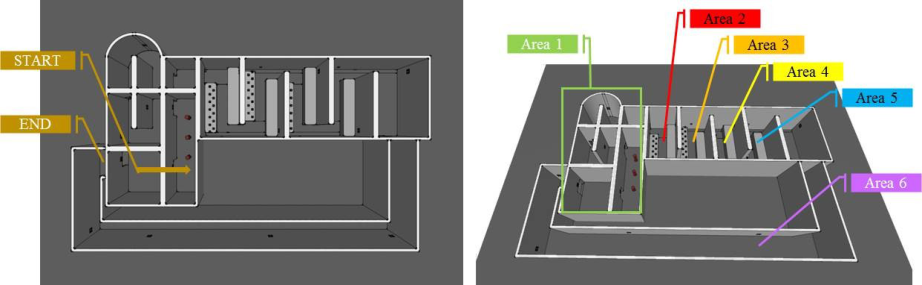
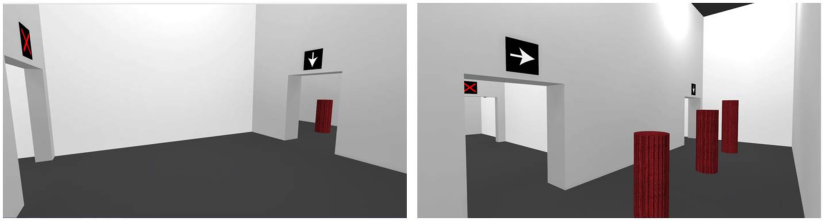
Figure 1. On the left, the VE prototype’s layout/ floor plan. On the right, the VE’s main areas.Figure 2. Screen shots of Area 1 of the VE. On the left, the starting point. On the right, the column section.
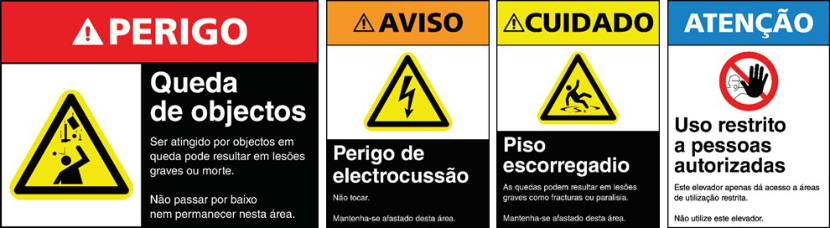
(c) VE Safety warnings/ signs Static ANSI-ISO-type safety warnings/ signs, with distinct typographic and pictorial sizes, were placed as stimuli on the VE’s walls (see Figure 3), in four separate and consecutive areas, namely Areas 2 to 5 (see Figure 1).
Figure 3. The four ANSI-ISO-type safety warnings/ signs placed on the VE’s walls, and which were placed in this specific order, from left to right.
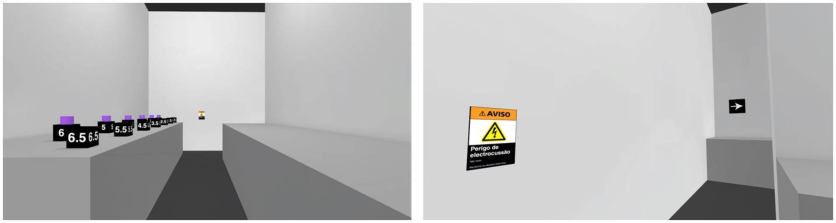
Based on safety standards, such signs were: 1) mounted at eye-height, i.e., their center points were set at 1.53m above the ground; 2) 35.56 x 25.4cm in size; and 3) to be read at a maximum viewing distance of 9m. All warnings were written in Portuguese (see Figures 3 and 4). Each area, in which the safety warnings were placed, had two tables that leant on opposite walls of the VE (see Figure 3). One of the tables had black numbered boxes which served as visual references that were meant to assist the participants’ spatial orientation when performing the experiment’s tasks.
Figure 4. Screen shots depicting one of the safety warning’s/ sign’s placement. On the left, participants’ viewpoint, aligned at the center of the corridor, between the two tables which leant on opposite walls of the VE, and facing the warning. On the right, participants’ viewpoint when exiting Area 4 and entering Area 5.
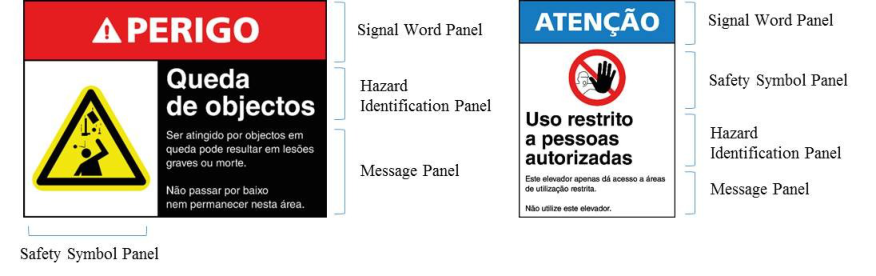
All four warnings comprised of four key visual components, the: 1) Signal Word Panel; 2) Hazard Identification Panel; 3) Safety Symbol Panel; and 4) Message Panel (see Figure 5). Each of these panels consisted of different headings/ texts, with distinct typographic and pictorial sizes, which in turn were to be read at specific viewing distances. Such sizes define the maximum viewing distances for favorable reading conditions, in real-life settings, for users with 20/20 (or corrected 20/20) vision. This particular pilot study sought to confirm whether these distance and size references could also be applied to/ in VEs for older users: 1) Signal Word Panel (SWP), all four signal words/ headings were 3cm in height, and were to be perceived/ read at a maximum viewing distance of 9m; 2) Hazard Identification Panel (HIP), the four secondary headings were 1.73cm in height, and were to be perceived/ read at a maximum viewing distance of 6m; 3) Safety Symbol Panel (SSP), the four safety pictorials varied between 9.29cm and 12.4cm in height (in light of the quantity of information/ text that needed to be included), and their contents were to be perceived/ read at a maximum viewing distance of 5m; and 4) Message Panel (MP), the four smaller texts were 0.71cm in height, and were to be perceived/ read at a maximum viewing distance of 2m.
Figure 5. Safety warnings’/ signs’ layout and visual components.
Evaluation framework (a) VE system analysis – Tasks and measurements
The present pilot study composed of two system usability testbeds, using the same experimental VE prototype, in order to evaluate a set of specific tasks which, in turn, measured the older users’ behavioral performance according to different VE interaction techniques.
The first testbed was designed to determine the older users’ dexterity in using/ manipulating/ controlling the VE prototype’s VR system devices/ equipment (i.e., the gamepad). In order to evaluate this ability, participants were required to learn how to travel/ move/ navigate from one location to another, while simultaneously changing their viewpoint, inside the VE. This VE interaction performance was measured by: 1) Number of Collisions (C), the number of times the participants collided with obstacles present in the VE; 2) Area duration (A), the amount of time the participants spent per area, to complete the different tasks defined for the experiment; and 3) Experimental Session duration (ES), the total amount of time the participants spent to complete each of the experiment’s sessions. It was assumed that the less number of times the participants collided with the VE’s obstacles (e.g., walls, columns and tables), the less amount of time they spent in carrying out the tasks, as well as in finishing the experiment’s sessions, the better their performance/ interaction. In other words, such measurements were interpreted as a clear indication that the participants had acquired the necessary skills/ dexterity to simulate a natural and fluid movement inside the VE, as well as to navigate efficiently throughout its different areas.
The second testbed was designed to evaluate whether the same older users’ capacity to see/ identify different types of objects and visual elements, with distinct typographic and pictorial sizes, present in the VE. Participants were then required to perform a series of target identification tasks, namely, to detect and discern at what distances they could perceive/ read each of the safety warnings’ individual visual components (see Figure 4). This VE interaction performance was measured by: 1) Signal Word Panel distance (SWP), the distance at which participants could perceive/ read the safety warnings’ main heading; 2) Hazard Identification Panel distance (HIP), the distance at which participants could perceive/ read the safety warnings’ secondary heading, which identified the hazard/ risk; 3) Safety Symbol Panel distance (SSP), the distance at which participants could perceive/ read the safety warnings’ pictorial icons’ contents, which depicts the hazard/ risk; 4) Message Panel distance (MP), the distance at which participants could perceive/ read the safety warnings’ smaller text describing the consequences and the correct course of action; and 5) Preferred Reading distance (PR), the distance at which participants could perceive/ read all of the safety warnings’ information comfortably, without any image distortion. For this second testbed, the study sought to confirm whether the safety warnings’ maximum viewing distances and typographic sizes, for favorable real-life reading conditions, as well as for older users who had a 20/20 (or corrected 20/20) vision, could also be applied to/ in VEs, this is: 1) 9m to perceive/ read the SWP; 2) 6m to perceive/ read the HIP; 3) 5m to perceive/ read the SSP; and 4) 2m to perceive/ read the MP. Since the VE prototype’s system set-up had certain constraints (just like any VR system set-up) regarding its image projection (i.e., it has a limited resolution/ pixel capacity, which therefore distorted specific details of the VE), a last and more subjective reading distance was defined in order to assess at what distance was the safety warnings’ images clear and legible/ readable for the older users.
Data from both testbeds were collected with the VE prototype’s log system, which automatically recorded the above measurements, in real time. This is, it recorded the participants’ every movement inside the VE, by registering its coordinates (i.e., its position in relation to the x, y and z axis) at an average of 60Hz. As for the distances, these were calculated based on the logs that were registered every time the participants pressed the gamepad’s button.
(b) VE user analysis – User experience measurements The present pilot study gathered subjective data regarding the participants’ qualitative perceptions of the experiment, as well as their individual characteristics. Such data served to assess the VE prototype’s quality in providing the participants with an engaging and pleasurable experience. Therefore, to undergo such an evaluation, the following methods were applied:
1. Observation and Audio-Recording: for technical and methodological reasons, the first author was present, inside the laboratory, and close to the participant, during the entire experiment’s procedure. Such a methodological set-up provided the researcher with the means to: 1) observe and accompany the participants’ experiences; 2) gather subjective reactions, opinions and insights on how they viewed/ visualized, felt, behaved and interacted with the VE prototype; and 3) instruct the participants, in real-time, on what tasks and techniques to perform inside the VE. Consequently, the participants were told to verbalize any difficulties they encountered.
2. Simulator Sickness Questionnaire: in order to certify that the participants were comfortable, as well as free of any pain or sickness, during and after the experimental sessions, the Simulator Sickness Questionnaire (SSQ), as defined by Kennedy, Lane, Berbaum, and Lilienthal (1993), was applied twice in the course of the experiment’s procedure. Such a questionnaire intended to evaluate the occurrence of any VRISE both during (referred to as side-effects) and post (i.e., after-effects) the VE simulation/ exposure. The questionnaire asked participants to score 16 symptoms on a four-point scale (from none, to severe), which fell under three general categories: ocular/ visual disturbances, disorientation, and nausea.
3. Demographic Questionnaire: the participants filled in a demographic questionnaire which served to collect data regarding their individual characteristics, namely their age, sex, use of corrective lenses, experience with computer/ videogames, among others.
4. Interaction Quality of the VE Questionnaire: to assess the VE prototype’s usability (i.e., its ease of use and learnability), this questionnaire was applied to collect the participants’ subjective perceptions regarding their ability/ capacity to control their movement/ interaction and perform inside the VE. This questionnaire asked the participants to score the quality of their VE experience according to the following categories: 1) Ease of Navigation: ‘How easily could you navigate or dislocate/ move inside the VE (e.g., how easy was it for you to get to a certain point in the VE)?’; 2) Navigation Control: ‘To what degree could you control your navigation or displacement/ movement inside the VE (e.g., how accurately could you position and/or stop yourself at the desired place)?’; 3) Vision Naturality: ‘How natural would you classify the system’s vision behavior (e.g., how easy was it for you to look at different objects and/or obstacles inside the VE)?’; 4) Viewpoint Control: ‘To what degree could you control your viewpoint (e.g., how easy was it for you to accurately move your head to a certain direction inside the VE)?’; and 5) VE Performance: ‘How would you classify your overall performance inside the VE?’. Such questions were ranked using a 7-point scale (which ranged from very difficult/ low/ poor, to average/ moderate, and very easy/ high/ good), and adapted from Witmer and Singer's (1998) Presence Questionnaire.
5. Visual Quality of the VE Questionnaire: to evaluate the VE prototype’s graphical and pictorial features, this questionnaire was applied to collect the participants’ subjective perceptions regarding their ability/ capacity to perceive/ identify different types of visual information present in the VE. Participants were asked to score the prototype’s visual quality according to three categories: 1) Object Identification: ‘To what degree could you identify the different objects and obstacles present in the VE (e.g., columns, pathways, wall, tables)?’; 2) Sign Visibility: ‘To what degree could you locate and follow the signs present in the VE (e.g., the way-finding arrows)?’; and 3) Warning Perception: ‘To what degree could you perceive/ read the safety warnings’ contents, present in the VE?’. Such questions were ranked using a 7-point scale (which ranged from very difficult, to average/ moderate, and very easy), and adapted from Witmer and Singer's (1998) Presence Questionnaire.
Procedure The study’s experiment was divided into 5 major phases: 1) introduction to the study; 2) first experimental session; 3) first post-hoc questionnaire; 4) second experimental session; and 5) second post-hoc questionnaire. The whole procedure lasted approximately 45min in total.
(a) Introduction to the study phase: after signing the consent form and completing the color deficiency detection, the participants were given a brief explanation about the study and its different phases (i.e., they were told that the study’s main objective was to validate a new VR software, which was being developed at the laboratory; thus, they were unaware of the study’s real objective) and were introduced to its VR system set-up.
(b) First experimental session: the first experimental session was divided into two key moments: 1) a training period, in which the participants practiced using the system’s equipment/ device (i.e., gamepad), as well as learnt how to interact inside the VE; and 2) a second moment in which the participants were asked to identify/ read the VE’s visual and graphical stimuli. The experiment begins in Area 1 (see Figures 1 and 2), where the participants were given instructions on how to use the gamepad and practiced how to move from one place to another. They were asked to explore this area freely, until they felt that they were able to control their movement. Once the participants verbally stated that they felt at ease to continue with the rest of the exercises, they were instructed to enter the subsequent section of Area 1, with the columns (see Figure 2). In this part of the VE, participants were asked to perform a chicane task around the columns, i.e., they were asked to circulate, in an s-shaped manner, around the three columns. They were told to perform this task twice, as quickly and efficiently as they could, i.e., they were told to avoid colliding with the VE’s columns and walls, as well as pausing/ interrupting their movement. Upon completing this task, they were then instructed to continue to move through the environment until they reached Area 2, where the second moment of this session was to take place. In Area 2, participants were asked to position themselves in the center of the corridor (between the two tables which leant on opposite walls of the VE), then align their ‘bodies’ with the first black box (numbered 6.5), and face the safety warning at the end of the corridor (see Figure 4 for an example). At this distance, participants were asked to describe what they could see/ read, i.e., they described the warning’s overall composition/ layout. Subsequently, they were then told to move forward, slowly, until they could discriminate/ perceive another of the warning’s elements. When the participants could read/ decipher another of the warning’s visual features, they were asked to stop/ pause their movement and press the gamepad’s button. These actions were then repeated until the participants could distinguish each of the warning’s key components (i.e., signal word; hazard identification heading; safety symbol; and the smaller text message). When all of the warning’s primary parts were identified, the participants were asked to position themselves at the distance at which they could perceive/ read all of the safety warnings’ information comfortably, without any image distortion (i.e., the preferred reading distance). After having established this last position, the participants were told to press, once again, the gamepad’s button. After completing this first visual exercise, the participants were told to leave Area 2 and enter Area 3. From Areas 3 to 5, the participants repeated the process for each of the remaining safety warnings. When all three warnings were evaluated, they were then instructed to continue to move through the environment until they passed Area 6 and then reached the end of the VE, which subsequently terminated this first experimental session.
(c) First post-hoc/ follow-up questionnaire phase: after completing the first experimental session, the participants had a 5min break and then filled out the Simulator Sickness Questionnaire, to check for any preliminary indications of VRISE, and the Demographic Questionnaire, to collect data regarding their individual characteristics.
(c) Second experimental session: with the same VE prototype, in the second experimental session participants had to repeat the same path they had done in the former session. However, in this session, they were told not to repeat the whole process of identifying each of the warnings’ elements, nor press the gamepad’s buttons. They were told to circulate through these areas, as efficiently as they could, and most importantly, to simulate a natural and fluid movement, avoiding at all costs, collisions with the VE’s obstacles, as well as pauses. The main reason behind this approach was to evaluate whether the participants’ interaction and dexterity in using the system’s devices/ equipment had improved in comparison to their performance in the first experimental session.
(d) Second post-hoc/ follow-up questionnaire phase:at the end of the second experimental session, the participants had another 5min break and then filled out three questionnaires, namely the: 1) Simulator Sickness Questionnaire, once again, to assess if there was an increase in VRISE, due to having been exposed twice to the simulation, and over a time period of approximately 30min.; 2) Interaction Quality of the VE Questionnaire, to evaluate the VE prototype’s usability; and 3) Visual Quality of the VE Questionnaire, to analyze the prototype’s information quality.
RESULTS
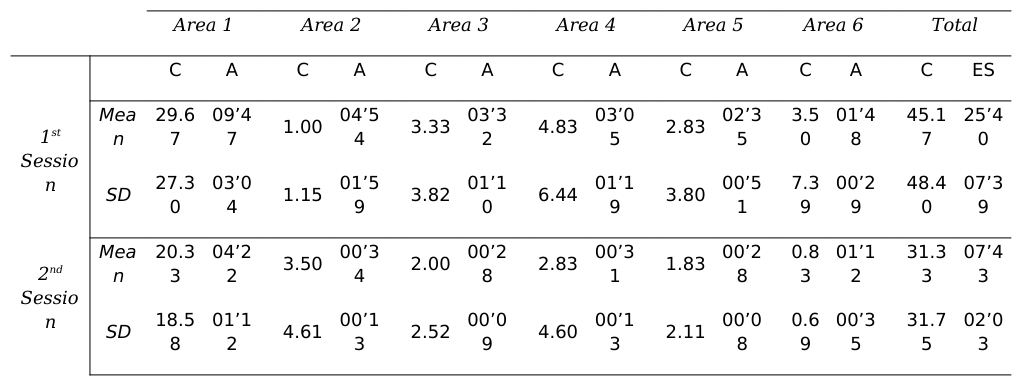
Discussion of the first testbed’s findings For the first testbed, the following measurements were obtained for each of the experiment’s sessions: 1) Number of Collisions (C); 2) Area duration (A); and 3) Experimental Session duration (ES). Descriptive statistics for such measures, for both experimental sessions, are depicted in Table 1 and explained below:
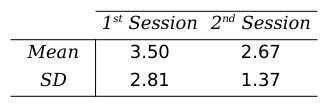
Table 1: Descriptive statistics (Mean and Standard Deviation values) regarding the first testbed’s overall measurements, for both experimental sessions.Table 2. Descriptive statistics (Mean and Standard Deviation values) of the first testbed’s measurements, for both experimental sessions, regarding the number of times participants collided with the VE’s columns, when performing the chicane task in Area 1.
As shown in Table 1, differences across all measures (i.e., Number of Collisions (C); Area duration (A); and Experimental Session duration (ES)), were found for both experimental sessions. However, since each session differed in the instructions provided to the participants, as well as in the number and type of tasks/ exercises, a direct comparison between both sessions, regarding the three types of measurements, cannot be done. Nevertheless, since the conditions regarding the Travel tasks/ techniques in Areas 1 and 6 were the same, for both experimental sessions, such interactions/ performances can be compared. These results concerning only the two common denominators, i.e., Number of Collisions (C) and Area duration (A), are presented in the subsequent section.
1. Number of Collisions (C): in the first experimental session, the participants collided with the VE’s different obstacles (i.e., walls, columns and tables) in Area 1, in average, 29.67 times; whereas, in the second session, they collided, in average, 20.33 times. Among these impacts, Table 2 demonstrates that an average of 3.50 collisions was accounted for the number of times the participants collided with the VE’s columns, while performing the chicane task, in the first session; and an average of 2.67 times in the second session. In Area 6, the participants collided, in average, 3.50 times in the first session; while, in the second session, they collided, in average, 0.83 times.
2. Area duration (A): in the first experimental session, the participants spent, in average, 9min and 47s to complete the defined tasks in Area 1; whereas, in the second session, they spent, in average, 4min and 22s. In what concerns Area 6, the participants spent, in average, 1min and 48s to pass through it, in the first experimental session; and in the second session they spent, in average, 1min and 12s.
Such results reveal that there were significant differences between the two experimental sessions, for both areas. This is, in the second experimental session, the older participants had: 1) collided less with the VE’s obstacles, in both areas; as well as 2) spent less time to complete the different tasks, in both areas. By comparing the two session’s data, in both areas, one can conclude that the participants had better executed each of the area’s specific tasks, in the second experimental session. In what regards the Number of Collisions (C), one can infer that from one session and area to another, as well as between areas, the participants had learnt how to interact inside the VE, as well as had acquired the necessary skill/ ability to manipulate/ control/ use the VE prototype’s system devices/ equipment (i.e., gamepad).
Discussion of the second testbed’s findings For the second testbed, the distances at which the participants could perceive/ read each of the four safety warnings’/ signs’ individual visual components were calculated. Such distances included the: 1) Signal Word Panel distance (SWP); 2) Safety Symbol Panel distance (SSP); 3) Hazard Identification Panel distance (HIP); 4) Message Panel distance (MP); and 5) Preferred Reading distance (PR). Statistics for such distances are depicted in Tables 3 and 4.
Table 3. Descriptive statistics (Mean and Standard Deviation values) of the second testbed’s measurements, regarding the viewing distances for each of the safety warnings’/ signs’, as well as for each individual visual component.
Table available in the original PDF paper.
Warning ‘PERIGO’ Warning ‘AVISO’
SWP HIP SSP MP PR SWP HIP SSP MP PR Mean 4.15m 3.07m 2.65m 1.99m 1.83m 4.55m 2.87m 2.91m 1.17m 1.00m
Table 4. Descriptive statistics (Mean and Standard Deviation values) regarding the safety warnings’/ signs’ overall viewing distances, for each of the four key visual components, plus the preferred reading distance.
Table available in the original PDF paper.
SWP HIP SSP MP PR Mean 4.53m 3.06m 2.62m 1.59m 1.43m SD 0.18m 0.14m 0.19m 0.07m 0.03m
As shown in Tables 3 and 4, the viewing distances at which the older participants could perceive/ read each of the safety warnings’ individual visual components (which had distinct typographic sizes) inside the VE, were not the same as those defined for favorable real-life reading conditions. Such results reveal that there are significant differences between the standard and real-life viewing settings, and the viewing/ reading distances regarding this particular VE prototype. This is, inside the VE, each graphical component was viewed at closer distances: 1) Signal Word Panel (SWP), all four signal words/ headings, which were 3cm in height, were perceived/ read at an average viewing distance of 4.53m, instead of at a maximum viewing distance of 9m; 2) Hazard Identification Panel (HIP), the four secondary headings, which were 1.73cm in height, were perceived/ read at an average viewing distance of 3.06m, instead of at a maximum viewing distance of 6m; 3) Safety Symbol Panel (SSP), the four safety pictorials, which varied between 9.29cm and 12.4cm in height, were perceived/ read at an average viewing distance of 2.62m, instead of at a maximum viewing distance of 5m; and 4) Message Panel (MP), the four smaller texts, which were 0.71cm in height, were perceived/ read at an average viewing distance of 1.59m, instead of at a maximum viewing distance of 2m.
By analyzing the more subjective distances the participants selected, i.e., the Preferred Reading distances (PR), it becomes clear that the visibility/ legibility/ readability of safety warnings/ signs, placed inside this particular VE prototype’s experimental system set-up was limited. In light of this fact, one can infer that the prototype’s system resolution/ pixel capacity, as well as its simulation engine, may have limited the quality of the image’s projection, and thereby, distorted specific details of the VE. Therefore, one can only assume that such image distortions made it harder for participants, at a certain age, to read/ decipher different types of graphical information, with distinct typographical sizes, from farther distances.
Discussion of user experience findings As for the study’s more qualitative and subjective measures, the most important qualitative data was gathered with the following questionnaires:
1. Simulator Sickness Questionnaire (SSQ): the results from both SSQs (applied at the end of each experimental session) reveal that there were no occurrences of ocular/ visual disturbances, disorientation, and nausea, both during, nor after the experiment. However, in what concerns the Experimental Sessions Duration (ES), as shown in Table 1, one can infer that even after a lengthy (i.e., 25.40min in average, in the first session; plus 7.43min in average, in the latter session; which therefore sums up to a total average of 33.23min) exposure to the VE, the experimental prototype’s design (i.e., the study’s system set-up, VE layout/ floor plan, and procedure) did not cause any discomfort or harm among the older participants.
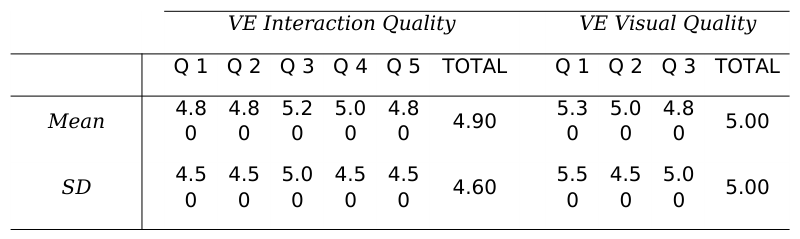
2. Interaction Quality of the VE Questionnaire: as depicted in Table 5, all five inquiries (which evaluated the VE’s Ease of Navigation; Navigation Control; Vision Naturality; Viewpoint Control; and VE Performance levels) attained an average rating of 4.90 (SD = 4.60). Thus, one can conclude that the participants’ scored their ability/ capacity to control their movement/ interaction and performance, inside the VE, as ‘average/ moderate’.
3. Visual Quality of the VE Questionnaire: as shown in Table 5, all three questions (which assessed the VE’s Object Identification, Sign Visibility, and Warning Perception levels) scored an average rating of 5.00 (SD = 5.00). Consequently, one can assume that the participants’ scored their ability/ capacity to perceive/ identify different types of visual information, present in the VE, as ‘average/ moderate’.
Table 5. Descriptive statistics (Mean and Standard Deviation values) regarding the study’s Interaction Quality of the VE
Questionnaire, and Visual Quality of the VE Questionnaire.
CONCLUSION
This paper presents the structure and results of a pilot study which aimed to assess usability matters concerning an experimental VE prototype that was explicitly designed for undergoing ergonomic studies with older populations/ users (i.e., 50 to 70 years old) and safety warnings. Such a pilot study sought to understand if these older populations could have an adequate and satisfactory interaction with the proposed VE prototype’s VR system set-up. In order to conduct such an evaluation, such a study composed of two key moments/ objectives, namely: 1) to examine if older populations/ users could perform certain interactions inside the VE; and 2) to analyze whether they could perceive the VE´s visual and graphical information/ stimuli. Consequently, two system usability testbeds were performed, as well as four qualitative and subjective questionnaires were applied.
By analyzing the study’s results regarding the first system usability testbed, which pursued to determine whether older users could perform certain interactions inside the experimental VE, as well as to determine their dexterity in using the VE prototype’s VR system devices/ equipment (i.e., the gamepad), one can conclude that, in general, the older participants were able to successfully interact with the experimental VE, as well as its system’s set-up. By comparing data between sessions, one can infer that in the first experimental session, the participants were unfamiliar with the VE prototype’s VR system devices/ equipment (i.e., the gamepad) and for that reason, collided more often with the VE’s obstacles and spent more time to complete the different tasks. Since there were significant differences (i.e., decreases across the testbed’s three main measurements) between the experiment’s sessions, one can observe that from one session to the other, and in-between sessions, the older participants had learnt/ trained how to interact with the VE, as well as had acquired the necessary skill/ ability to manipulate/ control/ use the gamepad and to perform the given tasks.
In light of the study’s second system usability testbed, which sought to evaluate whether older participants could see/ perceive the experimental VE prototype’s graphical information, one can conclude that, in general, the older participants were able to successfully perceive/ read different types of visual stimuli, with distinct typographic sizes, in the VE. However, in what concerns the viewing distances at which the participants could discern/ read each of the safety warnings’ individual visual components, it becomes clear that the standard safety criteria, established for real- life warnings/ signs, cannot be applied in/ to VEs which have the same specifications and system set-up as this study’s experimental prototype. Nevertheless, by evaluating the viewing distances registered for each of the warnings’ elements, one can gather important insights that may enhance VE interaction and warnings design research, i.e., such distances highlight which of the warnings’ features/ characteristics, as well as typographic sizes, can be easily read/ seen/ identified by older users.
In what concerns the study’s user experience measurements, which pursued to assess the older participants’ reactions, opinions and insights on how they had viewed/ visualized, felt, behaved and interacted inside the experimental VE, one can conclude that such a study provided its users with a sickness-free and an above-average experience. This is, it can be inferred that overall, the older participants: 1) found the VE prototype’s system set-up fairly easy to learn, control and use, as well as they believed to have mastered the necessary skills/ abilities to perform inside the VE; and 2) that its graphical and pictorial information was easily perceived/ identified/ read.
In short, such a study concludes that older populations can have an adequate and satisfactory interaction with the proposed VE prototype’s VR system set-up. The attained results, across all measures, indicate that, overall, the older participants were able to perform certain interactions inside the experimental VE, as well as were able to perceive the VE’s visual and graphical information/ stimuli.
When compared to conventional and/or traditional evaluation methods (i.e., ‘pen-and-paper’ or computer format tests), the potential benefits of such a VE prototype, particularly for the purpose of studying older population warning interaction, are manifold: it provides the means to simulate interactive and quasi-real scenarios (i.e., in which hazardous situations can be studied in a safely manner) with an enhanced control, as well as ecological validity over the experimental conditions.
In light of the larger research project, which proposes to highlight the use of technology-based warnings for compensating and/or assisting age-related deficits, future work will be dedicated to the definition of more effective and inclusive VE criteria measures for warning interaction studies. Given the lack of such usability standards for this area of research, such a project seeks to design and implement a number of VE systems, and subsequently evaluate the impact of using different interaction techniques and devices, as well as levels of engagement have on older population performances. Since such an analysis has not yet been conducted, we hope to create a body of work which will promote VEs as feasible research tools for enhancing the field of warning research and inclusive design.
ACKNOWLEDGEMENTS
A Ph.D. scholarship (SFRH/BD/79622/2011) granted to Lara Reis, from FCT: Fundação para a Ciência e Tecnologia (the Portuguese Science Foundation), supported this study.
REFERENCES
Bowman, D. A., Gabbard, J. L., & Hix, D. (2002). A Survey of Usability Evaluation in Virtual Environments : Classification and Comparison of Methods 1 Introduction and motivation 2 Distinctive characteristics of VE evaluation, 11(4), 404–424. Bowman, D. A., Johnson, D. B., & Hodges, L. F. (1999). Testbed evaluation of virtual environment interaction techniques.
Presence: Teleoperators and Virtual Environments, 10, 26–33. Retrieved from http://dl.acm.org/citation.cfm?id=323667 Czaja, S. J., & Lee, C. (2007). The impact of aging on access to technology. Universal Access in the Information Society, 5(4), 341–349. doi:10.1007/s10209-006-0060-x Gabbard, J. L. (1997). A Taxonomy of Usability Characteristics in Virtual Environments. Faculty of the Virginia Polytechnic
Institute and State University. Retrieved from http://scholar.lib.vt.edu/theses/available/etd-111697-121737/ Gabbard, J. L., Hix, D., & Swan, J. E. (1999). User-Centered Design and Evaluation of Virtual Environments. Computer Graphics and Applications, IEEE, 19(November), 51–59. doi:10.1109/38.799740 Hix, D., & Gabbard, J. (2002). Usability engineering of virtual environments. In K. Stanney (Ed.), Handbook of virtual
environments: Design, Implementation and Applications (pp. 681–699). Mahwah: Lawrence Erlbaum Associates. Retrieved from http://people.cs.vt.edu/jgabbard/publications/hvet02.pdf Ishihara, S. (1988). Test for Colour-Blindness (38th ed.). Tokyo: Kanehara & Co., Ltd. Kennedy, R. S., Lane, N. E., Berbaum, K. S., & Lilienthal, M. G. (1993). Simulator Sickness Questionnaire: An Enhanced Method for Quantifying Simulator Sickness. The International Journal of Aviation Psychology, 3(3), 203–220. Liu, C.-L. (2009). A Neuro-Fuzzy Warning System for Combating Cybersickness in the Elderly caused by the Virtual
Environment on a TFT-LCD. Applied Ergonomics, 40(3), 316–24. doi:10.1016/j.apergo.2008.12.001 Mayhorn, C., & Podany, K. (2006). Warnings and Aging: Describing the Receiver Characteristics of Older Adults. In M. S.
Wogalter (Ed.), Handbook of Warnings (pp. 355–361). Mahwah, NJ: Lawrence Erlbaum Associates. Retrieved from http://scholar.google.com/scholar?hl=en&btnG=Search&q=intitle:Warnings+and+aging: +describing+the+reciever+characteristics+of+older+adults#2 McLaughlin, A. C., & Mayhorn, C. B. (2014). Designing effective risk communications for older adults. Safety Science, 61, 59–
65. doi:10.1016/j.ssci.2012.05.002 Moffat, S. D., Zonderman, A. B., & Resnick, S. M. (2001). Age differences in spatial memory in a virtual environment navigation task. Neurobiology of Aging, 22(5), 787–96. Retrieved from http://www.ncbi.nlm.nih.gov/pubmed/11705638 Nichols, S., & Patel, H. (2002). Health and safety implications of virtual reality: a review of empirical evidence. Applied
Ergonomics, 33(3), 251–71. Retrieved from http://www.ncbi.nlm.nih.gov/pubmed/12164509 Rousseau, G. K., Lamson, N. and Rogers, W. A. (1998). Designing warnings to compensate for age-related changes in perceptual and cognitive abilities. Psychology & Marketing, 15(7), 643–662. Stanney, K. M., Mollaghasemi, M., Reeves, L., Breaux, R., & Graeber, D. A. (2003). Usability engineering of virtual
environments (VEs): identifying multiple criteria that drive effective VE system design. International Journal of Human- Computer Studies (Vol. 58, pp. 447–481). doi:10.1016/S1071-5819(03)00015-6 Wilson, J. R. (1999). Virtual environments applications and applied ergonomics. Applied Ergonomics, 30(1), 3–9. Retrieved from http://www.ncbi.nlm.nih.gov/pubmed/10098812 Witmer, B., & Singer, M. (1998). Measuring presence in virtual environments: A presence questionnaire. … : Teleoperators and
Virtual Environments, 7(3), 225–240. Retrieved from http://www.mitpressjournals.org/doi/abs/10.1162/105474698565686
LISTED IN THE AHFE DIGITAL BOOKSTORE CATALOGUE
Explore the complete digital volume
Advances in Ergonomics In Design, Usability & Special Populations: Part I
Read this individual research paper free through the original publisher, or explore the full digital proceedings book.
ISBN 978-1-4951-2106-7
Explore this ISBN in the AHFE Bookstore ↗Listed in the July 2026 bookstore catalogue; search by ISBN to confirm current availability · Digital book purchase optional