Dorian Davis, Olivia Leak, Steven Jiang (2022). Usability Evaluation of Engineering Research Center for Compact Efficient Fluid Power Website. In: Advances in Ergonomics In Design, Usability & Special Populations: Part II. AHFE Open Access, vol. 19. https://doi.org/10.54941/ahfe1001256
This study aims to investigate usability problems of the National Science Foundation engineering research center for compact and efficient fluid power (CCEFP) website and provides design recommendations to improve it. A discounted usability evaluation technique, heuristic evaluation was applied and followed by a usability testing. Usability metrics were then analyzed. Top usability problems were discussed in detail. Findings from this study can help CCEFP improve its effectiveness and efficiency of their website and better serve the fluid power community.
The World Wide Web has grown rapidly over the past 25 years and has significantly impacted how corporations and organizations operate their business. Many of these businesses and organizations have created personal websites as their medium for communication to mediate between customers for information acquisitions and business transactions. Nevertheless, in order for the website to be effective, the customer (user) must be satisfied with their interaction and the capabilities of the site. Research shows that the quality of an interface design is a determining factor for customers to establish trust (Roy, et al., 2001). Yet, usability continues to be a major concern for most websites.
The National Science Foundation engineering research center for compact and efficient fluid power (CCEFP) is comprised of multidisciplinary research groups from seven universities and more than fifty organizations and industries working together to improve the compactness, efficiency and effectiveness of fluid power systems. The website for CCEFP serves as an important dissemination as well as communication tool for the center. Unfortunately, students and faculty reported usability issues with the site and the effectiveness of the website has been affected by those problems. Since CCEFP relies on its website to communicate and share ideas with its researchers, industry partners, and the general public, it is important to improve the website's usability for effective use.
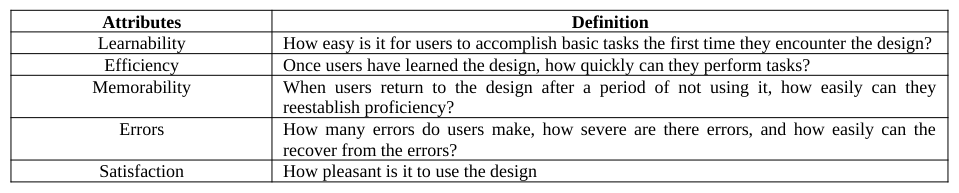
Jakob Nielson defines usability as the “extent to which a product can be used to achieve specified goals” (1993). It answers the basic question: “Are people able to use the product effectively”? To answer this question, there are many attributes designers should consider when addressing usability. In Table 1, Nielson has outlined the five most important quality components usability should be measured by (2003).
Table 1: Nielson Usability Attributes (2012)
Usability is an integral part of the human computer interaction (HCI) profession. HCI is “an interdisciplinary field concerned with the design, evaluation and implementation of interactive computing systems for human use and with the study of major phenomena surrounding them” (Hewett, et al., 1992). In more general terms, HCI studies the way the user interacts with information systems. It addresses usability concerns at the beginning of the design phase. The goal is to produce a functional system that meets the needs of the user (user-centered design) and eliminates any foreseeable frustration the user may experience. The user centered design (UCD) approach has been proven to be imperative in HCI designs. Often UCD is used interchangeably with usability but, Norman and Draper introduced UCD as an approach whereby the design process is centered on the end user of the product or system (1986). The UCD process helps to identify measureable criteria for usability testing (Abras, et al., 2004). Conducting usability tests (evaluation) throughout the design process helps to address concerns that are related to intuitiveness, effectiveness, and efficiency before the product has been released.
There are several evaluation methods to verify the usability of a system. Frequently, during the design phase, UCD is considered at the end of a project. Human factors research has shown that the users’ perspective must be included in the design and development process to achieve effective and efficient results (Adams, 2002). A successful implementation of UCD in HCI has the potential for improving not only functionality and user performance capabilities, but also user satisfaction. One important aspects of the UCD is usability evaluation. In most cases, a usability testing is recommended. In a usability testing, participants are recruited to use the interface to complete a set of tasks and usability problems can be identified through observations and analysis of the performance data. Video recording is a normal trend in usability testing because it allows the investigators to capture the participants’ verbal feedback, behavior and on screen activity. Utilizing this method is great not only because it is cost effective, but it serves as back up notes. It allows for remote usability testing and for investigators to review the recordings in real time to validate observed data or obtain information that was not captured during observation.
Interviews are another way of exploring the user experience during usability evaluations. It can be used to probe more deeply and identify specific user concerns. Interviews allow verbalization data to be obtained quickly without analyzing tapes. In this study, the investigators sought answers to the following questions: (1) what is your purpose for using the website? (2) do you find the website easy to locate desired information? (3) do you have any specific issues with the website?
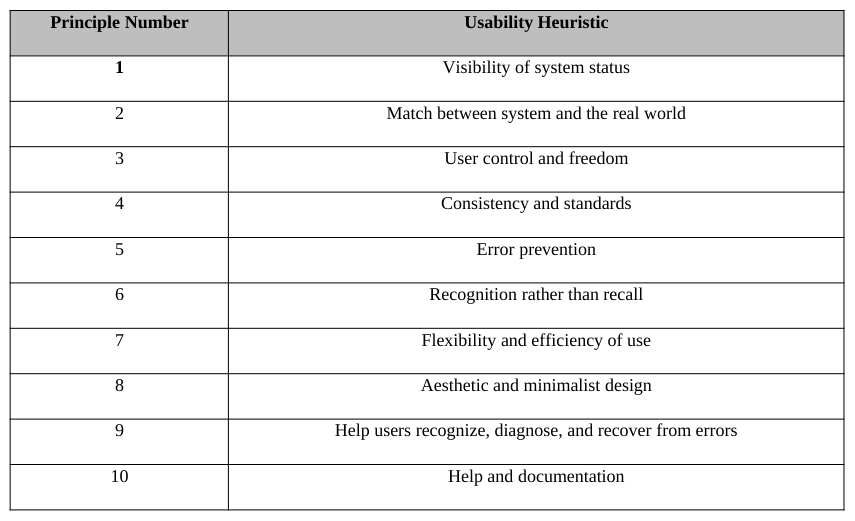
Although usability testing is recommended, it is costly and time consuming. Consequently, designers often end up using techniques such as the heuristic evaluation to identify usability problems and fix the issues. A heuristic evaluation is a discounted usability evaluation technique that is well regarded because of its cost benefit tradeoff, its ease of use and quickness of time. The technique is used to identify and assess usability concerns an interface. Heuristic evaluations are typically carried about by groups of evaluators who may later come together to discuss and share their results. The evaluations are based on a set of ten usability heuristics (Table 2) for user interface design (Nielson, 1994). These principles are the most commonly used usability heuristics for user interface design and outline the common properties shared by usable interfaces. According to Nielsen “the output from using the heuristic evaluation method is a list of usability problems in the interface with references to those usability principles that were violated by the design in each case in the opinion of the evaluator.”(2001). The output from individual evaluators can then be compared to develop a more comprehensive picture of the usability problems found within that interface.
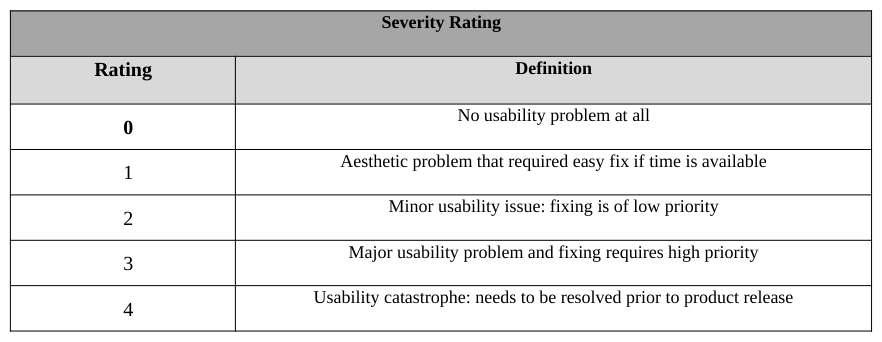
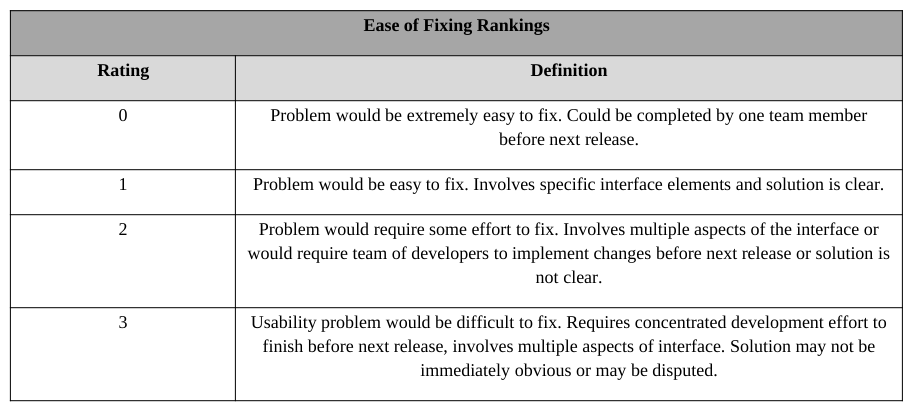
A further component of the process is to rank the problems on a severity rating (Table 3) and ease of fixing rating (Table 4) standard scales. The severity ratings are impacted by the frequency with which the problem occurs; the impact of the problem if it occurs and the persistence of the problem (Nielson 2003). The severity ratings also defined by Nielson use a scale of 0-4 (2003). Olsons’ ease of fixing ratings uses a scale of 0-3 and is based on the level of difficulty for a team member or team to fix the usability problem (2004). The severity and ease of fixing rating enhances the evaluation process by giving evaluators an informed way to communicate the depth of the problem and its impact on usability.
A heuristic evaluation consists of four phases, training, evaluation, rating and debriefing. During the training phase, the participants are taught the heuristic principles as well as the interface and domain to be evaluated. The evaluation phase consists of the participants applying the heuristic principals to identify and describe problems. Next, the evaluators are tasked with rating the severity and ease of fixing for each problem identified. Lastly, during debriefing, the evaluators collectively discuss their findings; determine the most common and most severe problems; and make recommendations for solutions to solving them.
Table 2: Nielsen’s Ten Usability Heuristics (Nielsen, 1994) Principle Number Usability HeuristicTable 3: Severity Ratings for Nielsen’s Ten Usability Heuristics (Nielsen, 2003)Table 4: Ease of Fixing Ratings (Olson, 2004) Ease of Fixing Rankings
This study performed heuristic evaluation and a usability testing to evaluate the usability of the CCEFP website. The goal of this project was to evaluate and address the usability of the CCEFP website and propose potential solutions. The next section will describe the process of heuristic evaluation followed by a usability testing. Finally, a discussion and conclusion section will discuss the findings and summarize the research.
HEURISTIC EVALUATION Three faculty members at North Carolina A&T State University who are also members of CCEFP participated in the interview process. Two of the faculty members are human factors professors. Six participants served as evaluators for the heuristic evaluation. Evaluators were undergraduate research assistants and graduate students. The graduate students are members of CCEFP. All participants evaluated the interface individually and then met collectively to identify the most common issues as well as the issues that needed the most attention.
The team members carried out individual heuristic evaluations of the CCEFP website from their perspective. The results of these heuristic evaluations were recorded in a table format listing the problem, the corresponding usability heuristic numbers, and a severity rating. Upon completion of the individual evaluations, they were shared amongst the team. The team developed a list of all of the top usability problems found within the CCEFP website and the frequency of each problem. The team included how the problems violated the usability heuristics, the severity of each problem, how easy it is to fix the problem and potential solutions to each of the problems.
The tasks for the heuristic evaluation are:
Task 1: Individually identify usability problems within the CCEFP website.
Task 2: Evaluate usability problems according to Nielson’s ten usability heuristics.
Task 3: Record frequency of each problem found throughout the website.
Task 4: Collectively, rank severity and easy of fixing for each usability issue.
Task 5: Select top five usability problems based on severity ranking.
Task 6: Develop potential solutions for top ten usability problems.
Overall, faculty members use the CCEFP website for upcoming events, project events and relevant projects to search for industrial partners. The website was not difficult to navigate among the faculty, but all agreed that some areas of the website could be improved. Suggested areas to improve were the membership link and locating industry members and events. In addition, information overload was a huge concern for the faculty.
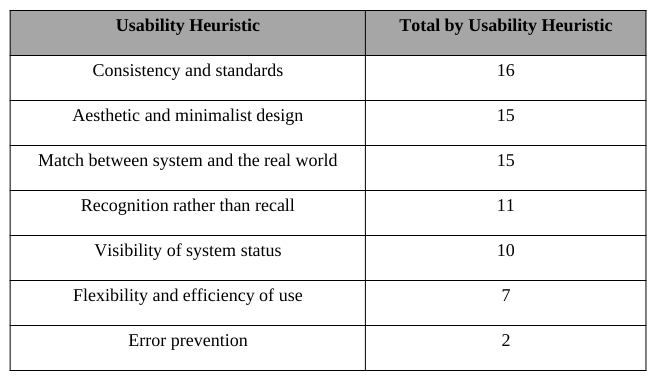
The heuristic evaluation resulted in 52 usability issues. Table 6 displays the most frequent heuristic violations. The table is meant to serve as an indication of where the website is lacking in usability from the general user perspective. The table data only represents the team data in regards to areas of concern which are “consistency and standards”, “aesthetics and minimalist design” and “match between system and the real world”.
There were several instances where the website was inconsistent with labeling or information was mislabeled. Though many icons and labels are not universal, users however should not be required to interpret its meaning. If users are required to think and interpret icons or search randomly for information, it will frustrate the user and increase their level of confusion. For example, this website uses the label “Go” for their search bar. Evaluators noted two major issues with this bar; visibility and the use of the word ‘Go” instead of “Search”.
Pictures were also a concern for this website. Images and graphics are used on websites to help communicate a message, capture a moment and engage the users. This website is populated with graphics and images, but does a poor job with being consistent with labeling. Images on pages such as the Public Outreach page is made absolutely clear to the user of what is happening whereas the images on the Industry page may leave the user wondering the purpose of that page.
The evaluators also had difficulty navigating within the website. There is a recurring issue of multiple clicks when searching for relevant information to students and faculty (e.g. current events and projects). In addition, the website does not utilize a back and forward button allowing users to view previously viewed pages. The user will have to go through multiple clicks again to access past information. This problem can lead to issues in error prevention. For the team, it led to some level of frustration.
Overall, the evaluators were not impressed with the color scheme choice for the website. When visitors visit websites, the color scheme is usually what captures their attention. It is a communication medium that can leave a positive or negative impact on the user. The color scheme can also make it hard for users to navigate the site. Although the color blue is a popular choice, the evaluators were mostly not impressed with the font color selection. It made it difficult to read the content on certain pages.
Table 6: Heuristic Evaluation Team Scoring Usability Heuristic Total by Usability Heuristic
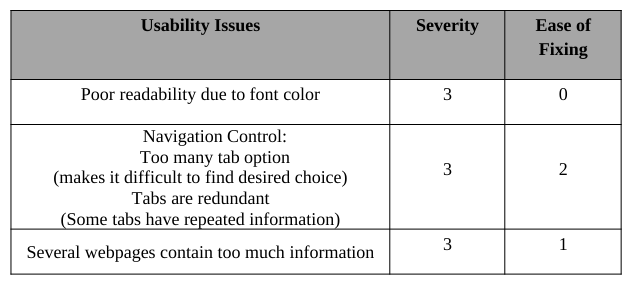
In addition, to the above evaluation, the team identified specific components of the CCEFP website that have significant design issues. The issues in Table 7 were ranked using Nielson’s severity rating (Table 3) and Olson’s easy of fixing rating (Table 4). Although, the initial goal was to select the top five usability problems, the team decided to address the most frequent concerns with the highest severity ranking which resulted in three significant usability issues. The team agreed that resolving these issues would also solve majority of other usability issues that were found with lower severity ratings.
Table 7: Severity Ranking and Ease of Fixing Scoring Usability Issues Severity Ease of
USABILITY TESTSING Participants
Participants between the ages of 18 and 60 were recruited to participate in the experimental study. All participants were students between the ages 18-39. Five participants are undergraduate students and one student is a graduate student. Three participants were males and three were females. Three participants are members of CCEFP.
Stimulus Material and Equipment
The equipment used for the video recording in usability testing was the Tobii T60 device with the Tobii Studio 3.0.1 software.
Tasks The task analysis and the feedback from the interviews were used to select the following tasks performed by each participant for the usability testing.
Task 1: Identify the seven participating universities.
Task 2: Locate industry members of the Center.
Task 3: Locate the application for the Fluid Scholars Internship Program.
Task 4: Indicate the most recent event performed by the Center.
Task 5: Find literature on hydraulic excavators.
Procedure Participants in the usability testing study were first briefed about the study and asked to sign an informed consent form to participate in the study. A pre-study questionnaire was administered to each participant to collect demographic information and information about their experience with and attitude towards computers, smart phones, and simulation software. Next, participants were given two minutes to browse the CCEFP website. Upon completion, a scenario about the tasks and the task list was given to the participants. Finally, participants were asked to complete a post-study questionnaire and thanked for their participation. The study lasted about 30 minutes.
Data Collection Participant performance data for the usability testing included quantitative and qualitative measures. The qualitative measures were assessed from the post-study questionnaire. The quantitative measures collected were task completion time, fixation time, accuracy measure of number of errors. Both descriptive and inferential statistics were used for the analysis.
Data Analysis
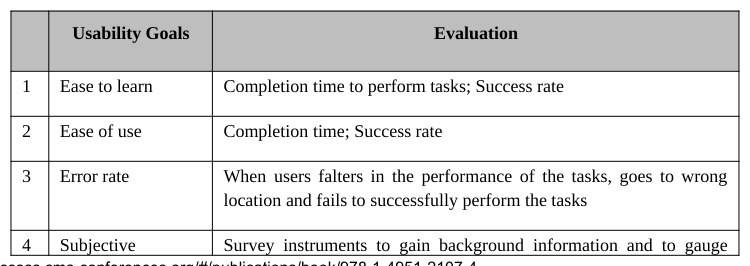
The data collected was analyzed using both descriptive and inferential statistics. Qualitative measures such as ease of use, easy to learn and satisfaction were analyzed using the responses from the post-questionnaire form. Quantitative measures of completion time and number of mouse clicks were collected using the video footage of the participants’ on screen activity. The following subsections describe the analysis and results of the study. The research goals for this study and its evaluation are found in Table 8.
satisfaction users experience and attitudes towards informational systems
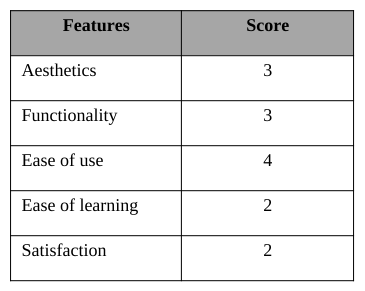
Pre-test questionnaire analysis The pre-test questionnaire was used to collect information in three categories; computer experience, attitude and background (demographic information). In the first category, participants were asked to rate their experience with computer technology. The results show that 67% of the participants had 10+ years of computer experience. Fifty percent of the participants rated their computer skills level as excellent and good. In addition, all participants use the internet either very often or frequently. For the second category, participants was asked to rank the importance of aesthetics, functionality, ease of use, ease of learning and satisfaction for a website when using a five-point Likert scale (1 = not important and 5 = very important). Results show that 67% of the participants consider ease of use to be most important and satisfaction and ease of learning to be the least important. The resulting scores are listed in Table 9. The background information is found in the subsection Participants.
Table 9: Pre-test questionnaire results for Attitude Features Score
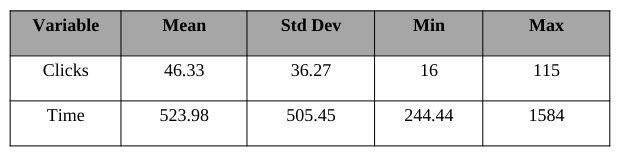
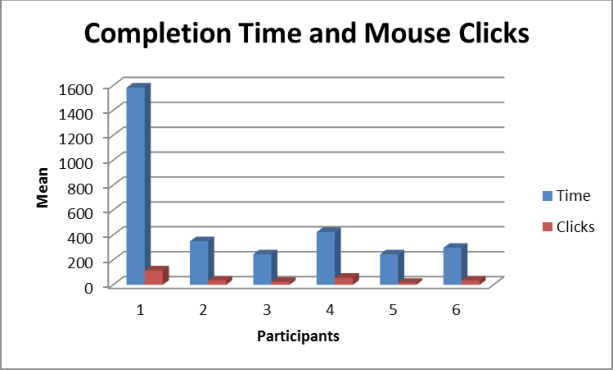
Descriptive statistics Participants performance data (completion time and mouse clicks) is recorded in Table 11. Figure1 shows a histogram of the means for completion time and the number of mouse clicks. The completion base time for the study was 40.81 seconds. The base for maximum amount of mouse clicks was 17 clicks
Table 11: Descriptive statistics of performance data Variable Mean Std Dev Min MaxFigure 2: Mean of time and clicks or study
Tasks that participants were able to complete successfully were logged as completed tasks. Error was defined as tasks that the participant failed to complete successfully. Tasks that were completed with no errors were considered to be completed with ease. If the participant’s mouse clicks and completion time was over the baseline time, the task was considered to be completed with difficulty. Results show that 100% of the participants were unable to complete Task 3 and 4. All participants were able to complete Task 1, 2 and 5.
Inferential statistics The completion time and mouse clicks data were analyzed using SAS 9.3 software to test the relationship between the completion time and number of clicks. Results indicate a high correlation between completion time and mouse clicks (r = .97).
Post-test questionnaire Participants were asked to rank their experience with the CCEFP website. Results indicate that 83% felt they were able to complete the task as required. Fifty percent rated the tasks and the website navigation as somewhat easy. Sixty seven percent of the participants felt the website was easy to use where as 50% felt it was easy to learn. Over 50% was satisfied with the website, however results show that 33% were dissatisfied with the overall layout and organization of the website. Majority of the participants felt the website had a clear purpose and effectively communicated CCEFP’s identity. Overall, there was a consensus amongst the participants that some information was easier to find than others.
Usability issues During the testing, the investigators observed several usability issues experienced by the participants. The layout of the website and the labeling of the tabs were very confusing to the participants. A few of the participants noted that the website appeared to be well organized, but as they began navigating the site, the information they were seeking was not easily accessible. They spent unnecessary time clicking on unrelated tabs because the tabs did not always reflect the information on the page. For example, as the participants searched for the Fluid Scholars Internship Program application (Task 3), they were unsure where to look. Three of the participants stated they were searching for a scholarship link on the education and outreach page. Others who located the correct page failed to find the link to the application because of the extensive amount of information on the page. Participants spent unnecessary time reading through the paragraphs when the link was located at the bottom of the page. Many participants expressed a desire for the page to have a quick overview of the topic to avoid reading long paragraphs. As a result, participants became frustrated and aborted the task.
Several of the usability issues found with Task 3 were also experienced in Task 4. Participants were observed navigating between the get involved and the news desk tab to locate current events. Some began to search for a site map for easier navigation. One participant was observantly frustrated and used the “Go” feature to locate current events. Many participants were not confident if what they found was an actual event. The second observation was the participants were uncertain when events were happening. As a result, they could not identify whether it was a current event and decided to move to the next task. One participant commented that the pictures on the event page helped to recognize the page as an event page but, it would have been helpful to have captions with the pictures to identify the events.
At the end of the testing, two participants expressed that the aesthetics (color scheme) and design of the website were challenging. One participant liked the homepage but, felt the site lost its appeal with the other pages. The other participant suggested a new color scheme, site map for faster navigation and less information on the pages.
.
DISCUSSION AND CONCLUSION The CCEFP website has many positive design and organization elements, and yet a few usability issues regarding information overload, aesthetics and navigation prevent it to perform optimally and therefore, needs fixing. While the CCEFP website design seems to be attractive and well organized in a manner that seems efficient, the momentum of the design falls short when a user has to really use the site for reasons other than to browse. Navigation quickly becomes an issue as well as having to read through several paragraphs on multiple pages to find information. This was reflected in the users’ performance where all users failed to complete task 3 and 4. As previously mentioned, this can lead to frustration and dissatisfied users.
As the heuristic evaluation have shown, the three key areas where the site begins to fall behind is consistency and standards; aesthetic and minimalist design; and match between system and the real world. The participants’ feedback from the post-questionnaire confirmed that CCEFP website had no major issues that could not be fixed with minimal effort. With some additional work and refinement the CCEFP website can be improved to meet the needs of its members and engage the fluid power community.
In addition, the results of this study represent a small sample size. An increase sample size may generate different results. However, it is worth noting that current members of the center experienced a level of difficulty when performing the tasks. Currently, a prototype is being designed using the UCD method to address the usability issues that violated the Nielson’s ten heuristics. In the future, a larger sample size will be used and another usability test will be conducted to compare the existing CCEFP website to the proposed prototype.
REFERENCES
Abras, C., Maloney-Krichmar, D., & Preece, J. (2004). User-centered design. Bainbridge, W. Encyclopedia of Human-Computer Interaction. Thousand Oaks: Sage Publications, 37(4), 445-56. Davis, D., Franca, P., Delpish, R., Jiang, S., Usability testing of rescue robot interface using eye tracking, Proceedings of the 2013 Industrial and Systems Engineering Research Conference, San Juan,Puerto Rico, May 18-22. Hewett, T., Baecker, R., Card, S., Carey, T., Gasen, J., Mantei, M., Perlman, G., Strong, G., & Verplank,W. (1992).ACMSIHCHI curricula for human–computer interaction. Association for computing machinery. New York, NY: ACM. Nielson, J.(1993). Usability engineering. San Diego: Academic Press. Nielsen, J. (2001). How to conduct a heuristic evaluation. Available: http://www.gerrystahl.net/hci/he2.htm. Last accessed: 03/06/2014 Nielsen, J. (2003). Severity Ratings for Usability Problems. Available:www.useit.com/papers/heuristic/severityrating.html. Last accessed: 03/05/2014. Nielson, J.(2012). Usability 101: Introduction to Usability. Available: http://www.nngroup.com/articles/usability-101- introduction-to-usability/. Last accessed: 03/05/2014. Norman, D. A., & Draper, S. W. (1986). User centered system design; new perspectives on human-computer interaction. L. Erlbaum Associates Inc.. Olson, J. (2004). Quick Methods: Checklists, Heuristic Evaluation, Cognitive Walkthrough. SI 622 Evaluation of Systems and Services Power Point Presentation Roy, M.C., Dewit, O. & Aubert, B.A. (2001). The Impact of Interface Usability on Trust in Web Retailers. Internet Research: Electronic Networking Applications and Policy, Vol. 11, No. 5, pp. 388-398
LISTED IN THE AHFE DIGITAL BOOKSTORE CATALOGUE
Explore the complete digital volume
Advances in Ergonomics In Design, Usability & Special Populations: Part II
Read this individual research paper free through the original publisher, or explore the full digital proceedings book.
ISBN 978-1-4951-2107-4
Explore this ISBN in the AHFE Bookstore ↗Listed in the July 2026 bookstore catalogue; search by ISBN to confirm current availability · Digital book purchase optional