Ziyi Shen, Yin Guodong (2021). Exploration of Multi-Touch Sliding Gesture Usage in In-Vehicle Infotainment System. In: Human Systems Engineering and Design (IHSED2021): Future Trends and Applications. AHFE Open Access, vol. 21. https://doi.org/10.54941/ahfe1001143
Although more and more functions are integrated into the center touch screens, many researchers have proved that touch screens might distract drivers’ attention and cause accidents. Voice controls were also proved mentally straining and takes long interaction times. This article explored the practicability of multi-touch sliding gesture operations, basing on multi-touch screens or touchpads that are already widely used in vehicles. We built a multi-touch sliding gesture In-Vehicle Infotainment (IVI) system and a traditional touch IVI system, then evaluated them from both subjective and objective perspectives. The results are very positive: by using sliding gesture op-erations, the eye off-road time reduced 87.3%, the off-lane counts reduced 86.84% and the accident rate reduced from 7.5% to 0%. The driving activity load score reduced by more than half and the User Experience Questionnaire scored 2 ranks better.
Human Systems Engineering and Design (IHSED 2021) https://openaccess.cms-conferences.org/#/publications/book/978-1-7923-8987-0
INTRODUCTION
Digital devices are changing our lives massively. More and more buttons and knobs are replaced by the touch screens on center consoles. Although these touch-screen In- Vehicle Infotainment (IVI) systems are very modern and concise, there are potential dangers in operating these systems: Firstly, Compared to physical controls, touchscreen needs more central vision and more time. In the study of Fred, Yili, et al. (Fred, Yili,2014), participants performed radio tuning tasks with a physical panel and a touch screen IVI system. The average task finishing time was 5.1s (as a single task) and 6.7s (as a dual-task) while using the physical panel. It takes 7.0s and 9.2s respectively while using the touch screen IVI system.
Besides that, the vehicle motion influences the accuracy of operating touch screens, resulting in greater mental demand and user frustration. In the experiment conducted by Natassia, Michael, and Paul(G. N. Lenné,2012), to test the impact of on-road motion on touch-screen operation, a series of battle management tasks were performed in the vehicle while it was driven over sealed road and unsealed roads. The task accuracy was significantly lower on the unsealed roads. Meanwhile, the perceived workload, physiological workload and usability were all rated significantly lower on the unsealed roads. A similar result was shown in the experiment carried out by Michael, Paul, Tom, Miranda and Nebojsa(Lenné, M. G., 2011).
Engineers have never stopped exploring newer, more effective interaction methods. Voice-Control and Gesture control systems were the most practical interaction method used in IVI systems for now.
Despite being used in vehicles for more than 15 years(Acura first introduced a voice control system in 2005), the accuracy of the speech recognition system is still unsatisfactory. A recent study shows that in the most ideal case, the character error rate (CER) of speech recognition in cars is 13.95%. While in the worst case, the CER can reach 80.82%.( T. Kawase, M. Okamoto, 2020) In the experiments conducted by Gellatly and Andrew William(Gellatly, A. William,1997), the results showed no benefits can be claimed for automatic speech recognition systems improving driving safety or performance compared to current manual-control systems.
Meanwhile, the gesture operation may have a better application prospect.
THE GESTURE CONTROL IN IVI SYSTEMS The gesture operations can be divided into plane gestures and space gestures.
The plane gestures mean interacting on a surface that can sense the operations. Döring, Tanja, et al. (D. Tanja) designed a gesture operation interface on the steering
Human Systems Engineering and Design (IHSED 2021) https://openaccess.cms-conferences.org/#/publications/book/978-1-7923-8987-0 wheel, which significantly reduced visual distraction. Thomas, Ulrich, et al.( T. A. Ulrich,,2013) had another attempt on the steering wheel, resulting in positive feedback. In the scrolling research from Tuomo (T. Kujala, 2013), it was proved that sliding is more effective than touch operation.
Space gestures mean doing gestures in the designated space area, the operations are collected by cameras. Miach Alpern, Minardo et al. (M. Alpern, K. Minardo., 2003) showed that a gesture interface is a viable alternative for completing secondary tasks in the car. Lisa Graichen et al.(L. Graichen, M. Graichen, 2019) found the gesture controls to be a safer and easier interaction than touch controls.
Compared to the space gesture controls, the plane gestures don’t need extra hardware, have a higher recognition rate and could use more feedbacks (like vibration, haptics simulation).
This article explored the multi-touch plane gestures based on the center console touchscreens.
EXPERIMENT To investigate the practicability of multi-touch gesture control usage, we designed this experiment to compare two IVI interface prototypes.
Before the experiment, we conducted a survey about the usage of In-Vehicle Infotainment (IVI) system functions. 30 participants took part in the survey. The result showed the climate control and music control are the most commonly used functions. Over half of the drivers among our participants prefer phones or Apple CarPlay rather than the built-in navigation systems. (J. Kim, S. Kim, 2016)( L. Wang, D. Y. Ju., 2015) Over 60% of the participants suggested reducing visual channel occupation. Over 50% of the participants wanted better feedback while using the touch screens.
APPARATUS The experiments took place in the Southeast University’s Ergonomics Laboratory. The driving simulator was running on a Windows PC and displayed on a 24-inch display with a resolution of 1920×1080 pixels. The participants used a Logitech G29 Steering-wheel to drive. The eye movement was recorded by a Tobii Pro X2 eye tracker and Tobii Studio software. This Screen-based eye tracker captures gaze data at 30Hz. The simulator gives short alarms when the driver drives off the lane or violates other traffic regulations.
The IVI system prototypes were built with ProtoPie, a UI/UX prototyping tool. The IVI system prototypes run on an iPad(6th generation) with a 9.7-inch Multi Touch screen, resolution of 2048x1536 at 264 PPI. The iPad was fixed at medium
Human Systems Engineering and Design (IHSED 2021) https://openaccess.cms-conferences.org/#/publications/book/978-1-7923-8987-0 height, the optimal height according to the touchscreen installations research of Cheng-Jhe Lin and Chueh Chiang.(2017)
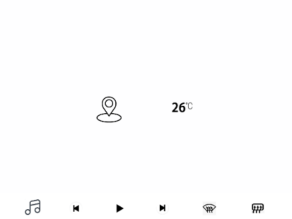
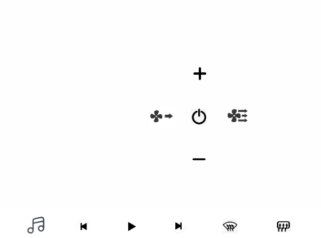
The first prototype is representative of normal touch screen IVI systems, the interface includes common touch-screen operations: 1-point touching and sliding. The icon size is 100x100pixels. The interface includes the main menu(fig1), a climate control menu and a navigation menu(fig2). These layouts are commonly used in IVI systems. Some settings in the menu need one click to use(Play/pause music, last/next song, front/rear defrosting). Other settings need two clicks or one click and sliding. After each operation, the system gives corresponding animation and sound as feedback.
Figure 1. Domains of human systems integration. (Made by authors. 2021)Figure 2. Domains of human systems integration. (Made by authors. 2021) The second prototype is a multi-touch gesture-controlled IVI system. The number of touchpoints is directly corresponding to different functional categories. One point corresponds to music control, two points correspond to climate control and three points correspond to defrost-related functions. The driver controls it by long touch and sliding(up, down, left and right) with multiple fingers.
The screen shows the function categories and the corresponding number of fingers(fig.3). During the operation, the corresponding icon will be moved with the fingers, voice and text feedback were also given by the prototype.
Human Systems Engineering and Design (IHSED 2021) https://openaccess.cms-conferences.org/#/publications/book/978-1-7923-8987-0
Figure 3. The home page of prototype 2(Made by authors. 2021) PARTICIPANTS
12 participants were recruited, aging from 22 to 26. Six of them were 24 years old. Two of them were 25 and three 26. Participants include 6 females and 6 males. All of them were students from Southeast University. Seven of them had driving licenses. All participants were healthy and had normal or corrected-to-normal visions. EXPERIMENTAL DESIGN We used a driving simulator to create a driving scenario. All participants drove the same route. Before the experiment, the participants had free choice of time to practice the driving simulator and learn IVI interface prototypes. (non-mandatory, most of them used less than 30s on each prototype) Then the participants were asked to operate the IVI system prototypes while driving. Half of our participants operated the traditional touch-screen prototype before operating the multi-touch gesture prototype and half of them did reverse order to eliminate the influence of the memory effect.
We chose ten commonly used IVI system functions(according to our survey) for them to operate during each driving simulation. The ten functions for the first prototype include 5 one-touch operations and 5 need two clicks or one sliding. The researcher told participants the next IVI system operation to do, then they choose their convenient time to operate(when the traffic conditions are good). The driving performance (mistakes, lane departure) and eye off-road time were recorded to evaluate the attention diverting while operating the IVI systems.
After the driving simulation, we used the driving activity load index(DALI)( A. Pauzie., 2008) to assess the driver's mental workload. The DALI is a modified version of the NASA-TLX, focusing on the driving task, proved to be effective(A. Pauzie., 2009). User experience questionnaire (UEQ)(H. Andreas,2020) was also used to assess two IVI interface prototypes.
RESULTS
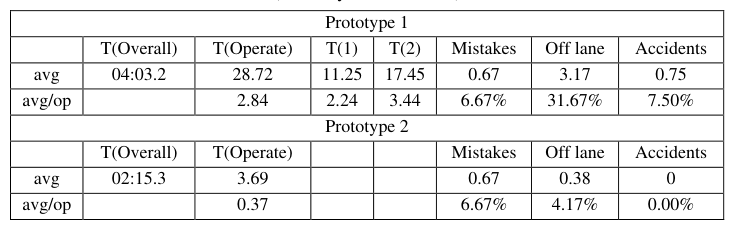
Table 1 is a summary of the average time used and mistakes made by 12 participants during the test. The “T(Overall)” is the time interval between the first IVI system operation and the last operation. This item reflects the operation difficulty expected
Human Systems Engineering and Design (IHSED 2021) https://openaccess.cms-conferences.org/#/publications/book/978-1-7923-8987-0 by participants(for complex operations, they would wait more for ideal road conditions). The "T(Operate)" is the total eye off-road time during the IVI system operation. The T(1) is the total eye off-road time of one-touch operations(5 for each participant) and T(2) is the total time of two-step operations(5 for each participant). "Mistakes" is the number of IVI system operation mistakes. The rest two columns are the lane departure and accident(traffic violation or crash) counts. “avg/op” means the average count per operation.
Table 1: The test records (Made by authors. 2021)
THE EYE OFF-ROAD TIME The eye off-road time for one-touch operations ranges from 0.7 to 4.9 seconds, with an average time of 2.24s (t(59)=16.771, p<0.001, d=1.036). The time for two-step operations ranges from 1.24 to 7.6 seconds, with an average time of 3.44s ( t(59)=17.185, p<0.001, d=1.492). The multi-touch gesture operations didn't necessarily need a glance. Therefore, for 89 out of 120 multi-touch gesture operations, participants didn't look off-road. The longest glance is 2.8 seconds. The average time is 0.37s (t(119)=4.988, p<0.001, d=0.719).
Considering one-touch and two-step operations as a whole, the average time is 2.84 seconds. According to one-way ANOVA, the eye off-road time difference between prototype1 and prototype 2 is significant (F(19,99)=2.272, p=0.005). The result shows a remarkable reduction of the eye off-road time by 87.3%.
THE DRIVING PERFORMANCE The IVI system operation mistakes made during the test were the same (8 in total) between 2 prototypes. The driving performance was evaluated by off-lane and accident counts. The participants went off lane 38 times and had 9 accidents in total during the operation of prototype 1. The counts were 5 and 0 respectively during the operation of prototype 2. The off-lane rate was reduced by 86.84%. The accident rate dropped from 7.5% to 0%. The sum of off-lane and accident counts has a significant
Human Systems Engineering and Design (IHSED 2021) https://openaccess.cms-conferences.org/#/publications/book/978-1-7923-8987-0 linear relationship with the eye off-road time (Pearson Correlation, p<0.001).
THE DRIVING ACTIVITY LOAD INDEX (DALI)
Table 2: The DALI questionnaire score (Folds et al. 2008)
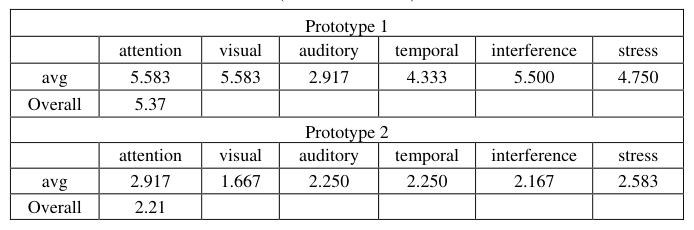
Table 2 is the summary of the DALI questionnaire score. Comparing prototype 2 to prototype 1, the average score of “effort of attention”, “visual demand”, “temporal demand”, “interference” and “situational stress” were significantly reduced. For a 7- point scale like this, doubled score means tremendous difference. The average “auditory demand" score was reduced as well, unexpectedly, since prototype 2 used voice feedback. The possible explanation is more attention can be distributed to the auditory channel because of the lower demand of other channels. The overall score is 5.37 for prototype 1 and 2.21 for prototype 2.
THE USER EXPERIENCE QUESTIONNAIRE (UEQ) The UEQ measures the User Experience of interactive products. The range of the scale is between -3 (horribly bad) and +3 (extremely good). In real applications, values between -0.8 and 0.8 points are considered as a neutral evaluation. Over 0.8 points mean positive evaluation. The Alpha-Coefficient (K. Sijtsma, 2015) is a measure for the consistency of a scale. An alpha value > 0.7 is normally considered as sufficiently consistent. Table 3 is the result of the UEQ.
Table 3: The UEQ score (Folds et al. 2008)
Human Systems Engineering and Design (IHSED 2021) https://openaccess.cms-conferences.org/#/publications/book/978-1-7923-8987-0
Prototype 1 scored neutral evaluation for both Pragmatic Quality and Hedonic Quality, giving it a neutral (0.115) overall score. Prototype 2 scored a positive rating for both Pragmatic Quality and Hedonic Quality, getting a positive 1.193 total score.
CONCLUSIONS
During this study, researchers established two IVI systems and tested the driving performance and user experience while using them.
In terms of objective performance, prototype 2 significantly reduced eye off- road time, off-lane counts and even avoided all of the accidents. Almost all of the participants only used a short (about 30 seconds each) time to learn and memorize, indicating that these systems are easy to learn and use. However, the short learning time potentially increased the difficulty of the operation, especially for the new interactive operation in prototype 2. While some participants operated prototype 2 without looking at the iPad, some participants looked off-road to locate the touch screen or even looking for the icons to remind the operation. Even with these values, the average EOR time still reduced 87.3%, resulting in average of 0.37s(t(119)=4.988, p<0.001, d=0.719) for each operation.
Meanwhile, the short learning time could also raise the error rate at the same time. While the mistake made on prototype 1 varied, the mistake made on prototype 2 concentrates on music switch operation: swiping left was defined as switching to the previous song, 5 participants swiped to the right(only 6 of them made mistakes). This might be influenced by the sliding operation of some mobile phone software.
Because the number of accidents was relatively small and greatly affected by the individuals, it was unexpected that the number of accidents and EOR time could have such a high linear correlation coefficient. This data tells us that EOR time is basically the most important cause of accidents. The visual channel occupancy is the most weighted item in the DALI questionnaire, which also illustrates this fact.
In the subjective evaluation, the driving activity load index resulted in a tremendous reduction of mental workload, reducing more than half of the overall score. The UEQ supported this evaluation, the prototype 2 rated a positive score of 1.193, while prototype 1 only rated a neutral score(0.115). The score of prototype 2 was two ranks better than the prototype 1 range, compared to the results of 14056 samples from 280 studies.
These results presented a very promising application value of the multi-touch sliding gestures, considering it can be introduced to the existing IVI systems as an OTA upgrade. In practical applications, it is highly recommended to let users decide the corresponding functions, for better memorizing and usage. The gestures should be simple and consistent with cognitive habits.
Human Systems Engineering and Design (IHSED 2021) https://openaccess.cms-conferences.org/#/publications/book/978-1-7923-8987-0
For touch interaction, there was obvious time demand for eye focusing, icon searching and touching. On average, the two-step operations take 1.2s more than one- touch operations (2.24s). According to one-way ANOVA, the difference is significant (F(32,56)=2.014, p=0.04). Since the EOR time is highly linear correlated with the accident rates, it's better to put common functions on the home page than putting into new pages.
ACKNOWLEDGMENTS
I want to express my particular thanks to my classmates and teachers. They gave me great support and help.
REFERENCES
F. Feng, Y. Liu, Y. Chen, D. Filev, C. To, (2014). “Computer-Aided Usability Evaluation of In-Vehicle Infotainment Systems.” Proceedings of the Human Factors and Ergonomics Society Annual Meeting, 58(1), 2285–2289. G. N. Lenné M.G. Salmon P. , (2012)”The Impact of on-road Motion on BMS
Touch Screen Device Operation” Ergonomics, Vol. 55, pp 986-996. Lenné, M. G., Salmon, P. M., Triggs, T. J., Cornelissen, M., & Tomasevic, N.
(2011). “How Does Motion Influence the Use of Touch Screen In-Vehicle Information Systems? “ Proceedings of the Human Factors and Ergonomics Society Annual Meeting, 55(1), 1855–1859. T. Kawase, M. Okamoto, T. Fukutomi and Y. Takahashi,(2020) "Speech Enhancement Parameter Adjustment to Maximize Accuracy of Automatic Speech Recognition," in IEEE Transactions on Consumer Electronics, vol. 66, no. 2, pp. 125-133, May 2020, doi: 10.1109/TCE.2020.2986003. Gellatly, A. William,(1997) “The use of Speech Recognition Technology in
Automotive Applications”, Doctor of Philosophy in Industrial and Systems Engineering, March 28, Virginia Polytechnic Institute and State University, USA. D. Tanja. "Gestural interaction on the steering wheel: reducing the visual demand."
Proceedings of the SIGCHI Conference on Human Factors in Computing Systems. ACM. T. A. Ulrich, Z. Spielman, J. Holmberg, C. Hoover, N. Sanders, K. Gohil, S.
Werner, (2013). "Playing Charades With Your Car – The Potential of Free- form and Contact-based Gestural Interfaces for Human Vehicle Interaction." Proceedings of the Human Factors and Ergonomics Society Annual Meeting, Vol 57(1), pp1643-1647. T. Kujala, (2013) “Browsing the information highway while driving: three invehicle touch screen scrolling methods and driver distraction.” Pers Ubiquit Comput 17, 815–823.
Human Systems Engineering and Design (IHSED 2021) https://openaccess.cms-conferences.org/#/publications/book/978-1-7923-8987-0
M. Alpern, K. Minardo. (2003) "Developing a car gesture interface for use as a secondary task." CHI'03 extended abstracts on Human factors in computing systems. ACM, Florida, USA. L. Graichen, M. Graichen, J.F. Krems,(2019) “Evaluation of Gesture-Based In-
Vehicle Interaction: User Experience and the Potential to Reduce Driver Distraction”, Human Factors, Vol 61 (5), pp. 774-792. 2019. J. Kim, S. Kim, C. Nam, (2016)“User resistance to acceptance of In-Vehicle Infotainment (IVI) systems” Telecommunications Policy, Vol 40, pp 919-930. L. Wang, D. Y. Ju.(2015) “Concurrent use of an in-vehicle navigation system and a
smartphone navigation application”. Social Behavior and Personality: An International Journal, 43(10), 1629–1640. C. Lin, C. Chiang,(2017) “A Study of Multi-touch Screen Installation in Vehicles for Single-touch and Gestural Operations,” The Japanese journal of ergonomics, Vol.53, pp S520-S523, Japan. A. Pauzie.(2008) “A method to assess the driver mental workload: The driving
activity load index (DALI)” IET Intelligent Transport Systems, vol 2, pp315- 322. A. Pauzié,(2009) “Evaluating driver mental workload using the driving activity load index (DALI)” Human Centered Design for Intelligent Transport Systems: Tools and methodologies for safety and usability. H. Andreas, W. Dominique, S. Martin, T. Jörg.(2020) “Applicability of User
Experience and Usability Questionnaires.” Journal of Universal Computer Science. Vol 25. pp 1717-1735. Jan. K. Sijtsma, T. University, (2015)”Delimiting Coefficient α from Internal Consistency and Unidimensionality,” Educational Measurement: Issues and Practice, Vol. 34, No. 4, pp. 10–13 Winter.
Human Systems Engineering and Design (IHSED 2021) https://openaccess.cms-conferences.org/#/publications/book/978-1-7923-8987-0
LISTED IN THE AHFE DIGITAL BOOKSTORE CATALOGUE
Explore the complete digital volume
Human Systems Engineering and Design (IHSED2021): Future Trends and Applications
Read this individual research paper free through the original publisher, or explore the full digital proceedings book.
ISBN 978-1-7923-8987-0
Explore this ISBN in the AHFE Bookstore ↗Listed in the July 2026 bookstore catalogue; search by ISBN to confirm current availability · Digital book purchase optional