Zhihang Liu, Jieun Lee, Junpei Kuwana, Huiping Zhou, Makoto Itoh (2023). Investigating Effects of Assistance Systems For Visually Impaired Drivers at Preventing Traffic Accidents. In: Intelligent Human Systems Integration (IHSI 2023): Integrating People and Intelligent Systems. AHFE Open Access, vol. 69, pp. 38–45. https://doi.org/10.54941/ahfe1002819
Visual field defects (VFD) are closely associated with driver hazard perception. Drivers with advanced VFD are more likely to be involved in traffic accidents than healthy-sighted drivers even though they apply extra movements to overcome the defects. Given difficulties in dealing with particular situations, such as finding traffic signals, machinery assistance is necessary for improving driving safety. However, it has been less explored that which assistance systems would be helpful for visually impaired drivers in which traffic situations. To have a better understanding of driving with VFD and provide a safer traffic environment for drivers with advanced VFD, this study aimed to investigate effects of three driver assistance systems on reducing traffic accidents regarding several traffic situations. Methods:A driving simulator experiment using 66 healthy-sighted drivers generated advanced VFD on a screen for all simulations. This study designed a Baseline condition and three assistance systems based on time-to-collision (TTC) in hazardous events: automatic braking (AB; TTC = 0.8s) and giving voice guidance about driver behavior to cope with encountering situations. Two guidance systems were presented in different alert timings (VGEarly; TTC = 4s, VGLate; mean TTC = 2.81s). We classified 29 hazardous events into four categories: traffic signals, oncoming right-turning cars, objects that appear from driver’s right and left sides, then counted the number of traffic accidents. Results:Data provided that all assistance systems showed the lower number of accidents than the Baseline. Whereas drivers in the Baseline were not able to find traffic signals due to the defect, no accident cases related to the situation were observed in the assistance system conditions. When an oncoming car turned to the right, drivers in the VGEarly showed the lowest accident rate among all conditions. The AB led the great number of accidents in the oncoming car situation but yielded no accidents with hazards approaching from the right. Results showed that both VG systems were more likely to reduce the accidents with hazards from the left than the AB. More specifically, the VGEarly decreased the accident rate by approximately 15% more than the VGLate.Discussions:This study attempted to figure out which system is effective for visually impaired drivers in which traffic situation. Interestingly, the effect depended on situations. For example, the AB led no accidents when encountering objects from the right side unlike the VG systems. The VGLate had a potential of reducing accidents, but the VGEarly more contributed to reducing accidents rather than the VGLate. Because VFD led failure in driver perception that is a very initial stage of information processing, in general, VGEarly is considered to produce appropriate performance. The current study is limited to investigating accident rates, thus next study should perform further analyses of driver response that can provide two-way feedback between the system and the driver. Despite the limitation, the present study found that assistance timings and traffic situations are critical factors influencing system design for visually impaired drivers. Empirical findings are expected to provide insights into practical assistance designs for driving with VFD.
The manner in which people act to achieve a goal can be considered informa- tion processing, a process in which perception, understanding of a situation, and selection and execution of an action are repeated (Parasuraman et al. 2000). In the perception segment, a driver relies mainly on vision to obtain information. Vision is an important part of driving behavior (Owsley & McGwin, 1999). Since drivers obtain road information mainly through vision, good vision is essential for safe driving (Owsley & McGwin, 1999). However, patients with visual field defects (VFDs) have deficits in the first step. Studies reveal that drivers with visual field impairments are more likely to be involved in accidents than drivers with normal vision (Satou et al. 2014). Furthermore, due to the developmental nature of visual field disorder sym- ptoms, drivers do not immediately recognize the defect in their visual field,
Investigating Effects of Assistance Systems for Visually Impaired Drivers 39
causing the incidence of accidents to increase significantly in the advanced stages of the disease. To date, research has focused on accident investigation and driving environment improvement from a human point of view. Inve- stigations on support from the vehicle’s assistance system to reduce accident rates are lacking. Therefore, the purpose of this study is to investigate the effe- ctiveness of different types of assistance systems in reducing traffic accidents in several traffic situations.
To investigate the affects of visual field loss on driving, we used extreme scenarios in our experiments (Kunimatsu et al. 2015). Hazardous events were divided into four categories: traffic signals, oncoming right-turning vehicles, objects appearing to the left and right of the driver. We counted the number of traffic accidents for each scenario.
METHOD
Participants This experiment was completed for the first time in 2019 and in 2022 with an increased number of people under the same conditions. Both the experiments required participants to (i) have a driver’s license and drive daily, (ii) have no previous case of eye disease, and (iii) have bare eye vision (corrected vision) of 0.7 or higher. Accordingly, 80 participants were recruited through temporary staffing agencies and on campus at the University of Tsukuba, Japan.
The purpose of the experiment and method of operation were explained to the participants before the experiment began, and the participants’ consent to participate was obtained after they were made aware of the need for video recording to investigate driving behavior. This study complied with the ethical regulations of the University of Tsukuba and was approved by the Ethics Review Committee (approval no. 2021R574).
Experimental Equipment In this experiment, the Honda Safety Navigator (S-Navi for ophthalmology) driving simulator from Honda Motor Co. was used on a 65-inch monitor with a horizontal field of view of 70
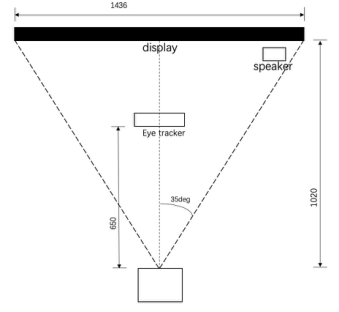
, which was specifically set up for an eye hospital. Further, the participants’ eye tracking information was acquired at 60 Hz by using ProNano, an eye tracking device manufactured by Tobii. At the same time, an alarm audio support system was generated by a speaker in front of the participant’s left side. Fig. 1 depicts the experimental equi- pment. The simulator contains a movable seat, steering wheel, gas pedal, and brake pedal. The eye tracking equipment is calibrated before the start of the experiment, and participants are asked not to move the seat position after the calibration.
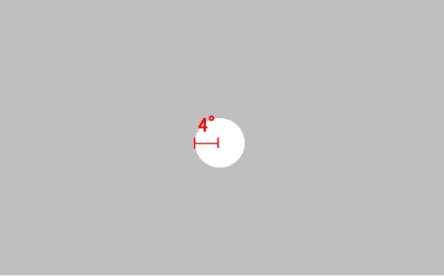
Visual Field Defects Simulation System In this experiment, to simulate a high degree of VFDs in a driver, we desi- gned and employed a simulation mask system. The mask pattern simulated the typical pattern of defects in patients with retinitis pigmentosa, and it was designed such that when it was displayed on the screen, the left and
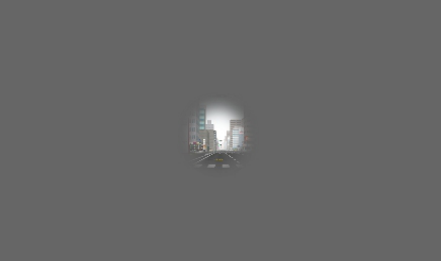
Figure 1: Sketch of the experimental equipment.Figure 2: Simulation mask system.Figure 3: Simulation of the driving screen in the case of virtual field defects.
right horizontal fields of view were 4
each, forming a total of 8
. At the beginning of the experiment, the central 8
visual field of view moved with the participant’s line of vision (Fig. 2). Fig. 3 depicts a specific driving screen.
Investigating Effects of Assistance Systems for Visually Impaired Drivers 41
Table 1. Examples of hazardous events.
Table available in the original PDF paper.
Table 2. Wording of the audio guide.
Table available in the original PDF paper.
Categories Alert message
Please note the right direction
Traffic signals (traffic signals and stop signs) Please stop at the traffic light Please stop at the stop sign Oncoming right-turning cars Please be aware of oncoming traffic Objects that appear from the driver’s right side Objects that appear from the driver’s left side Please note the left direction
Experimental Conditions To investigate the effects of different driving support systems, this study desi- gned a VFD condition (mask only) and three assistance systems based on the time to collision (TTC) in hazardous events: automatic braking (AB; TTC = 0.8 s) and providing audio guidance on driver behavior to cope with encountering situations. Further, two guidance systems were presented in dif- ferent alert timings (VGEarly: TTC = 4 s, VGLate: mean TTC = 2.81 s). We classified hazardous events (Table 1) into four categories: traffic signals (traf- fic signals and stop signs), oncoming right-turning cars, objects that appear from the driver’s right and left sides. Finally, participants completed two experimental trials that included 29 hazardous events.
The automatic braking system has a TTC setting of 0.8s except for the two scenarios of pedestrians coming from the left and right directions and tem- porary stop (TTC = 0.75s). Further, the deceleration of automatic braking was 0.7s. Table 2 depicts the wording of the audio guide.
Driving Tasks and Scenarios This experiment was divided into three sections: a wide two-lane road, single- lane road, and residential road, corresponding to maximum speeds of 50, 40,
and 30 km/h (Kunimatsu et al. 2015), respectively. Since this experiment did not involve turning and other operations, participants had to operate only the brakes and throttle. The experiment was set to automatically accelerate to the maximum speed of the corresponding road section by stepping on the gas pedal only once. When the participants judged the presence of danger and wanted to apply brakes or slow down, they had to apply the brake. Further, if the brakes were released before the speed became 0, the vehicle would automatically accelerate to the maximum speed.
In this study, two experimental trials were conducted with the same hazard scenario settings, following the adjustment of the order and number of occur- rences. Trial 1 had 15 scenarios: H1 to H7 was a 50-km/h section, H8 to H9 was a 40-km/h section, and H10 to H15 was a 30-km/h section. Trial 2 had 14 scenarios: H1 to H6 was a 50-km/h section, H7 to H8 was a 40-km/h section, and H9 to H14 was a 30-km/h section.
Experiment Procedure Upon arrival, participants were given a summary description of the experi- ment and a consent form. After the participants signed the form, we explained the driving behaviors to be exhibited by the participants; then, the partici- pants performed a two-minute practice to familiarize themselves with the driving simulator. Subsequently, we adjusted each participant’s position and calibrated the eye tracking equipment. Once everything was in order, two experiments were conducted, interspersed with a five-minute break. The entire experiment lasted for approximately 40 minutes.
RESULTS
Number of Accidents For this analysis, we used 2018 data (same scenario, no mask) as the baseline (BL). Tables 3 and 4 depict the number of incidents/violations in the BL group and VFD group for three different assistance systems. Excluding the reasons due to the state of the participants and equipment trouble, Trial1: 10, 18, 19, 18, and 19, Tria2: 30, 18, 19, 18, and 19 individuals participated in the BL VFD, VGLate, VGEarly, and AB groups, respectively.
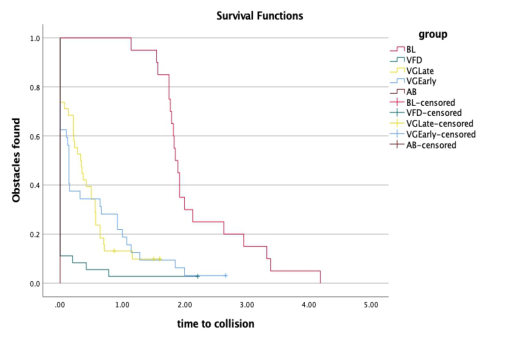
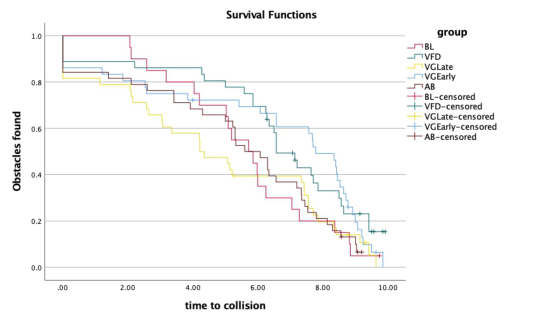
Time to Find the Obstacles A survival analysis was performed using the Kaplan–Meier method. Accor- dingly, we analyzed the situation where a red car appeared from the right and another car came from the opposite side.
Kaplan–Meier survival analysis estimates the proportion of drivers finding obstacles under a condition.
1) The red car that appeared from the right An overall comparison of survival curves using the log-rank test showed that the effect of the experimental conditions was significant (p<0.001). Fur- ther, results revealed that drivers had a fast response at BL, and the estimated survival proportion was 1. None of the AB group survived the scenario.
Investigating Effects of Assistance Systems for Visually Impaired Drivers 43
Table 3. Number of accidents in Trial 1.
Table available in the original PDF paper.
Group BL VFD VGLate VGEarly* AB Categories Traffic signals 0/50 (0%)
6/90* (6.7%)
0/90* (0%)
0/90* (0%)
0/95 (0%) Oncoming right-turning cars
0/20 (0%)
20/36* (55.6%)
16/36* (44.4%)
11/36* (30.6%)
0/30 (0%)
38/54* (70.4%)
16/54* (29.7%)
11/54* (20.4%)
0/57 (0%)
22/38 (57.9%) Objects that appear from the driver’s right side
4/49 (8.2%)
64/90* (71.1%)
46/90* (51.1%)
33/90* (36.7%)
51/95 (53.7%)
Objects that appear from the driver’s left side *Cases of equipment trouble and participant status; date were excluded from the tally.
Table 4. Number of accidents in Trial 2.
Table available in the original PDF paper.
Group BL VFD VGLate VGEarly AB Categories Traffic signals 5/174 (2.9%)
8/108* (7.4%)
0/114 (0%)
0/108* (0%)
1/114 (0.8%) Oncoming right-turning cars
1/58 (1.7%)
12/36* (33.3%)
10/38 (26.3%)
7/36* (19.4%)
0/87 (0%)
43/54* (79.6%)
18/57 (31.6%)
9/54* (16.7%)
0/57 (0%)
15/38 (39.4%) Objects that appear from the driver’s right side Objects that appear from the driver’s left side
1/87 (8.2%)
28/54* (46.3%)
14/57 (24.6%)
5/54* (9.26%)
14/57 (24.6%) *Cases of equipment trouble and participant status, date were excluded from the tally.
2) Oncoming right-turning cars An overall comparison of survival curves using the log rank test revealed that the effect of the experimental conditions was significant (p<0.05). Fur- ther, results showed that drivers had a fast response at BL, and the estimated survival proportion was 1.
DISCUSSION
The main objective of this study was to investigate the effectiveness of dif- ferent types of assistance systems. We simulated VFDs so that participants were not limited to individuals with true visual field impairment. Further, to investigate the effects of different driving support systems, we established three conditions: VGEarly, VGLate, and AB. Control with the group without any support (VFD). Compared these designs with driving devices without vision defects (BL). We counted the incidence of accidents under different conditions. We found that both audio guidance and automatic braking effe- ctively reduce the number of accidents. In front of the driving field of vision,
Figure 4: Estimation using Kaplan–Meier survival analysis of the proportion of drivers who found obstacles.Figure 5: Estimation using Kaplan–Meier survival analysis of the proportion of drivers who found obstacles.
accidents are less likely to occur, even with advanced VFD can be timely dete- ction of red lights, traffic signs, and other signals. In both Trial 1 and Trial 2 (Tables 3 and 4), the VGEarly group showed the lowest accident rates. This may indicate that early alerts can help avoid accidents in patients with VFD. Interestingly, we found that drivers with VFD could not respond immediately even after hearing an audio alert. There is usually a delay of approximately 2 s between hearing the alert and responding to it. For example, in Fig. 4, for the VGEarly group, the TTC when the group first finds the obstacle is approximately 2 s; however, the audio alert TTC is 4 s. If the audio alert is too late, the driver will not be able to react in time; in this case, even if the obstacle is confirmed, there is no chance of avoiding a crash, which can be derived from the slope of VGEarly and VGEarly groups in Fig. 4 and Tables 3 and 4.
Investigating Effects of Assistance Systems for Visually Impaired Drivers 45
The current study has some limitations. First, it only analyzed accident rates; future studies should consider more diverse aspects, such as assista- nce systems and drivers’ traffic cognizance. Second, to study the situation in special scenarios, this study does not fit real life, and future research should invest more effort in system development.
ACKNOWLEDGMENT
This paper was based on the results of JPNP18012 commissioned by the New Energy and Industrial Technology Development Organization (NEDO) and JSPS KAKENHI [grant number 21H04594].
REFERENCES
Kunimatsu-Sanuki S, Iwase A, Araie M, Aoki Y, Hara T, et al.(2015), An Assessment of driving fitness in patients with visual impairment to understand the elevated risk of motor vehicle accidents, BMJ Open, 5(2):e006379. 1–11 doi: 10.1136/bmjopen-2014-006379 Lee J, Itoh, M. (2020). Effects of driver compensatory behaviour on risks of criti-
cal pedestrian collisions under simulated visual field defects. PLoS ONE, 15(4), e0231130. Okamura K, Iwase A, Matsumoto C, Fukuda T, Kunimatsu-Sanuki S, Fujita G, et al. (2019). Association between visual field impairment and involvement in motor vehicle collision among a sample of Japanese drivers. Transporta- tion Research Part F: Traffic Psychology and Behaviour, 62, 99–114. Available from: https://doi.org/10.1016/j.trf.2018.12.012 Owsley C, McGwin G Jr. (1999). Vision impairment and driving. Survey of
Ophthalmology, 43(6), 535–550. Parasuraman, R., Sheridan, T. B., & Wickens, C. D. (2000), A model for types and levels of human interaction with automation, IEEE Trans. Systems, Man, and Cybernetics, 30 (3), 286–297. Racette L, Casson E J. (2005). The impact of visual field loss on driving performance:
evidence from on-road driving assessments. Optometry and Vision Science, 82(8), 668–674. PMID: 16127331. Satou K, et al. (2014). A Study on Quantitative Understanding of the Effects on Driving in Ocular Diseases with Visual Field Disorders (Glaucoma). Takata Foundation Grant Research Papers, 1–28.
LISTED IN THE AHFE DIGITAL BOOKSTORE CATALOGUE
Explore the complete digital volume
Intelligent Human Systems Integration (IHSI 2023): Integrating People and Intelligent Systems
Read this individual research paper free through the original publisher, or explore the full digital proceedings book.
ISBN 978-1-958651-45-2
Explore this ISBN in the AHFE Bookstore ↗Listed in the July 2026 bookstore catalogue; search by ISBN to confirm current availability · Digital book purchase optional