Yichen Dong, Sakura Akahoshi, Jieun Lee, Yuchi Saito, Itoh Makoto (2022). Modeling user requirements for driver-vehicle interaction system in China. In: Ergonomics In Design. AHFE Open Access, vol. 47, pp. 39–45. https://doi.org/10.54941/ahfe1001917
The purpose of the study was to develop a user requirement model aiming to obtain the critical attitudes of drivers to a driver-vehicle interaction system in China. An online survey with a questionnaire based on the proposed model was conducted. Six clusters were identified through Exploratory Factor Analysis, and five clusters showed high reliability and validity. The result of the survey indicated that the designed model was usable, and the current study provided a new model of user requirements for designing driver-vehicle interaction. This finding gives insights into developing a guideline for automobile manufacturers to user requirements’ survey.
The performance gap between different brands of automobiles is getting narrowed with the development of the automobile technologies. Today, con- sumers’ criteria on vehicle purchase are safety, comfort, and exterior design, based on the fierce competitions of advanced technology between vehicle manufactures (Dongyan and Xuan, 2008). To provide comfortable and safety experiences to drivers, automotive industries have been working on develo- ping driver-vehicle interaction systems, which integrates new technologies, such as haptic devices and voice recognition techniques, expect to provide the smart, friendly and adaptive human–machine interaction for drivers, (Sergio, Enrica and Luisa., 2009). Unlike automotive industries, customers showed less acceptances to such driver-vehicle interaction systems. For exam- ple, an online survey found that Germans and Americans in mass media did not acknowledge such technologies in automated driving (Eva and Barbara, 2016). This would be partly because the functions/values that a driver-vehicle interaction system provides are not clear. In other words, such system lacks the consideration of user requirements. For establishing acceptable driver- vehicle interaction systems, it is necessary to design the system with specific, definite, and unambiguous functions.
Technical Acceptance Model (TAM) has been adopted widely for resea- rching the user intentions and behaviors of new technology. TAM is a model
to investigate personal beliefs for accepting a technology (Fred, Richard and Paul, 1989). For example, TAM was adopted to examine the factors affecting driver’s usage intentions of in-vehicle GPS products (Ching-Fu and Pei-Chun, 2011). John et al. (2009) argued that beliefs only affect intentions through attitudes, the omission of attitudes is a significant deviation from TAM’s the- oretical foundation. Henrik et al. (2021) concluded that designers who work in interaction design should consider not only usefulness and perceived ease of use in TAM but also well-being factors, such as comfort and fun. Desi- gners can benefit from the theories of human needs to increase acceptance of user interfaces. The current study suggested to consider human needs in the interaction design field to modified TAM. We proposed a user requirement model by modifying TAM and developed a questionnaire survey to verify the usability of the model.
METHOD
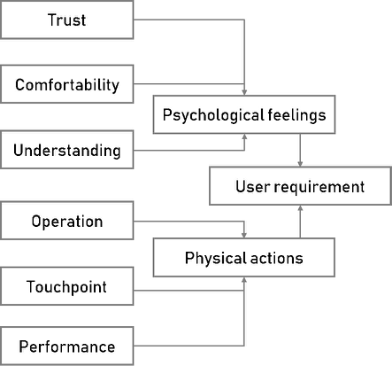
Model Design Two beliefs named perceived usefulness (system benefits) and perceived ease of use (expectation of features’ implementation) are distinguished in TAM (Fred, Richard and Paul, 1989). On one hand, to increase the system bene- fits and meet the functional requirement that what the system can do in user requirement definition, the interaction activities between the driver with the system were assumed to separate into different physical actions. We distin- guish those physical actions into three factors named operation, touchpoint, and performance. Those three factors were assumed to impact the whole interaction progress between users and the system. The operation was the activities from users to start the interaction progress, the touchpoint was utilized for transmitting users’ intentions to the system, and the machine performed the feedback to ending the interaction progress. On the other hand, except for the functional requirements, other requirements for jud- ging the operation of a system were regarded as non-functional requirements. Non-functional requirements should satisfy the expectation of users, the rese- archers suggested putting the psychological and physical aspects of users into consideration, such as Franziska, Matthias and Josef (2018) assumed novel psychological aspects of comfort impacted the acceptance of automated veh- icles, and Donald (2007) considered that the interaction between users and the automated system should not only be understood by the experts/frequ- ent users but also by the novices. Based on these perspectives, the research defined the psychological and physical aspects as understanding, comforta- bility, and trust. Finally, the proposed model consisted of six factors as trust, comfortability, touchpoint, understanding, performance, and operation (See Figure 1).
Questionnaire Design To prove the feasibility of the model that illustrated in figure 1, an online questionnaire survey was conducted. The proposed model should be expan- ded into some specific items. Thus, this study introduced AT-ONE (actor,
Modeling User Requirements for Driver-Vehicle Interaction System in China 41
Figure 1: Construction of the proposed user requirement model.
touchpoint, offering, norm, and experience) design method to the question- naire design progress. AT-ONE method is a practitioner-based way for Service Design, aiming to maximize the innovation potential at the early stages of service innovation (Simon, 2016). It is assumed to grasp drivers’ possible behaviors and thoughts when using the driver-vehicle interaction system. We assumed a scenario where the user interacts with the system and divided the interaction progress by AT-ONE method. For example, touchpoint of the pro- gress can be concluded into three items named vision point, voice, and hand activities. After that, the items were combined with the proposed model’s factors to create reasonable questions, like Q26. ‘The light provided by the system will not make you uncomfortable when you are driving at night’ was created by combining vision point with comfortability factor.
Measurement Development The questionnaire contains twenty-one items for six clusters, the clusters were designed to assess the six factors of the proposed model on a Likert scale (1= “strongly disagree” to 5= “strongly agree”). Those items were treated as the core variable questions. In addition, the questionnaire included sample background information questions including gender, age, and education.
Participants The questionnaire was distributed in China by a social application named ‘Wechat’ through the internet. The reason was that Chinese drivers were over 481 billion which was suitable to test quick questionnaires (Ministry of Public Security, 2022).
118 respondents with driving licenses completed the full questionnaires. The samples were composed of male = 65 female = 53. A total of 53.3% of the samples got a Bachelor’s Degree. The respondents’ ages were from 20 to 69, the range from 50 to 59 years occupied the most in respondents with 31.9%.
Data Analysis To reduce a large number of variables into a smaller set of variables, and esta- blish underlying dimensions between measured variables and latent factors, the analysis method of Exploratory Factor Analysis was adopted (Brett, Andrys and Ted, 2010).
Joseph et al. (1995) suggested that the sample size should be over 100 to satisfy the test of Exploratory Factor Analysis. Also, several tests should be utilized to check the suitability of the data to Exploratory Factor Analysis, including Kaiser-Meyer-Olkin (KMO) Measure of Sampling Adequacy and Bartlett’s Test of Sphericity. The KMO result of the questionnaire was.841, and Bartlett’s Test of Sphericity was significant (p<0.001). The results indi- cated that the questionnaire content was suitable for factor analysis (Joseph et al., 1995). Meanwhile, from the total variance explained by the analy- sis, six clusters having an eigenvalue>1, satisfied with ’cumulative percentage of variance and eigenvalue >1 role’ (Henry, 1960). It meant that the data reflected six clusters, which is the same as assumed.
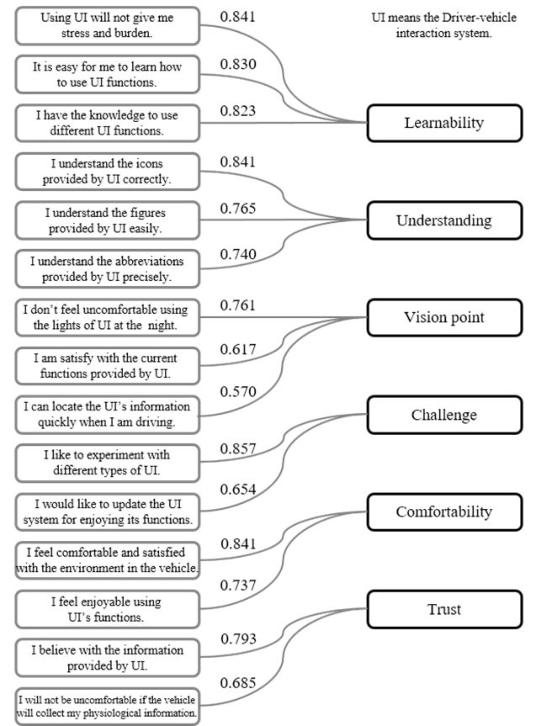
RESULTS AND DISCUSSIONS After fixing the component number to six, the variables experienced several iterations to reduce ambiguous variables. Fifteen items were kept and classi- fied into six clusters. To establish the connection between items with latent clusters, an item should have a loading value over .4043 to only one cluster (Laura, Jason, and Muriel, 2004). Based on the common point of items in the same cluster that had the loading values over 0.4, the clusters were rena- med as learnability, understanding, vision point, challenge, comfortability, and trust. The relationship between the clusters with variables were shown in Figure 2.
From Figure 2, the factor loading of each item was over 0.5, ranging from 0.570 to 0.857. The result showed that the corresponding relationship between the items and the clusters was high.
About the validity of the questionnaire, the result can be obtained through Exploratory Factor Analysis at the same time. The KMO result of the itera- ted questionnaire was.776, and Bartlett’s Test of Sphericity was significant (p<0.001). The results indicated that the iterated questionnaire has a well structural validity which was illustrated in Table 1.
To clarify the truth of respondents’ opinions in the questionnaire, Reliabi- lity Analysis was applied. To confirm the correlations between the questions in one cluster, Corrected Item-Total Correlation values should be over 0.4 (Eleanor, Richard and Dale, 2002). From the Table 1, all Corrected Item-Total Correlation values of learnability, understanding, vision point, challenge, comfortability’s question items were over 0.4. The Cronbach⣙s Alpha values of those factors ranged from 0.633 to 0.849, which meant those factors can be accepted (Martin and Douglas, 1997). In conclusion, the result sho- wed that the factors of learnability, understanding, vision point, challenge, comfortability had high reliability.
Therefore, the proposed model is usable for obtaining the user require- ments of the driver-vehicle interaction system in China.
Modeling User Requirements for Driver-Vehicle Interaction System in China 43
Figure 2: Relationship between clusters and variables.Table 1. The results of Reliability and Validity for the research questionnaire.
CONCLUDING REMARKS Considering the interaction progress in driver-vehicle interaction system and human feeling factors, the research proposed a user requirement model with six clusters, and a questionnaire was constructed that extended from the model through AT-ONE method. With the data analysis results from the
questionnaire samples, a user requirement model was established and proved that be useful to provide the basic theoretical framework for driver-vehicle interaction system design in China. it also provides a new method for the user requirements construction. The study may contribute to developing a guideline for automobile manufacturers to user requirements survey. Mea- nwhile, the research selected to design and iterate a questionnaire based on the proposed model rather than applying existing questionnaires, which was another innovation of the research, and the questionnaire can be referred to by other similar studies to develop the user research.
On the limitation of the study, the reliability analysis of the trust cluster shows the questions referred to it were not convincing. One possible reason for this is that the sample number was not huge enough, which may influence the reliable perceptions of drivers. In the future, trust will be investigated further. We may receive a better result by designing the prototype of driver- vehicle interaction for volunteers to operate.
FUNDING SOURCE This research received a grant from Japan Science and Technology Agency Next Generation Researcher Challenging Research Program.
REFERENCES
Brett, W., Andrys, O. and Ted, B. (2010) ‘Exploratory factor analysis: A five-step guide for novices’, Journal of Emergency Primary Health Care. 8(3), doi: https: //doi.org/10.33151/ajp.8.3.93 Ching-Fu, C. and Pei-Chun, C. (2011) ‘Applying the TAM to Travelers’ Usage Intenti-
ons of GPS Devices’, Expert Systems with Applications, 38(5), pp. 6217–6221.doi: https://doi.org/10.1016/j.eswa.2010.11.047 Donald, A. N. (2007) The Design of Future Things. New York: Basic Books. Dongyan, L. and Xuan, B. (2008) Car Purchasing Behaviour in Beijing: An Empirical Investigation. Master’s thesis, University of Umeå. Available at: https://www.di va-portal.org/smash/get/diva2:142148/FULLTEXT01.pdf (Accessed: 7 February 2022). Eleanor, T. L., Richard, T. W. and Dale, L. G. (2002). ‘WebQual: A measure of website
quality’ in K R. Evans, L K. Scheer (eds), AMA Conference Proceedings Winter Educators’ Conference, American Marketing Association, Chicago, vol. 13: 432. Eva, F. and Barbara, L. (2016). ‘Societal and Individual Acceptance of Autonomous Driving’, in Maurer, M., Gerdes, J., Lenz B., Winner H. (eds.) Autonomous driving Berlin: Springer Berlin Heidelberg, pp. 621-640. Franziska, H., Matthias, B. and Josef, F. K. (2018). ‘Driving comfort, enjoyment and acceptance of automated driving – effects of drivers’ age and driving style familiarity’, Ergonomics. 61(8), pp. 1017–1032.doi: https://doi.org/10.1080/00140139.2018.1441448 Fred, D. D., Richard, P. B. and Paul, R.W. (1989) ‘User Acceptance of Computer
Technology: A Comparison of Two Theoretical Models’, Management Science, 35(8), pp. 903–1028.doi: https://doi.org/10.1287/mnsc.35.8.982 J Martin, B. and Douglas, G. A. (1997). ‘Statistics notes: Cronbach’s alpha’, The BMJ. 314, pp. 572.doi: https://doi.org/10.1136/bmj.314.7080.572 Joseph, F. H. et al. (1995) Multivariate data analysis. 4th edn. New Jersey: Prentice-
Hall.
Modeling User Requirements for Driver-Vehicle Interaction System in China 45
Henrik, D. et al. (2021) ‘How to Increase Automated Vehicles’ Acceptance through In-Vehicle Interaction Design: A Review’, International Journal of Human–Computer Interaction, 37(4), pp. 308–330.doi: https://doi.org/10.1080/ 10447318.2020.1860517 Henry, F. K. (1960) ‘The Application of Electronic Computers to Factor Analysis’,
Educational and Psychological Measurement, 20(1), pp. 141–151.doi: https://do i.org/10.1177/001316446002000116 John, B. et al. (2009) ‘Clarifying the Integration of Trust and TAM in E-Commerce Environments: Implications for Systems Design and Management’, IEEE Transa- ctions on Engineering Management, 57(3), pp. 380-393.doi: https://doi.org/10. 1109/TEM.2009.2023111 Laura, L. S., Jason, W. B. and Muriel, J. B. (2004) ‘Factor Analysis as a Tool for
Survey Analysis Using a Professional Role Orientation Inventory as an Example’, Physical Therapy, 84(9), pp. 784–799.doi: https://doi.org/10.1093/ptj/84.9.784 Ministry of Public Sucurity (2022) In 2021, the national motor vehicle ownership will reach 395 million, and new energy vehicles will increase by 59.25%. Available at: https://www.mps.gov.cn/n2254314/n6409334/c8322353/content.ht ml (Accessed: 20 January 2022). Sergio, D., Enrica, D. and Luisa, A. (2009) ‘Driver-vehicle interfaces and interaction:
where are they going?’, European Transport Research Review, 1, pp. 87–96.doi: https://doi.org/10.1007/s12544-009-0009-2 Simon, C. (2016) How to design better services: the at-one book. Olso: Olso School of Architecture and Design.
LISTED IN THE AHFE DIGITAL BOOKSTORE CATALOGUE
Explore the complete digital volume
Ergonomics In Design
Read this individual research paper free through the original publisher, or explore the full digital proceedings book.
ISBN 978-1-958651-23-0
Explore this ISBN in the AHFE Bookstore ↗Listed in the July 2026 bookstore catalogue; search by ISBN to confirm current availability · Digital book purchase optional