Baoqi Zhou, Wang Haining, Ziyao Zhao (2022). Large-scale Chinese FSTT Database for Finite Element Modeling. In: Ergonomics In Design. AHFE Open Access, vol. 47, pp. 92–97. https://doi.org/10.54941/ahfe1001924
Facial soft tissue thickness (FSTT), together with the representive 3D headform, is of great importance to develop finite element models (FEM) for virtual simulation of head worn products to achieve safety as well as comfort experience. The FEM is a widely used approach for numerically solving differential equations arising in engineering and mathematical modeling, which can be used to determine the distribution stresses and deformations between the wearables and the human body, as well as providing strong support for ergonomics product design. Although several countries around the world have established FSTT databases, to the best of our knowledge, no large-scale dataset or analysis has ever been reported in China.In this paper, FSTT was measured at 17 anthropological landmarks on heads using computerized tomography (CT) of 1174 Chinese adults aged between 18 to 90, which were collected and processed from the First Hospital of Changsha in China. All landmarks were located in 17 craniofacial anthropological regions. For each landmark, basic descriptive statistics were calculated. FSTT values classified by gender and age groups were analyzed to assess the variation in FSTT within these categories.The results indicate that certain FSTT values are correlated with age and gender categories. For example, it was found that men generally have higher FSTT than women at certain landmarks, while regions around the temporal bone show opposite results. For age categories, quite a few landmarks show a general decrease with age.
The finite element (FE) analysis technique has been widely used in ergonomic product design and the research on injury mechanisms during last decades. It is practical to examine the intracranial distributions of stress, strain and pressure using finite element models and correlate these directly with injuries. Several studies have assessed the FEM on cranial facial region and investiga- ted influencing factors such as population, gender, and age. For the study of injury mechanisms, FEMs of the human brain are important tools to understand and mitigate traumatic brain injury. In many practical cases in medicine and dentistry, where research on the mechanism of injuries caused by the impact is not viable in vivo, the results calculated from the virtual FE analysis are the only available references (Coto et al., 2012). In addi- tion to medicine and dentistry which are beneficiaries of this undertaking,
Large-Scale Chinese FSTT Database for Finite Element Modeling 93
there are other applications on anthropometry-based contexts such as ergo- nomics product design (Caple et al., 2016), especially of head-worn products. A FEM can provide various useful information for wearable product design. For example, FEM had been used to determine and visualize the distribution stresses and deformations between wearables and the human body (Caple et al., 2012). A product designed based on the FE analysis, therefore, could be resulted in gaining a higher user satisfaction on fit, comfort, safety and usability.
The quality of FE results is dependent on the quality of the 3D model which is developed based on idealized geometry and material properties. The FSTT plays an important role in assigning the appropriate boundary for wearable product design. In previous studies, the FEM were normally established by head magnetic resonance imaging (MRI) or CT for boun- dary assigning with a certain sample size, which could help obtain an accurate model but have a relatively low representativeness for a certain population.
For now, the research on the FSTT database have been extensive in many countries around the world. More than 100 studies exist ranging in publi- cation dates from 1883 to 2020. The sample sizes have been broad, ranging from 1 to 967 individuals. (Stéphane et al., 2006) reported a large-scale study on 967 Caucasian subjects to improve the representativeness of the sampling over different subcategories. Many population groups had been investiga- ted including the Australian Aborigines, non-aboriginal Australians, Black Americans, British, Chinese, Egyptians, Germans, Japanese, Swiss, and Zulus (Stephan et al., 2006). However, the population addressing Chinese FSTT is scarce. (Chen et al., 2011) published a study on 425 Chinese subjects using MRI data in 2011 and found that the age-related and sex-age interactions were statistically significant at all landmarks. (Chung et al., 2015) built a Taiwanese FSTT database by CT in 2015. (Wang et al., 2016) conducted a study aimed at Xinjiang han population with X- rays in 2016. Besides, (Shui et al., 2016) published a study of densely calculated FSTT on 100 Chinese subjects with CT and provided a new perspective in understanding the distribution of FSTT and the construction of a new densely calculated FSTT database. Recently, (Deng et al., 2020) reported a study on the Yangtze River delta Han population with CBCT and establish a total of 60 facial landmarks.
Even though there are several FSTT databases in China, representative conclusions can’t be obtained due to small sample sizes. Besides, different cra- niofacial regions are with different FSTT values, however, not all landmarks selected in previous studies were considered to cover all regions. This study aimed to use over 1000 Chinese CT head scans to access and analyze FSTT that could cover all craniofacial regions.
This study was designed to extend the growing population-specific data- bases by quantifying the FSTT of the Chinese population using MSCT scans and to improve our knowledge of the human facial soft tissue. The results will provide insight into the further investigation on FEM for Chinese population and help improve the accuracy and reliability of finite element analysis.
FSTT MEASUREMENT
Materials and Methods
A total of 1174 subjects (635 males and 539 females) aged between 18-90 were selected from the Chinese MSCT database for this study. All subjects were divided into 8 age groups: 20–, 21–30, 31–40, 41–50, 51–60, 61–70, 71–80, and 80+ as there were no substantial variations of FSTT within these age ranges having an interval of 10 years (Sandamini et al., 2018). The CT scans of all subjects were from the First Hospital of Changsha with the approval of the ethical committee of the hospital. Subjects with head trauma, fractures, swellings, malformations, distortions, or any abnorma- lity that could influence the head shape or thickness of the soft tissues and musculature, were eliminated from the database.
All scans were acquired from an MSCT machine (GE Revolution CT, Ame- rica) in a head-first supine position for purposes unrelated to the current study. The series was recorded using an effective tube current of 10 mA, at a cube voltage of 120 kV, with an effective slice increment of 0.625 mm. The raw data were directly downloaded from the hard drive of the MSCT scanner and were saved on an external hard drive in Digital Imaging and Communi- cations in Medicine (DICOM) format. All file names were replaced by serial numbers to protect the privacy of the patients.
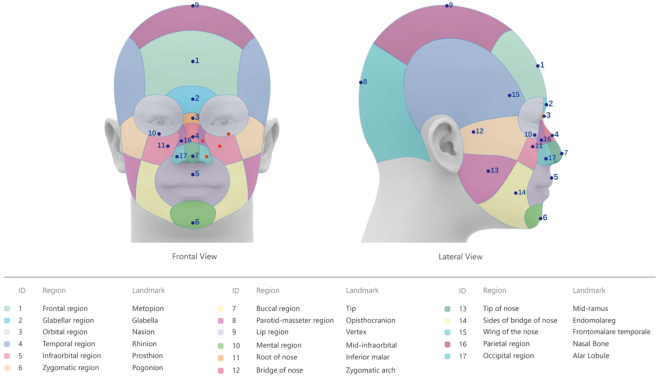
3D Craniofacial images were created from the DICOM data acquired from the MSCT scans using Mimics 21(Materialise NV, Leuven, Belgium). The Frankfort horizontal (FH) plane and sagittal reference plane were used to help position the craniometric landmarks. The soft tissue surface meshes were constructed with an adjustment of the Hounsfield Unit (HU) to obtain clear measurements. A 50th percentile 3D Chinese reference head model created by (Wang et al., 2018) was adopted in this study. The craniofacial model was divided into 17 regions based on the anatomy research paper (Pansky et al., 2013; Schuenke et al., 2016; Paulsen et al., 2013; Zarins, 2018). As sites for the facial tissue thickness measurements, 17 landmarks were selected from sites advocated by (Stéphane et al., 2006; Çavu¸s et al., 2020; Caple et al., 2016) to obtain representative FSTT measurements, landmarks that are closest to each regional center were identified and selected. Only one landmark was chosen for each region. Figure 1 shows the correlation between facial regions and landmarks. In this study, all craniometric landmarks were measured perpendicular to the bone except the only landmark (alar lobule) located on the skin surface because there is no hard tissue exists in this region.
To minimize the measurement error, each sample was checked and cor- rected by a single experienced investigator to eliminate inter-observer error after landmark identification. Statistical analysis was performed using the IBM SPSS Statistics 26 (IBM Corp., Armonk, NY, USA).
Statistical Analysis The mean and standard deviation values were calculated in different age groups of males and females and expressed as the type of mean±SD. General descriptive statistics were computed for each landmark, and the differences
Large-Scale Chinese FSTT Database for Finite Element Modeling 95
Figure 1: Facial regions and landmarks.
between mean values for males and females were compared using t-tests. Kendall’s correlation analysis was used to compare the mean values among age categories. The effect of gender and age, as well as the gender age intera- ctions, were also evaluated. In this study, the p-value of 0.05 was considered as the level of significance.
Results for Descriptive Statistics
Table 1 reports the FSTT results for males and females at 17 facial landmarks. The measurements are presented in millimeters and rounded to two fractional digits. It provides the statistics including mean, standard deviation, as well as the number of involved samples in the analysis of the 17 landmarks.
Gender-based Differences For the comparisons performed between gender categories, men generally have higher FSTT than women. Almost all landmarks along the midline of males show higher FSTT than females besides the vertex. The bilateral regions around the temporal bone (represented by the zygomatic Arch and fronto- malare temporale) show comparatively larger tissue thickness in women than in men.
Age-based Differences As an influencing factor on FSTT, age’s effect has been reported diversely in different previous studies. In this study, FSTT at 9 landmarks was found to be statistically different between age categories. A decrease was observed in soft tissue thickness values with an increase in age group at 6 landmarks (metopion, prosthion, opisthocranion, mid-ramus (R, L), endomolareg (R, L), alar lobule (R, L)), which may be attributed to the reduction of muscle
strength (Sandamini et al., 2018). For the other 3 landmarks (rhinion, mid- infraorbital (R, L), inferior malar (R, L)), it was observed that the old have higher soft tissue values compared to the young.
CONCLUSION
In conclusion, facial soft tissue thickness trends of the 18–90 age group in China were explored in this research. This study presented the basic descri- ptive statistics for each landmark and evaluated the statistical significance of FSTT values within the age and gender categories for the Chinese population. The results show that men generally have higher FSTT than women, and 9 of 17 landmarks was found to be statistically different between age categories. The statistics of these FSTT data can be utilized for FEM establishment for head worn product design towards Chinese customers.
ACKNOWLEDGMENT
The data collection and measurement stages of this project were supported by the First Hospital of Changsha and the School of Design of Hunan Uni- versity. The authors also acknowledge the support of prof. Haining Wang in providing the 3D Chinese reference head model and the advice on FSTT measurements, and of Ziyao Zhao for her assistance with the FE analysis technique.
REFERENCES
Caple, J., and Stephan, C. N. (2016). “A standardized nomenclature for craniofacial and facial anthropometry.” International journal of legal medicine, 130(3), 863–879.
Large-Scale Chinese FSTT Database for Finite Element Modeling 97
Çavu¸s Özkan, M., Ye¸sil, F., Bayramiçli, ˙I., and Bayramiçli, M. (2020). “Soft tissue thickness variations of the nose: a radiological study.” Aesthetic Surgery Journal, 40(7), 711–718. Chen, F., Chen, Y., Yu, Y., Qiang, Y., Liu, M., Fulton, D., and Chen, T. (2011). “Age
and sex related measurement of craniofacial soft tissue thickness and nasal profile in the Chinese population.” Forensic science international, 212(1-3), 272-e1. Chung, J. H., Chen, H. T., Hsu, W. Y., Huang, G. S., and Shaw, K. P. (2015). “A CT-scan database for the facial soft tissue thickness of Taiwan adults.” Forensic science international, 253, 132-e1. Coto, N. P., Meira, J. B. C., e Dias, R. B., Driemeier, L., de Oliveira Roveri, G., and
Noritomi, P. Y. (2012). “Assessment of nose protector for sport activities: finite element analysis.” Dental traumatology, 28(2), 108–113. De Greef, S., Claes, P., Vandermeulen, D., Mollemans, W., Suetens, P., and Willems, G. (2006). “Large-scale in-vivo Caucasian facial soft tissue thickness database for craniofacial reconstruction.” Forensic science international, 159, S126–S146. Deng, C., Wang, D., Chen, J., Li, K., Yang, M., Chen, Z., ... and Chen, F. (2020).
“Facial soft tissue thickness in Yangtze River delta Han population: Accurate assessment and comparative analysis utilizing Cone-Beam CT.” Legal Medicine, 44, 101693. Pansky, B., and Gest, T. R. (2013). Lippincott’s Concise Illustrated Anatomy: Head & Neck. Lippincott Williams & Wilkins. Paulsen, F., and Waschke, J. (2013). Sobotta Atlas of Human Anatomy, Vol. 3,
English: Head, Neck and Neuroanatomy. Urban & Fischer Verlag/Elsevier GmbH. Sandamini, H., Jayawardena, A., Batuwitage, L., Rajapakse, R., Karunaratna, D., Vidanapathirana, M., and Pallewatte, A. (2018). “Facial soft tissue thickness trends for selected age groups of Sri Lankan adult population.” Forensic science international, 293, 102-e1. Schuenke, M., Schulte, E., and Schumacher, U. (2016). Thieme Atlas of Anatomy,
Volume 3: Head, Neck and Neuroanatomy, 2nd ed. New York, Stuttgart, Delhi, Rio de Janeiro: Thieme Medical Publishers. Shui, W., Zhou, M., Deng, Q., Wu, Z., Ji, Y., Li, K., ... and Jiang, H. (2016). “Densely calculated facial soft tissue thickness for craniofacial reconstruction in Chinese adults.” Forensic science international, 266, 573-e1. Stephan, C. N., and Simpson, E. K. (2008). “Facial soft tissue depths in craniofacial
identification (part I): an analytical review of the published adult data.” Journal of Forensic Sciences, 53(6), 1257–1272. Wang, H., Chen, W., Li, Y., Yu, Y., Yang, W., and Ball, R. (2018, July). “A 3D Head Model Fitting Method Using Chinese Head Anthropometric Data.” In International Conference on Cross-Cultural Design (pp. 203-215). Springer, Cham. Wang, J., Zhao, X., Mi, C., and Raza, I. (2016). “The study on facial soft tissue
thickness using Han population in Xinjiang.” Forensic Science International, 266, 585-e1. Zarins, U. (2018). Anatomy of Facial Expressions. 3rd ed. Seattle, WA, USA: Exonicus, Inc.
LISTED IN THE AHFE DIGITAL BOOKSTORE CATALOGUE
Explore the complete digital volume
Ergonomics In Design
Read this individual research paper free through the original publisher, or explore the full digital proceedings book.
ISBN 978-1-958651-23-0
Explore this ISBN in the AHFE Bookstore ↗Listed in the July 2026 bookstore catalogue; search by ISBN to confirm current availability · Digital book purchase optional