Wang Haining, K Liu, Yan Yan, Chang Liu (2022). External Ear Shape Classification of Chinese Adults for Ergonomic Product Design. In: Ergonomics In Design. AHFE Open Access, vol. 47, pp. 120–126. https://doi.org/10.54941/ahfe1001928
Understanding the complex external ear shape is crucial to the ergonomic design of ear worn products such as earphones and hearing-aids. The purpose of this study is to classify the external ear shapes (including auricle, concha and external auditory canal) based on fifteen anthropometric measurements extracted from 1180 Chinese adults aged between 18 and 65. Multivariate analysis adopted in this study contains two steps. First, the principal component analysis (PCA) was performed on these ear measurements to derive the underlying components of ear shape, and nine principal components were derived. Agglomerative Hierarchical Clustering (AHC) and kmeans clustering were conducted in succession, and the external ear shape was categorized into five clusters accordingly. The representative ear model for each cluster was rebuilt and relating ear measurements were presented. The results of this paper can facilitate the mass-production as well as improving the wearing comfort of ear-related products.
As one of the most complex organs of human body, the external ear consists of three parts: auricle, external auditory canal, and the inner end of which is closed by the tympanic membrane (Encyclopedia Britannica, 2020), the first two regions are highly relevant to ear-worn devices such as True Wireless Ste- reo (TWS) earphones and hearing aids. The concha of the auricle is a cavity where most of the ear-worn devices contact, therefore, it’s important to inve- stigate the complex geometry of ear shapes to benefit the ergonomic product design, virtual simulation and usability test. With the rapid development of 3D digital anthropometry, several studies have been conducted based on high- resolution ear scans (Chiou et al., 2016; Lee et al., 2018; Fu et al., 2018). Evident differences of ear morphology between races and genders were obse- rved according to (Deopa et al., 2013; Murgod et al., 2013; Lee et al., 2018; Fan et al., 2019).
Multivariate statistical methods are frequently used for analysis of anth- ropometric data (Zehner et al., 1993). (Fan et al., 2019) conducted PCA on eighteen manually-measured ear dimensions to derive principal factors which were associated with the ear shape variations. (Ban et al., 2020)
External Ear Shape Classification of Chinese Adults for Ergonomic Product Design 121
performed exploratory factor analysis and hierarchical cluster analysis on sixteen measurements collected from 3D scans, by which the ear shapes of 310 participants (186 Koreans and 124 Caucasians) were categorized into four groups: round, rectangular, triangular, and inverted triangular. (Guo, et al., 2021) classified 100 Chinese subjects into eight clusters through hierarchical cluster analysis based on fifteen parameters extracted from the auricle scans. The Measurement category is considered as an effective method to determine factors associated with the human body shapes and ergonomic risks for design (Fan et al., 2019). However, to the best of my knowledge, ear canal which plays an important role in ear-related product design, has not been included in studies related to external ear shape classification.
Thus, this study aims to perform statistical ear shape classification with Chinese anthropometric data using measurements extracted from 1180 exter- nal ear scans. Multivariate analysis used in this paper consists of two steps. Firstly, the principal components of the ear shape were derived by PCA. Secondly, based on the result of the dimension reduction, external ear sha- pes were then classified into five clusters, which can be utilized for product design in the future.
METHODS
Data Sources and Measurements The anthropometric measurements were extracted from the enriched survey of Chinese Headbase (Wang et al., 2018). 1180 Chinese adults aged between 18 and 65 (half males and half females) were recruited from seven major geo- graphical regions of China considering the population diversity according to the ISO 15535:2012-General requirements for establishing anthropometric databases. Non-contact 3D scanners including the Artec Spider (Artec Group, Luxembourg) 3D scanner and 3Shape phoenix (3Shape Audio, Copenhagen) in-ear scanner were utilized for the data acquisition.
Anthropometric measurements relevant to ear-related products were extra- cted and calculated using Geomagic Wrap 2017 (3D Systems, Rock Hill, SC, US), from which 15 dimensions of right external ears were chosen for multivariate statistical analysis in this study.
Multivariate Statistical Analysis In this paper, multivariate statistical techniques which include PCA and clu- stering were performed on fifteen anthropometric measurements by IBM SPSS Statistics 26 (IBM Corp., Armonk, NY, USA).
PCA is widely used data reduction procedure to transform the originally measured variables into a small number of derived variables with little loss of information based on their correlation or co-variance (Joliffe and Morgan, 1992). To better describe the underlying trend and variation of ear shape, standardization was first performed on these fifteen anthropometric measu- rements which were considered variables. The aim was to transform initial measurements on different scales or on a common scale with widely differing
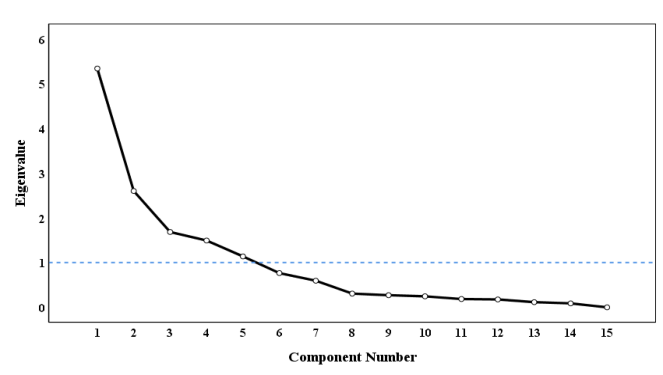
Figure 1: Scree plot of eigenvalues.
ranges to a standard scale, so that each variable can contribute the analysis equally (Richard, 2007).
Next, the clustering was performed to classify the ear shape based on PC scores of selected top-ranked PCs for each individual instead of original anth- ropometric measurements. The AHC algorithm was chosen to determine the number of clusters, which starts with each point as a cluster and then mer- ges two clusters per iteration according to pairwise distances, until all the points are merged into one cluster. The Ward’s linkage and squared Euclidean distance were adopted as the linkage criteria and the distance metric. The whole procedure was visualized in a tree-like structure called dendrogram. The k-means clustering algorithm was subsequently conducted according to (Shalizi, 2009) to categorize all the individuals into k clusters specified by the dendrogram.
RESULTS
Determination of Principal Components PCA was conducted to analyze the underlying components of fifteen varia- bles, aiming to explain the variance of the ear shape. KMO and Bartlett’s Test were performed to measures strength of the relationship among 15 variables. The result showed the KMO MSA of 0.687 with a significance of 0.000, indicating a strong relationship between the variables. The varimax rotation method was implemented following by PCA for more intuitive interpretation of components.
The number of principal components (PCs) was selected based on three criteria: (1) retaining any component with eigenvalue greater than 1 (Kai- ser criterion); (2) the cumulative percentage of variance accounted for; and (3) scree plot. In this study, first five PCs with eigenvalue greater than 1 accounted for 81.676% of the total variation, moreover, a sharp change in the slopes of the scree plot (seen in Figure 1) also indicated five as the optimal
External Ear Shape Classification of Chinese Adults for Ergonomic Product Design 123
Table 1. The eigenvalues and percentage of variance of first five PCs.
Cavum concha depth CCD .184 .135 .085 .079 .892 Intertragic incisure to medial concha depth Extraction Method: Principal Component Analysis. Rotation Method: Varimax with Kaiser Normalization. Rotation converged in 6 iterations.
number of PCs. According to (Jolliffe, 2002), 81.676% of the cumulative pro- portion is sufficient enough for explaining the total variance of ear shape. The eigenvalues and percentage of variance of first five PCs is shown in Table 1. The rotated component matrix between each of the fifteen variables and five extracted estimated components is shown in Table 2.
PC1 with the largest eigenvalue of 5.338, which accounts for 35.584% of variance in PCA analysis, can be described as length of external ear, including auricle and concha. PC2 accounting for 17.330% of variance represents the change in width of auricle and concha. PC3 accounting for 11.220% of the variance represents the size of external ear canal. PC4 with 9.956% variance can be described as the change of the concha including the cavum concha
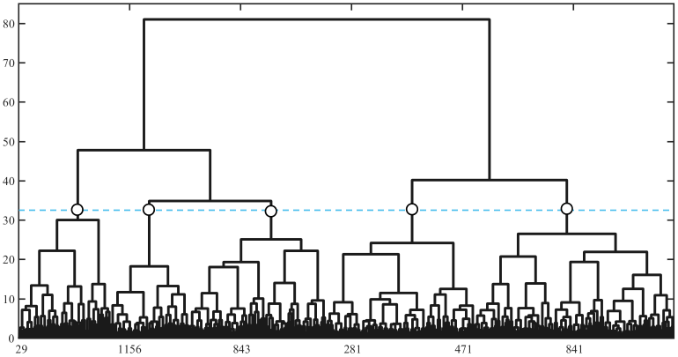
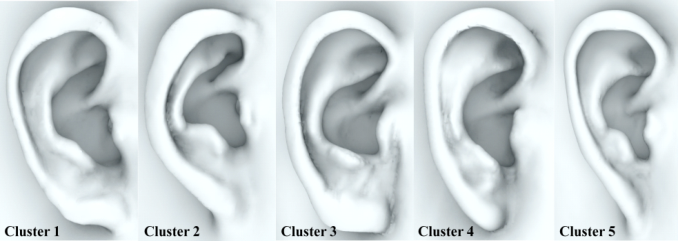
Figure 2: Dendrogram of AHC.Figure 3: Representative ear model of each cluster.
and cymba concha. PC5 accounting for 7.586% of the variance represents the depth of ear concha.
Ear Shape Categorization In the clustering stage, two clustering methods were conducted to classify the external ear shape according to PC’s scores of each individual. Firstly, the AHC method was used to identify the optimal number of clusters. The den- drogram showing the whole agglomerative procedure is shown in Figure 2. Based on the distance among clusters, the horizontal line cutting five ver- tical lines was selected. Next, k-means clustering was conducted to divide 1180 individuals into five clusters (cluster1: 17.2%, cluster2: 27.1%, clu- ster3: 19.2%, cluster4: 17.2%, cluster5: 19.3%). The one-way ANOVA was then performed on the difference in PC scores at a significance level of p <0.05. As a result, all five PCs showed a significance of 0.000, which indicates the statistical differences observed between ear shapes.
Cluster 1 has the largest PC score of PC3, and the smallest scores of PC4 and PC5. Cluster 2 has the smallest value of PC1, and the second large value of PC3. Besides, PC2 score of cluster3 is the largest, which has the second
External Ear Shape Classification of Chinese Adults for Ergonomic Product Design 125
Table 3. Representative ear measurements of each cluster.
large PC1 score. Cluster 4 with the largest PC1 score also has the second small PC2 score. Similarly, Cluster 5 has the largest scores of PC4 and PC5, as well as the smallest PC3 score. For each cluster, the external ear scan having the minimum distance with the center of cluster was chosen as the represen- tative model (as shown in Figure 3), together with its key measurements of corresponding PCs (refer to Table 3).
CONCLUSION
In this paper, multivariate statistical methods including PCA, AHC and k-means were performed on 15 measurements extracted from 3D high- resolution external ear scans including auricle, concha and ear canal, which aimed to classify the external ear shapes of Chinese population. Five princi- pal components were derived from original variables to describe the external ear shape, which accounted for 81.676% of the total variance. By conducting the varimax rotation, the first three PCs with 64.134% cumulative variance was found to have an intuitive correlation with the length and width of exter- nal ear, size of external ear canal respectively. Based on the PC scores, these 1180 subjects were categorized into five clusters by AHC and k-means meth- ods (cluster 1: 17.2%, cluster 2: 27.1%, cluster 3: 19.2%, cluster 4: 17.2%, cluster 5: 19.3%). The findings in this study will help industrial designers and human factor researchers to understand the complex shape of external ears and thus facilitate the ergonomic design of ear-worn products like TWS earphones and hearing aids. Further studies are required to find out the cor- respondence between external ears and ear-worn products to improve the utilization of the classification result.
REFERENCES
Ban, K., and Jung, E. S. (2020). Ear shape categorization for ergonomic product design. International Journal of Industrial Ergonomics, 80, 102962. Chiou, W. K., Huang, D. H., and Chen, B. H. (2016). Anthropometric measurements
of the external auditory canal for hearing protection earplug. Advances in Safety Management and Human Factors, pp. 163–171. Deopa, D., Thakkar, H., Prakash, C., Niranjan, R., and Barua, M. (2013). Anthropometric measurements of external ear of medical students in Uttarakhand Region. Journal of the Anatomical Society of India, 62(1), pp. 79–83. Encyclopedia Britannica. (2020). human ear. Available from: https://www. britannica.com/science/ear [accessed 12 February 2022].
Fan, H., Yu, S., Chu, J., Wang, M., Chen, D., Zhang, S., . . . Wang, N.
(2019). Anthropometric characteristics and product categorization of Chinese auricles for ergonomic design. International Journal of Industrial Ergonomics, 69, pp. 118–141. Fu, F., Luximon, Y., and Shah, P. (2018). A growth study of Chinese ears using 3D scanning. International Conference on Digital Human Modeling and Applications in Health, Safety, Ergonomics and Risk Management, pp. 54–63. Available from: Springer, Cham. Guo, Z., Lu, Y., Zhou, H., Li, Z., Fan, Y., and Yu, G. (2021). Anthropometric-based
clustering of pinnae and its application in personalizing HRTFs. International Journal of Industrial Ergonomics, 81, 103076. Joliffe, I., and Morgan, B. (1992). Principal component analysis and exploratory factor analysis. Statistical Methods in Medical Research, 1(1), pp. 69–95. Jolliffe, I. T. (2002). Principal Component Analysis, Second Edition. Lee, W., Yang, X., Jung, H., Bok, I., Kim, C., Kwon, O. and You, H. (2018). Anth-
ropometric analysis of 3D ear scans of Koreans and Caucasians for ear product design. Ergonomics, 61(11), pp. 1480–1495. Murgod, V., Angadi, P., Hallikerimath, S., and Kale, A. (2013). Anthropometric study of the external ear and its applicability in sex identification: assessed in an Indian sample. Australian Journal of Forensic Sciences, 45(4), pp. 431–444. Richard, A. J. (2007). Applied multivariate statistical analysis. Shalizi, C. (2009). Distances between clustering, hierarchical clustering. Lectures
notes. Wang, H., Yang, W., Yu, Y., Chen, W., and Ball, R. (2018). 3D digital anthropometric study on Chinese head and face. In Proceedings of 3DBODY. TECH 2018–9th Int. Conference and Exhibition on 3D Body Scanning and Processing Technologies, pp. 287–295. Zehner, G. F., Meindl, R. S., and Hudson, J. A. (1993). A Multivariate Anthropome-
tric Method for Crew Station Design.
LISTED IN THE AHFE DIGITAL BOOKSTORE CATALOGUE
Explore the complete digital volume
Ergonomics In Design
Read this individual research paper free through the original publisher, or explore the full digital proceedings book.
ISBN 978-1-958651-23-0
Explore this ISBN in the AHFE Bookstore ↗Listed in the July 2026 bookstore catalogue; search by ISBN to confirm current availability · Digital book purchase optional