Ruiguang Tan (2022). Research methods of product perceptual image recognition in Kansei Engineering. In: Kansei Engineering. AHFE Open Access, vol. 40, pp. 79–87. https://doi.org/10.54941/ahfe1001764
The paper studies the image recognition in Kansei engineering. Firstly, the development history of Kansei Engineering is reviewed. The early research object of ergonomics is the explicit physiological and psychological reaction generated after the interaction between human and artificial objects. This type of research object is characterized by objectivity, universality, stability and easiness to measure. Kansei Engineering extends the research object of ergonomics to the implicit psychological reaction generated by the interaction between human beings and artificial objects, which is characterized by subjectivity, difference, fuzziness and unpredictability.Secondly,the perceptual image of the product is discussed. Perceptual images in Kansei engineering are human's feelings and psychological expectations for artificial objects, as well as highly condensed and deep emotional activities. Different groups may have different perceptual images in different stages. In the study of perceptual image, it is necessary to clarify the subject and stage of the perceptual image. Thirdly, the method of product perceptual image recognition is studied. Perceptual image recognition can be divided into two stages: experiment and statistical analysis, which involves the acquisition, representation, modeling and mapping of user perceptual image with product modeling elements. Generally, the test method is to collect product sample pictures and product perceptual evaluation words, combine morphological analysis method and semantic difference method to form a questionnaire, and then select subjects for testing. A series of statistical analyses should be carried out on the questionnaire data, including factor analysis, cluster analysis, multidimensional scale analysis, artificial neural network analysis, etc. The aim of statistical analyses is to establish the mapping relationship between perceptual image and form. Finally, it points out the problems existing in perceptual image recognition, including "the purpose and subject of perceptual image recognition","Questions of subject representation". A more comprehensive research perspective and technical means should be established to study the above problems.
DEVELOPMENT BACKGROUND OF KANSEI ENGINEERING In 1970, starting with the comprehensive consideration of residents’ emoti- ons and desires in residential design, some of Japanese scholars studied how to concretize residents’ sensibility into engineering technology in residential
design. This technology was originally called “emotional engineering”. Mitsuo Nagamachi, an associate professor at the Faculty of Engineering of Hiroshima University, participated in this research and published “Emotio- nal Engineering Research” in the journal of Ergonomics in 1975, which is regarded as the beginning of the research on Kansei Engineering in Japan. However, the term Kansei Engineering was proposed by Kenichi Yamamoto, former chairman of Toyo KK Group (now Mazda Motor Group). In 1986, Yamamoto changed emotion Engineering to Kansei Engineering for the first time in his lecture titled “Car Culture” at the University of Michigan with the approval of Mitsuo Nagamachi. The reason that “kansei” was invented instead of “sensibility”, “perception” or “emotion” is that the Japanese do not think these words fully cover the Japanese sense of “kansei”. On the other hand, it also reflects Japan’s contribution in this field. In 1988, at the 10th International Conference on Ergonomics held in Sydney, emotion engineering was officially named “Kansei Engineering”. To reflect Japan’s originality in this field, its English name was officially set as “Kansei Engineering”, a com- bination of Japanese and English. This was the beginning of the official use of the term “Kansei Engineering”.
Kansei engineering is an extension of ergonomics. The early research object of ergonomics were mainly the explicit reaction patterns of human physi- ology and psychology in the process of human-machine interaction. These patterns are objective, universal, stable and easy to measure. The efficiency, physiological reactions (pain, sweating, fatigue, etc.) and emotions of human beings in the use of artificial objects depend more on human physiological characteristics. No matter which country or nationality the user belongs to, as long as he or she has similar physiological characteristics, his or her physi- ological reactions when using artificial objects are similar, and these reactions can be easily measured by means of self-report, observation or instruments.
The research object of Kansei Engineering is the more implicit psycho- logical reaction generated in (or after) the interaction between human and artificial objects, which is characterized by subjectivity, difference, fuzziness and unpredictability. For example, human’s preference, emotion and meaning association for artificial objects are not only related to human physiological characteristics, but also affected by human learned characteristics. The living environment of each regional group and individual is different, so their con- sciousness precipitation is different, and their cognition of external things may also be different. Harada Akira, the professor at Tsukuba University, pointed out, “The processing of kansei information depends on the psych- ological model of each individual. Therefore, the same information can be interpreted differently. This is the subjectivity of kansei” (Harada, 2002).
The development of Kansei Engineering comes from three social back- grounds. First, the logic of manufacturing has changed: as manufacturing technologies continue to spread and suppliers continue to increase, product quality differentiation becomes smaller. When consumers choose commodi- ties with similar prices, they increasingly rely on their preferences for the products, forming the so-called “buyer’s market”. Therefore, producers need to cater to the needs of consumers and change their production strategies and attitudes. Secondly, the development of neuroscience and psychology
Research Methods of Product Perceptual Image Recognition in Kansei Engineering 81
provides more scientific basis for explaining the perceptual world of human beings. Third, the development of computers, the Internet, sensors and other tools provide technical support for the quantitative study of perception.
PERCEPTUAL IMAGE OF PRODUCTS Kansei Engineering and Perceptual Image
Nagamachi believes that Kansei engineering is mainly “a customer-oriented product development technology, and a translation technology that converts customers’ feelings and images into design elements” (Nagamachi, 1995). Specifically, the research objects of kansei engineering mainly include three aspects (Nagamachi, 1995; Nagamachi, 2002). The first is to identify the perceptual image of customers from the perspective of psychology. How to rely on science and technology to make the “hidden” perceptual image expli- cit and concrete is the core of this work. The second is to deduce the design characteristics of artifacts from the perceptual image of users, including the establishment of kansei engineering computer-aided design system. The third is to construct the model and Human-Machine System of Kansei engineering.
Perceptual Image Perceptual image in Kansei engineering refers to human’s feelings towards objects and their psychological expectations for objects. It is a highly con- densed and deep emotional activity (Su et al., 2014) External stimuli are transmitted to the brain receptors to generate feelings, and a variety of sensory information is processed comprehensively by the brain to generate perception and cognition. When cognition is created in the brain, it is compa- red with experience and then elicits emotion, which can be expressed in words or other forms. For example, when customers book resort hotels through online platforms, they first obtain information such as price range, transpor- tation convenience, facility function and style, atmosphere, symbol and so on through words and pictures provided by online platforms. After comparing the above information with the schema stored in the brain, the customer will generate feelings and evaluations such as “convenient”, “warm”, “lovely”, “comfortable”, “cool”, “beautiful” and “ugly”, and then make a purchase decision. Perceptual image is not constant, it will be adjusted with the change of social culture, individual sensory experience, value judgment and so on.
Perceptual image has the characteristics of human subjectivity, so it is necessary to carry out in-depth research on the subject source of perceptual image and its function in the design process. In the process of a product development, the core stakeholders include brand owners, designers, poten- tial users and so on. Different groups may have different perceptual images in different stages. For example, when users choose (or customize) products, they will have perceptual images of the products in their brain, and after using the products, they will have perceptual images. In the process of product cre- ation, designers will also generate perceptual images (general expectations of products) in their brain after collecting and absorbing various informa- tion. Therefore, in the study of perceptual image, it is necessary to clarify its
82 Tan
subject and stage. To understand this problem, the perceptual image will not be regarded as a constant object. For example, in environmental design and development projects, it is often the case that there is a large deviation betw- een the perceptual image of designers and users, which ultimately leads to the dissatisfaction of users in the implemented works. When selecting subje- cts for the perceptual image test, the test results can not be simply generalized to users’ perceptual images, because subjects are only representatives of users.
PRODUCT PERCEPTUAL IMAGE RECOGNITION RESEARCH METHODS The research methods of product perceptual image recognition can be divided into two stages: experiment and statistical analysis, which involve the acqui- sition, representation, modeling and mapping of user perceptual image with product modeling elements. The experimental methods include questionnaire method, semantic difference method, oral analysis method, real-time rende- ring and so on. Statistical analysis and optimization methods include factor analysis, cluster analysis, multidimensional scale analysis, artificial neural network, fuzzy logic, genetic algorithm, etc.
Experimental Stage The working process of the experiment stage is as follows: collect and screen product sample pictures; Analyze the design elements of the product; Col- lect and screen product perceptual vocabularies; Combined with product sample pictures, perceptual vocabulary, semantic difference method to make questionnaires; Select subjects to test; Organize data.
Collect and Screen Product Sample Pictures Test samples are obtained by collecting product sample pictures or compu- ter aided simulation. In this process, personal aesthetic preference should be excluded as far as possible, and the sample number and sample types should be as large as possible.
1 Sample picture collection method: collect product sample pictures extensively by referring to relevant literature, product advertisements, pro- duct instructions, product related websites, manuals and other ways. Focus expert groups can be established to conduct preliminary screening of product samples and finally select N of the most representative images as experimental samples. According to the purpose of the study, image processing software is used to process the lightness and color of the product sample image, in order to reduce the cognitive bias of the sample.
2 Computer-aided simulation method: Computer-aided simulation method mainly uses Alias Image Studio, KeyShot, 3ds Max and other sof- tware to simulate rendering and generate product samples as the research object.
Analysis of Design Elements Accurate acquisition of product design elements is the basis of improved design. Design elements can be obtained by category hierarchy method (Luo
Research Methods of Product Perceptual Image Recognition in Kansei Engineering 83
and Pan, 2007) based on perceptual demand reasoning. Starting from the user’s perceptual demand for the product (i.e., level 0 perceptual concept), the design details can be obtained by qualitative inference. This process systema- tically excavates people’s perceptual needs for products and transforms them into design elements of products. The general procedure of the classification hierarchy method of Kansei Engineering (Nagamachi, 1995) is to take the design target as the level 0 parent concept and establish the level 1 concept through decomposition of the parent concept, which usually consists of 2 ~ 4 descriptive perceptual image words or statements. At this point, each word or sentence is decomposed to establish the level 2 conceptual system. In this way, level 3 system, Level 4 system,... Finally, until there is a specification or design element that can be used to guide the design of the product.
Collect and Screen Product Perceptual Words Collect perceptual words to describe or evaluate such products from various channels as far as possible (the number of the first phase can reach hundreds). Select words through discussion in the research group, and remove words that are duplicate or too similar in meaning.
Make Questionnaires Sample pictures, perceptual word pairs and a group of word pairs refle- cting the overall preference degree (like and dislike) were used to make a questionnaire combined with semantic difference method. Osgood believes that the selection of adjective pairs can be obtained from the three factors that distinguish languages: evaluation factors, activity factors and potential factors. For example, beauty/ugliness, elegance/vulgarity belong to evalu- ation factors, dynamic/static, bright/dark, eye-catching/unattractive belong to activity factors, strong/weak, light/heavy, masculine/feminine belong to potential factors.
Experiment Select subjects to fill in the questionnaire (the number of subjects should reach a certain number). The final survey data model can be described as follows:
[Equation or mathematical symbol available in the original paper PDF]
[Equation or mathematical symbol available in the original paper PDF]
Ak
11 Ak 12 Ak 13 . . . Ak 1J Ak
21 Ak 22 Ak 23 . . . Ak 2J . . . Ak
Equations and mathematical formulas are available in the original paper PDF.
ij . . . Ak IJ
I1 Ak
I2 Ak
I3 . . . Ak
Where, Ak
ij is the evaluation preference degree of the Kth evaluator for the Jth perceptual evaluation of the ith evaluation sample, and Ak ij is the prefere- nce degree of the “like or dislike” perceptual evaluation of the ith evaluation sample.
Oral analysis method can be used as a supplement to questionnaire method. Oral analysis method, also known as “thinking aloud”, obtains the cognitive activity information of subjects by analyzing their oral reports, and is an experimental method of “process research” in psychology.
84 Tan
Statistical Analysis Stage After the experiment, the questionnaire data should be sorted out and analyzed statistically. The contents include:
(1) Mean value and variance: The mean value and variance of the scores of all subjects for each group of perceptual words can reflect the overall view of this property: which end of perceptual evaluation is biased to and the size of differences in perceptual evaluation.
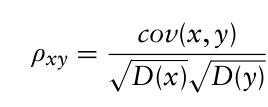
(2) Correlation coefficient: Through correlation coefficient matrix analy- sis, it can be speculated whether there is a correlation between subjects’ evaluation of the two groups of perceptual word pairs. For example, as the score of attribute A increases, the score of attribute B also increases, or as the score of attribute A increases, the score of attribute B decreases, then it can basically determine whether A and B are positively or negatively correla- ted. In fact, some samples lack some attributes in perceptual word pairs, so the subjects can be asked to take a blank way. If the majority of the subje- cts believe that the attribute is irrelevant to the majority of the samples, the word pair can be considered to be eliminated. Correlation analysis model is as follows:
Equation reproduced from the original PDF.
p D(x) D(y) p
p Where cov(x,y) represents the covariance of x and y, and D(x) D(y) is the product of the standard deviations of x and y.
cov(x,y) =E{[ Ai x -E(Ai x)] [Aiy - E (Aiy)]} D(x) =E[ Ai x -E(Ai x)] 2 E(Ai x) = ix (x =1, 2, …,j,…,J; y =1,2,…,j,…,J) According to the above statistical analysis results, the correlation coeffici- ent test method is adopted, when x = 1,2,..., j,... When j−1 and y = j, take α= 5%. According to the number of samples, the value of ρ1 can be obtai- ned by refering to the correlation coefficient table. When ρxJ >ρ1, it can be considered that the x kansei is related to consumers’ preference sensibility for products.
(3) Factor analysis: Factor analysis is a statistical method to simplify and analyze high-dimensional data. In the application of Kansei engineering, factor analysis is a multivariable statistical analysis method, which starts from studying the internal dependence of evaluation variables (many pairs of perceptual words) and reduces some variables with intricate relationsh- ips to a few comprehensive factors. The basic idea is to classify the observed variables, and classify the variables with high correlation into the same cate- gory, while the correlation between different kinds of variables is low. In fact, each type of variable represents a basic structure, that is, a common factor. The sum of a common factor multiplied by a certain coefficient, plus a spe- cial factor, represents the original variable. In this way, it is relatively easy to condense data by reflecting most of the original information with fewer factors.
(4) Cluster analysis: After dimensionality reduction of evaluation variables through factor analysis, the cognitive space is simplified. On the basis of
Research Methods of Product Perceptual Image Recognition in Kansei Engineering 85
factor analysis, cluster analysis can classify subjects with similar evaluation structure to find several types of subjects. After repeated randomized trials, users can be roughly categorized. Clustering is a process of classifying data into different classes or clusters, so objects in the same cluster have great similarity, while objects in different clusters have great difference.
(5) Multidimensional scale analysis: Multidimensional Scaling (MDS), also known as content structure analysis, is one of the Multidimensional variable analysis methods. Multidimensional scale analysis is a data analysis method that simplifies research objects (samples or variables) in multidimensional space to low-dimensional space for positioning, analysis and classification, while preserving the original relationships between objects. Its characteristic is that the sensory preference of the test sample is reflected in the multi- dimensional space in the form of points, and the degree of difference in the feeling or preference of different samples can be reflected by the distance between points. Generally, more dimensions will contain more information, while less dimensions will facilitate data analysis. Therefore, an appropri- ate dimension can contain most of the important information and facilitate data analysis. After determining the dimensions of space, it is necessary to accurately name the coordinate axes that construct space. The entire spatial structure needs to be interpreted and the reliability and validity of the meth- ods used needs to be assessed. The spatial axis represents the various factors or variables that enable the subject to form feelings or preferences about the sample.
(6) Artificial Neural Network (ANN) is a complex Network structure for- med by a large number of interconnected processing units (neurons). It is a kind of abstraction, simplification and simulation of human brain structure and operation mechanism. ANN is an information processing system based on the structure and function of brain neural network. ANN has a natu- ral advantage in mapping stereotyped knowledge and has a natural fuzzy association characteristic. At the same time, new knowledge can be learned, so as to constantly improve its knowledge structure. Therefore, the intelli- gent system based on neural network has irreplaceable advantages in practice, and has been successfully applied in the fields of pattern recognition, image processing, system identification, combinatorial optimization and automatic control. Among them, back-propagation neural network is a method often used in perceptual image research. It is a multi-layer network with learning ability. Its network framework includes input layer, hidden layer and output layer, and the hidden layer can be more than one layer. In the process of analy- sis, “product shape (or color)” can be taken as input and “perceptual image vocabulary” as output. In the reverse system, the process is reversed. In the learning process, the error between the inferred value of the network and the target output value is closer and closer, until the training is completed and the result is close to a reasonable range, the network can be called convergence. For example, Root mean square error (RM SE) can be used to represent the degree of convergence, and the formula is:
Equation reproduced from the original PDF.
86 Tan
where, Rj represents the convergence value, T[j] represents the target output value, Y[j] represents the inference value of the network, and Nout repre- sents the number of neurons at the output layer. It can be assumed that the convergence is good when the Rj value is less than a certain value. Howe- ver, there is no fixed solution to choose the degree of convergence, only after many executions to choose a smaller value as its convergence value. In this way, a complete two-way system of “perceptual image semantics - modeling parameters” and “modeling parameters - perceptual image semantics” can be established to assist designers to master the perceptual image of products and make the products designed more in line with the needs of users.
DISCUSSION
The recognition of perceptual image provides an important theoretical basis for establishing the mapping relationship between product modeling and user image. However, there are still many problems in the method of perceptual image recognition in design practice, including “the purpose and subject object of perceptual image recognition” and “the representativeness of sub- jects”. If perceptual image recognition is to provide user knowledge to designers in a design project, it must involve the study of specific potential user groups, such as elderly users, children users, male users, female users and so on. Through the establishment of kansei Engineering questionnaire, the perceptual image of potential users can be obtained, but potential users are sometimes a huge group. The selection of subjects should be as represen- tative of the user population as possible, so it is necessary to select different subjects multiple times for the experiment, and then take an average from the data. This kind of average perceptual image may be a common sense for many designers, which can be judged only by intuition. Therefore, this method of mining users’ perceptual image is of little use to designers. If perceptual image recognition is to establish an artificial intelligence design system, its applica- tion significance is more significant. Suppose there is an artificial intelligence household design system, the user according to personal preference, respecti- vely choose “modern”, “classical”, “industrial wind”, “luxurious”, “simple” and other words, the system can automatically generate different space style through the algorithm. To achieve this process, a mapping relationship betw- een perceptual vocabulary and product modeling should be established first. This mapping relies on machine learning. Therefore, what is obvious to the designer needs to be reduced to a mathematical model. Artificial intel- ligence is inevitable, but is there anything irreplaceable about designers? Where designers are irreplaceable is where artificial intelligence cannot imi- tate, which is precisely the most emotional and fascinating attribute of human beings.
REFERENCES
Harada A. (2002) Differentiation and Integration of Science in the 21st Century, Proceedings of the International Symposium on Art and Science, Wuhan: Hubei Fine Arts Publishing House, 103.
Research Methods of Product Perceptual Image Recognition in Kansei Engineering 87
Luo S., Pan Y. (2007) Research progress of Perceptual Image Theory and Its Application in Product Design [J]. Chinese journal of mechanical engineering, 43(3): 8–14. Nagamachi M. (1995) Kansei engineering: a new ergonomic consumer-oriented
technology for product development[J]. International Journal of Industrial Ergo- nomics, 15(1):3–11. Nagamachi M. (2002) Kansei engineering as a powerful consumer oriented technology for product development [J]. Applied Ergonomics, 33(3): 289–294. Su J., Zhang Q., Zhang S., et al. (2014) Research progress on evolutionary Design of
Product Image modeling [J]. Journal of machine design, 31(2): 97–102.
LISTED IN THE AHFE DIGITAL BOOKSTORE CATALOGUE
Explore the complete digital volume
Kansei Engineering
Read this individual research paper free through the original publisher, or explore the full digital proceedings book.
ISBN 978-1-958651-16-2
Explore this ISBN in the AHFE Bookstore ↗Listed in the July 2026 bookstore catalogue; search by ISBN to confirm current availability · Digital book purchase optional