Jincheng Hu, Wenyu Wu, Zhijie Xia (2022). Evaluation of AI generation interface element layout based on aesthetics model. In: Ergonomics In Design. AHFE Open Access, vol. 47, pp. 367–372. https://doi.org/10.54941/ahfe1001958
AI-generated interface has been widely used in the field of e-commerce, however, the quality of the AI-generated interface cannot be guaranteed. In order to objectively evaluate the aesthetic quality of the elements layout of AI-generated interface, an aesthetic model was proposed based on graphics and psychological theories. The factor analysis method was used to analyze the 13 kinds of Aesthetic indicators proposed by Ngo, therefore the design variables that affect the overall interface aesthetics was reduced to balance, overall, conciseness, and rhythm, which simplifies the aesthetic model. In order to verify the feasibility of the model, took the interface generated by Alibaba Luban AI as an example, and used the Likert scale method to subjectively evaluated the interface. The experimental results show that the fit degree between the aesthetic model and the subjective evaluation result is high, which verify the important role of the aesthetic model in the optimization potential of the AI generated interface, and provide Rational basis for the interface design.
In the history of software development, interface design has not been paid attention to for a long time. However, the interface design of software can be compared to the shape design of industrial products, which is an impor- tant component of a product (Sonderegger, 2010). Therefore, the interface design should fully consider the user’s factors, which is a continuous process of designing satisfactory visual effects for end users. Ngo et al. Proposed a set of aesthetic evaluation method for interface element layout design, which is composed of 13 measurement features. Ngo et al. Verified the impact of these features on interface aesthetic, in order to obtain the highest aesthetic evalua- tion index of interface. With the rapid development of e-commerce platforms, e-commerce needs to reduce costs and greatly shorten banner production time. For this reason, Alibaba has developed LUBAN AI to automatically generate banner. This paper quantifies the esthetics of the interface generated by LUBAN AI, and verifies the potential of this method in optimizing the interface generated by AI. On the paper, the principal component analysis is
used to determine the number of common factors in the layout of human- computer interface form elements, and the factor analysis is used to calculate the weight value of each common factor, and finally the esthetics evaluation model of the layout design of human-computer interface form elements is obtained, which can help designers to design the interface layout and optimize the AI interface generation algorithm.
QUANTITATIVE INDICATORS OF HUMAN-COMPUTER INTERFACE The 13 quantitative indicators of human-computer interface proposed by Ngo are balance, equilibrium, equilibrium, order, cohesion, integrity, pro- portion, simplicity, density, regularity, economy, uniformity and rhythm (Ngo, 2003). The specific calculation formula is shown in Ngo reference. Balancing refers to the visual balance of the overall layout of the elements in the interface to the user’s perception. Equilibrium is a stable, intermediate suspension center. Equilibrium refers to the of equilibrium of each element in the interface in the vertical, horizontal and diagonal directions. The of order refers to the arrangement of objects in the layout, which helps the eye to move through the displayed information. Cohesion refers to the visual coordination of the width ratio of the interface elements to the frame layout. By analyzing the relationship between the layout of elements and the interface framework, the integrity is to determine the tightness of the layout of elements in the interface (Cyr D et al. 2010). Proportional refers to the to which proporti- onal values between interface elements and layouts are similar to common aesthetic proportional values. Simplicity is to determine the simplicity of the overall layout of the interface by calculating the of alignment or combina- tion of interface elements. Density is the to which the screen is covered by objects. Regularity is the consistency of elements based on some principle or plan. Economy is the careful and discreet use of display elements to convey information as simply as possible. Uniformity is closely related to entropy, and the author explains the concept of statistical entropy for screen design. Rhythm in design refers to the regularity of the change of elements. Rhythm, as the name suggests, is the to which objects are systematically arranged.
Research Methods First, the interface to be analyzed is processed, the hue is removed, all ele- ments are replaced by the largest circumscribed rectangle of black, and the background is replaced by pure white. The second step is to measure the coor- dinates of the upper left corner of the circumscribed rectangle of the element and the length and width of the rectangle, which is recorded as (x, y, w, h) (Ben-Bassat, 2006). The length and width of the entire interface are measu- red as W, H. The third step is to put the measured data into 13 quantitative interface esthetics indicators, and calculate the corresponding quantitative intention esthetics respectively. Repeating the above steps yields 13 quanti- fied intended esthetics values for a large number of interfaces. (15 samples were selected in this experiment). If the correlation matrix is a unit matrix, the variables are independent and the factor analysis method is invalid, which is judged by the spherical test of Bartlett’s. A better indicator of relevance is
Evaluation of AI Generation Interface Element Layout Based on Aesthetics Model 369
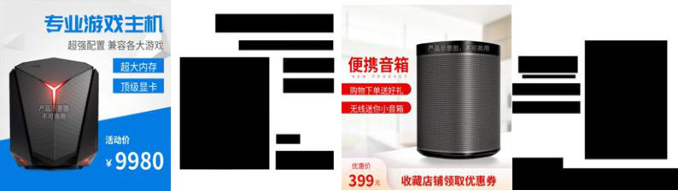
Figure 1: Interfaces generated by LUBAN and their element characterization and location.
the KMO test statistic, which takes a value between 0 and 1. The closer the KMO test statistic is to 1, the stronger the partial correlation between varia- bles and the better the effect of factor analysis. In the actual analysis, when the KMO test statistic is greater than 0.7, the effect of factor analysis is gene- rally better; When the KMO test statistic is less than 0.5, it is not suitable to apply the factor analysis method, and it should be considered to redesign the variable structure or use other statistical analysis methods. The fourth step is to use SPSS statistical software to test the correlation and independence of the samples. Whether it is suitable for factor analysis, if it is suitable for factor analysis, first use principal component analysis to determine the num- ber of common factors, and then use factor analysis to determine the weight and significance of common factors. The fifth step is to determine the obje- ctive function for calculating the overall esthetics according to the weight of each factor determined by the factor analysis method. The sixth step is to select 15 representative interfaces from the interfaces generated by Alibaba LUBAN AI for analysis and verification. Firstly, the objective function fitted by factor analysis is used to calculate the overall esthetics of the 15 inter- faces, and the values are sorted according to the calculated esthetics of the interfaces. The seventh step is to carry out the subjective evaluation expe- riment. 25 design students are selected to carry out the experiment on the selected 15 interfaces. Subjective evaluation, including 10 girls and 15 boys. Statistical analysis method was used to analyze the experimental data, and the subjective comprehensive evaluation index was obtained. Compare with that calculated objective comprehensive esthetic.
CASE STUDY Objective Data
15 Taobao interfaces generated by Alibaba LUBAN AI were selected for eva- luation. Firstly, the interface generated by AI is simplified, the influence of color on the experiment is eliminated, and the elements of the interface It is divided into text area, product display area, background area and display background block. Make the smallest bounding rectangle, fill it with black, and fill the background with white (see Figure 1).
According to the interface element layout evaluation quantitative index calculation formula, the balance of the five groups of prototype layout
schemes is carried out balancing, equilibrium, symmetry, sequence, cohesion, unity, proportion, simplicity, density, regularity, economy, homogeneity and rhythm.
It can be seen that the KMO test statistic is 0.718, which is greater than 0.7, indicating that the amount of overlapping information is acceptable. The P value was 0.000, indicating that the assumption of independent variables was rejected. The above correlation and independence tests show that it is possible to obtain a more satisfactory factor analysis model (Schmidt, 2009).
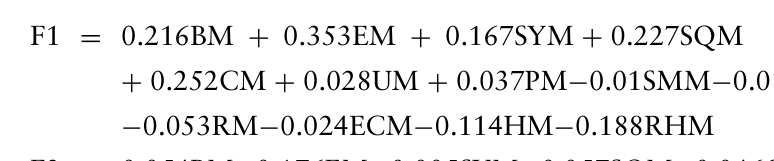
Wherein, F1, F2, F3 and F4 respectively represent common factor 1, com- mon factor 2, common factor 3 and common factor Son 4. Score stands for the comprehensive esthetics index (see Table 1).
Subjective Data Considering that users will be affected by the shape of interface elements, color purity and other factors when evaluating the interface, only the inter- face block diagram is presented when designing the questionnaire, and the samples are filled. In the questionnaire, interface 4 is selected as the reference of the median esthetics interface. Users were asked to compare 15 groups of samples and evaluate each interface using Likert’s five-point scale. The score is 1-5 from low to high. This questionnaire survey is mainly aimed at college students. A total of 49 valid questionnaires were collected in this survey, and the average scores of users are shown in Table 2.
After comparing the data obtained from subjective evaluation with the calculated objective comprehensive esthetics, it is found that: First The sub- jective scores obtained according to the subjective evaluation are arranged in descending order of scores as follows: Sample 9 > Sample 1 > Sample 11
Evaluation of AI Generation Interface Element Layout Based on Aesthetics Model 371
> Sample 10 > Sample 5 > Sample 6 > Sample 7 > Sample 8 > Sample 4 > Sample 2 > Sample 14 > Sample 3 > Sample 15 > Sample 13 > Sample 12. Compared with the results of Aesthetic Index calculation, in general, users show a higher acceptance of samples 1, 9, 11, and a lower acceptance of sam- ples 13, 12, 15. There is a certain order deviation between the samples, but in general, the subjective evaluation ranking is in good agreement with the eva- luation ranking of Aesthetic Index calculation. Second Generally speaking, the user’s subjective rating and preference ranking, to a certain extent, reflect that users have more preferences for samples 1, 9 and 11, and are more likely to accept samples 5, 6, 7 and 8, which is basically consistent with the ranking of Aesthetic Index calculation.
CONCLUSION
Based on the comprehensive analysis of the calculated results and the sub- jective evaluation results, the following conclusions are drawn: The main results are as follows: First It is feasible to use the factor analysis method to obtain the comprehensive interface esthetics value, which can replace the subjective evaluation index to a certain extent. Second Interface esthe- tics calculation, to some extent, can optimize the algorithm of AI interface generation. At the same time, the comprehensive results of Aesthetic Index calculation have certain reference significance, and provide reference for desi- gners to determine the design style. The result of Esthetics calculation can provide an evaluation method for interface design, which greatly reduces the cost of user research and improves the speed of interface design process. At the same time, it also provides rational evaluation reference for the design. However, there are some deficiencies in this paper. First Neglecting the influe- nce of other factors on the interface, such as color, element shape, etc., and not studying the interference between different element layouts. Second The sam- ple size of factor analysis is not enough to make the experimental results have a high reliability. Third The popular style of the interface will change with the times, and different people have different preferences for the interface, which will lead to the deviation of the experimental results.
REFERENCES
Ben-Bassat T, Meyer J, Tractinsky N. Economic and subjective measures of the perceived value of aesthetics and usability[J]. ACM Transactions on Computer-Human Interaction. 2006, 13(2): 210–234.
Cyr D, Head M, Larios H. Color appeal in website design within and across cultures: a multi-method evaluation[J]. International Journal of Human-Computer Studies. 2010, 68(1-2):1–21. Fogg B J, Soohoo C, Danielson D R, et al. How do users evaluate the credibi-
lity of Web sites?: a study with over 2,500 participants[C] |//Proceedings of the Conference on Designing for User Experiences. New York; ACM Press, 2003:1–15. Moshagen M, Jochen Musch, Anja S. Goritz. A blessing, not a curse: experimental evidence for beneficial effects of visual aesthetics on performance[J]. Ergonomics, 2009, 52(10): 131–1320. Ngo D C L, Teo L S, Byrne J G. Modelling interface aesthetics [J]. Information
Sciences, 2003, 152: 25–46. Schmidt K E, Liu Y L, Sridharan S. Webpage aesthetics, performance and usability: design variables and their effects[J]. Ergonomics, 2009, 52(6): 631-643. Sonderegger A, Sauer J. The influence of design aesthetics in usability testing: effects
on user performance and perceived usability[J]. Applied Ergonomics. 2010, 41(3): 403-410.
LISTED IN THE AHFE DIGITAL BOOKSTORE CATALOGUE
Explore the complete digital volume
Ergonomics In Design
Read this individual research paper free through the original publisher, or explore the full digital proceedings book.
ISBN 978-1-958651-23-0
Explore this ISBN in the AHFE Bookstore ↗Listed in the July 2026 bookstore catalogue; search by ISBN to confirm current availability · Digital book purchase optional