Mohammed Al Eisaei, Saif Al Harthi, Abdulla Alghafli, Ahmed Al Zaidy (2022). The use of Automated Traffic Enforcement methods by Abu Dhabi Police. In: Human Factors in Transportation. AHFE Open Access, vol. 60, pp. 402–413. https://doi.org/10.54941/ahfe1002472
The paper examines the use of three different automated traffic enforcement projects by Abu Dhabi Police, and their impact on traffic safety performance in terms of the number of traffic incidents and their resulting injuries. Dynamic speed management during adverse weather conditions, smart heavy vehicle management and automated tailgating enforcement were analyzed by taking into consideration the different traffic metrics associated with each project. All three enforcement systems proved to have positive results in terms of the number of traffic incidents and the injuries resulting from them.
DYNAMIC SPEED MANAGEMENT DURING ADVERSE WEATHER CONDITIONS Fog related traffic incidents were causing major road disasters on Abu Dhabi’s highway network due to the nature of fog density, low visibility and high posted speed limits on highways. In 2008, the largest traffic incident in the country’s history took place, where more than 200 cars piled up resulting in 277 injuries and 4 fatalities. Low visibility due to fog was the main rea- son to the pile up, in addition to the 140 kph (≈87 mph) posted speed limit which helped exacerbate the issue because of extremely low reaction times that drivers had when driving at or around that speed. In 2016, 3 other fog related incidents occurred again which resulted in a 65, 27 and 12 car pile-up on different highways in Abu Dhabi, with varying injuries resulting from but no fatalities. In early 2018, a 16-car pile-up forced the government to take immediate action to counter fog-related incidents and reduce the risk of inju- ries resulting from them. Therefore, Abu Dhabi Police was tasked to come up with an enforcement strategy to counter the issue. Abu Dhabi Police imple- mented the trial of dynamic speed management in 2019 where the system would be applied whenever weather conditions (fog, rain and sandstorms) reduced sight visibility to less than 200 meters. However, the project was initially put together in an effort by Abu Dhabi Police to reduce the num- ber of traffic incidents and associated risks/injuries occurring during foggy
The Use of Automated Traffic Enforcement Methods by Abu Dhabi Police 403
conditions precisely. Dynamic speed management refers to managing speed limits usually on highways with high posted speed limits, and reducing them based on traffic flow, weather and other road environment related variables. The concept behind dynamic speed management is not new in traffic safety or traffic management (Al-Ghamdi, A.S., 2007) (De Pauw et al., 2018) (Lee et al., 2006.) (Saha, P. et al., 2015). The literature on dynamic speed manage- ment suggests that implementing a reduction in speed is related to reducing the following metrics: number of incidents, injury severity and mean spe- eds (Al-Ghamdi, A.S., 2007.) found that implementing a variable speed limit when fog is present resulted in a 6.5 kph decrease in average speed. However, speed variability did not change after the implementation of a dynamic speed limit during fog. (De Pauw et al., 2018) found that implementing a dynamic speed limit reduced the number of injury traffic incidents by approximately 18%. (Lee et al., 2006) concluded that based on a microscopic traffic simu- lation model, the presence of a dynamic speed limit would reduce overall crash potential by 5% - 17%. (Saha, P. et al., 2015) concluded through their model which considered road geometry characteristics and extreme weather conditions, that the presence of variable speed limits is significant in reducing traffic incidents.
Smart Traffic Gateways and the Smart City Department at Abu Dhabi Police formed the basis of the trial project. Smart Traffic Gateways are gantries which are spread in numerous locations on the Abu Dhabi high- way network. Each gateway is equipped with the following equipment: speed camera, ANPR (Automatic Number Plate Recognition), Electronic Sign Board, Visibility Sensor and a CCTV. Speed cameras are used to enforce spee- ding traffic fines, ANPR is used to recognise various vehicle information using the number plate such as type, outstanding warrants and record vehicle loca- tions which can be used by law enforcement agencies. Electronic sign boards are used to display various electronic traffic awareness messages including but not limited to speed change, warning messages and detour notifications. The visibility sensor detects atmospheric transparency and output a sensor equivalent visibility (SEV) range that represents the maximum distance that the human eye can see under given atmospheric conditions. Finally, CCTV cameras are in place to provide real-time footage of the traffic flow within the vicinity of the gateway.
The Smart City Department at Abu Dhabi Police acts as a secondary police operations command centre whereas they have access to live traffic informa- tion which is being fed through the network of speed cameras (which include built-in ANPR) which includes more than 1,200 devices spread across the traffic network. In addition, the department can manage and change enfo- rcement speed limits in speed cameras remotely from the command centre. Finally, visibility sensors which are placed on top of smart traffic gateways deliver feedback and readings of sight visibility in real-time to the Smart City Department.
All the previous features and equipment were utilised and put together to introduce the trial project of Dynamic Speed Management during Adverse Weather Conditions. The visibility sensor would automatically detect when sight visibility dropped to less than 200 meters on any of the Smart Traffic
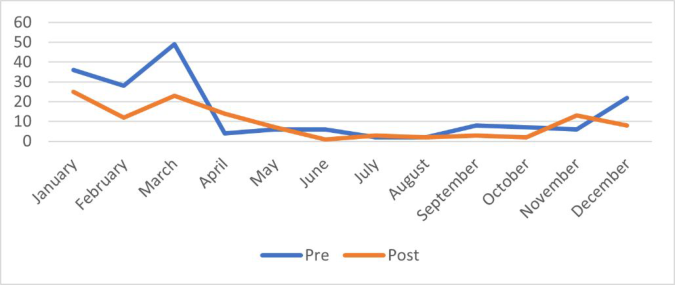
Figure 1: Number of monthly accidents in adverse weather conditions.
Gateways and alert the Smart City Department. The department would then follow its protocol of sending out warning messages to drivers in the affected area by using Wireless Emergency Alerts to notify drivers about the redu- ced speeds. In addition, all electronic sign boards on Smart Traffic Gateways are set to display the new enforcement speed. Side variable speed signs are also activated to display the new enforcement speed. A buffer time period of approximately 15 minutes is given to road users before reducing the enforce- ment speed limits to 80 kph (≈50 mph) from 120 kph (≈75 mph) – 160 kph (≈100 mph) depending on the highway and its posted speed limit. Once wea- ther conditions stabilises and sight visibility returns to more than 200 meters, all electronic speed signs on smart traffic gateways and variable speed signs are set to display the posted speed limit of the highway and another message is sent to road users in the affected area which informs them about resuming posted speed limits using Wireless Emergency Alerts.
Figure 1 presents the number of accidents which occurred during adverse weather conditions (Fog, rain, sandstorms, etc.) over a 6-year period (3 years pre-trial and 3 years post-trial) comparison of pre-trial and post-trial pro- ject. A monthly distribution of the data was implemented to display that the main cause of accidents occurred during the winter season (December – March) in Abu Dhabi where fog occurrences would increase during early mornings of the season. The data indicates a reduction in the number of acci- dents during adverse weather conditions in general after the implementation of the trial project. January recorded a reduction of 44% in the number of accidents, February recorded a reduction of 133%, March recorded a redu- ction of 113% and December recorded a reduction of 175%. As for the overall number of traffic incidents, the results indicate a 56% reduction in the number of traffic incidents that occurred during adverse weather con- ditions. Furthermore, the data was analysed further to look at fog related traffic incidents specifically as it was the main guiding reason for the trial project.
Table 1 shows the number of accidents data for 3 years pre the application of the trial project versus 3 years after the application of the trial project.
The Use of Automated Traffic Enforcement Methods by Abu Dhabi Police 405
Table 1. Number of accidents pre and post trial.
Table available in the original PDF paper.
Pre-Trial Post-Trial Number of Accidents during Fog 71 29
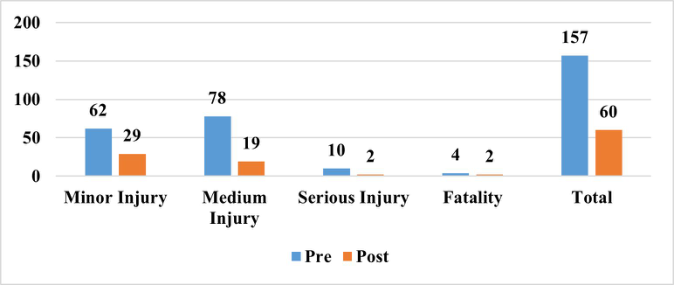
Figure 2: Number of injuries based on severity during fog.Table 2. Mean speed results.
Table available in the original PDF paper.
Time Period Mean Speed (kph) Traffic Count 06:00 – 07:00 AM 76.6 421 07:00 – 08:00 AM 74.6 672 08:00 – 09:00 AM 85.2 913 12:00 – 01:00 PM 111.5 1,245 06:00 – 07:00 PM 119.8 2,318 10:00 – 11:00 PM 119.5 1,053
The results indicate approximately a 59.2% reduction in the number of traffic incidents which took place during fog.
Figure 2 presents the number of injuries that resulted from fog related traffic incidents. The data reflects a reduction across all injury categories; whereas minor injuries were reduced by 53%, medium injuries were reduced by 76%, serious injuries were reduced by 80% and fatalities were reduced by 50%. As for overall injuries, the results from implementing the trial project reduced injuries resulting from fog related traffic incidents by 62%.
Table 2 presents data which was collected from one of the speed came- ras on E-11 (Highway connecting Abu Dhabi to Dubai) on 01/27/2022. The highway has a posted speed limit of 140 kph. That day was one of the most recent activations of the dynamic speed management during adverse weather conditions in Abu Dhabi at the time of data collection and analysis for this paper. The mean speed was used as the main metric to measure the impact of dynamic speed management during adverse weather conditions. The results clearly indicate a reduction in speed based on three different 1-hour slot time periods. The average speed during the activation based on three 1-hour time slots was 78.8 kph. The average speed for three 1-hour time slots in regular
weather conditions was 116.9 kph. On aggregate, the mean speed difference was 38.1 kph. The results indicate adherence from road users to the activa- tion of dynamic speed limits during adverse weather conditions, especially with the mean speed falling under the 80 kph posted speed limit during the activation.
SMART HEAVY VEHICLE MANAGEMENT Heavy vehicle presence on the road network has been established to increase road safety risks due to their physical characteristics (length and width), and their impact on the surrounding traffic. Abu Dhabi Emirate built two dedi- cated roads which are to be used exclusively by heavy vehicles to separate heavy vehicles from passenger cars. However, those two roads connect Abu Dhabi city to Al Ain city and Dubai; but they are not available to provide heavy vehicle access to other parts of the traffic network especially within the cities in Abu Dhabi where most of the infrastructure development is taking place. Therefore, Abu Dhabi police was tasked by the government in 1996 to monitor and manage heavy vehicle movement within the emirate, due to the nature of heavy vehicle involved incidents and their severity. Heavy vehicle permits were introduced, where logistics companies would apply for them at the Directorate of Traffic & Patrols in order to gain access for their fleet to prohibited roads.
From November 2018, the permit acquisition process has changed to an online service where logistics companies are able to acquire movement permits for their fleets through Abu Dhabi police’s website or mobile appli- cation. Smart traffic gateways ANPR equipment is used to monitor heavy vehicle movement across all highways in Abu Dhabi, leading to completely autonomous management of heavy vehicles in the emirate. Once a heavy vehicle passes under the smart traffic gateway, the ANPR records the num- ber plate and compares it to the heavy vehicle permit database to check for a valid permit. In case no valid permit is found for the heavy vehicle in que- stion, a “Heavy Vehicle Use of Prohibited Road” fine is automatically issued against the heavy vehicle. The management method has eliminated the use of traffic patrols and police officers in monitoring heavy vehicle movement within Abu Dhabi’s traffic network. An organisational performance advan- tage which Abu Dhabi police’s traffic units has benefited from in order to handle other issues such as traffic incident response and carry out scheduled enforcement campaigns. However, the project was set into motion in order to reduce unauthorised access to roads by heavy vehicles and thus improving road safety levels related to heavy vehicle presence on Abu Dhabi’s Road network.
Table 3 presents the number of annual traffic incidents involving heavy vehicles pre and post the project. The total number of accidents in 3 years before implementing the Smart heavy vehicle management project equals to 433 traffic incidents. 354 Traffic incidents involving heavy vehicles occurred during the 3 years after the implementation. In terms of the number of traffic incidents involving heavy vehicles, the project resulted in a reduction equating to 18.2%.
The Use of Automated Traffic Enforcement Methods by Abu Dhabi Police 407
Table 3. Annual traffic incidents involving heavy vehicles.
Table 4. Number of traffic inci- dents involving heavy vehicles based on fault.
Table available in the original PDF paper.
Pre Post At Fault 269 182 Injured 273 256
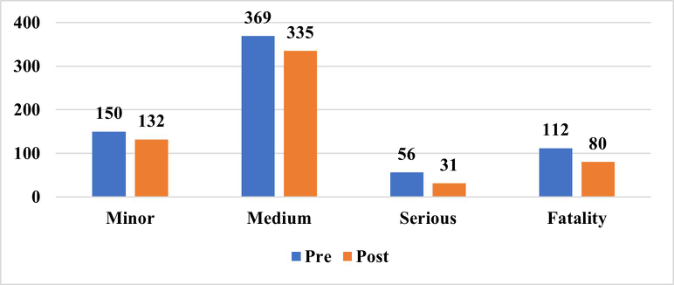
Figure 3: Number of injuries from heavy vehicle involved incidents.
Table 4 presents the number of traffic incidents involving heavy vehi- cles based on whether the heavy vehicle was at fault or injured. The results indicate that at fault heavy vehicle incidents were reduced by 32.3%, while injured heavy vehicle incidents were only reduced by 6.2%. It is worth noting that this result could indicate improved traffic safety awareness on heavy vehicle drivers after the implementation of smart heavy vehicle management system.
Figure 3 presents the number of injuries involving heavy vehicles pre- implementation and post implementation of the smart heavy vehicle mana- gement system. Minor injuries were reduced by 12%, medium injuries were reduced by 9.2%, serious injuries were reduced by 44.6% and fata- lities were reduced by 28.6%. The total number of injuries involving heavy vehicles was reduced by 15.9% post implementation.
Table 5. Number of heavy vehicle “use of prohibited road” traffic fines.
Table available in the original PDF paper.
Time Period Year Number of "Heavy Vehicle Use of Prohibited Road" traffic fines
Average Number of Yearly Citations Pre-Implementation 2016 8,253 8,141 2017 10,894 2018 5,276 Post-Implementation 2019 14,874 15,839 2020 16,139 2021 16,505
Table 6. T-test results between monthly violations and monthly injuries.
Table 5 indicates the number of yearly prohibited road use traffic violations issued against heavy vehicles in Abu Dhabi. The average number of yearly issued violations was 8,141 in the three-year prior to the smart heavy vehicle management system. Once the system was activated, the average number of yearly citations in the subsequent three years, was 15,839. Therefore, the average number of yearly citations was increased by 94.6%.
Table 6 presents the results of a t-test between 72 monthly heavy vehicle use of prohibited roads violations and monthly injuries. The Pearson corre- lation value was −0.06, which indicates an extremely weak statistical linear correlation between the number of issued violations and resulting injuries involving heavy vehicles.
AUTOMATED TAILGATING ENFORCEMENT (Yan et al. 2005) Rear end crashes tend to occur more frequently in urban areas when compared to rural areas. Urban areas generally tend to accommo- date higher densities of traffic and the infrastructure includes many signalized intersections. The previous characteristics lead to urban areas having a 20% higher rear end crash risk. (Baldock et al. 2008) furthermore showed that 94% of rear end crashes in Southern Australia occurred in urban areas, whilst the rest occurred in rural areas.
(Knipling et al. 1993) analysed the movement of the struck lead vehicles. The movements analysed were divided into stationary and moving. 70% of struck vehicles were found to be stationary at the time of the accident. Moving vehicles were split into vehicles making turns either with or against the traffic flow. Knipling found that vehicles making turns against the flow of traffic were more prone to being struck. An interesting finding which
The Use of Automated Traffic Enforcement Methods by Abu Dhabi Police 409
was found in the study was that moving struck vehicles lead to more severe injuries when compared to stationary struck vehicles.
(Yuan et al. 2017) investigated the severity of rear end crashes with heavy vehicles being leading vehicles in the accident. The data set was comprised of 100 accidents in Beijing, China. Rear end crashes with heavy vehicles as lea- ding vehicles often result in serious injuries as one would expect. The severity of the accident (fatal, non-fatal) was plotted against the road speed, where it was found that the highest frequency of rear end crashes occurring at roads with (80 and 100 km/hr) speeds. However, the road speed with the highest severity rate was (60 km/hr), although the frequency was much less when compared to that of (80 and 100 km/hr) road speeds. One of the important findings of the study was the age group of people involved in rear end cra- shes, where it was concluded that people between the age of 18-25 were the age group with the highest fatality rate.
(Minnesota Department of Transportation, 2006) conducted an analysis in their Tailgating Project to address the issue of tailgating on a section of High- way 55. The project consisted of introducing painted dots on the road so that drivers would maintain a safe following distance (2 dots must be kept betw- een a following and leading vehicle); therefore, eliminating the ambiguity of what a safe following distance should be on the highway. The project used time difference between vehicles to determine the distance between them. A before and after method was used to assess the impact of the dots on drivers and tailgating behaviour. There were 3 data collection points; the first was placed a mile before the dots, the second was placed at the dots and the last one was placed a mile after the dots. The results from applying the dots were positive, where the collective average gap distance increased from 2.35s to 2.52s; or in other words 4.2 meters. It is worth noting that the results of the “after” scenario were taken roughly a month after the implementation of the dots. Therefore, it will take several months to truly test the long-term impact of the dots on reducing tailgating behaviour.
Tailgating is considered one of the main aggressive driving behaviours which may lead to serious traffic incidents resulting in serious injuries or fatalities. In Abu Dhabi, tailgating is more prevalent on highways than inner roads due to high posted speeds and road geometry attributes. Tail- gating violations are traditionally enforced by police officers witnessing the behaviour while on highway patrol. However, due to the large number of traffic incidents caused by tailgating alone, Abu Dhabi Police implemented an automated tailgating enforcement method. An additional compartment was added to 69 speed cameras spread across the emirate’s highways which can use a vehicle’s timestamp in order to determine the validity of a tailga- ting violation. The time gap between two timestamps is the violation criteria which is set by the Traffic Engineering and Road Safety Department. Whe- never a following vehicle registers a lesser time than the allowed time gap, an automatic tailgating violation is issued against the following vehicle.
The activation of automated tailgating violations was implemented in January 2020 following a three-month awareness campaign carried out by Abu Dhabi police. The system was configured to issue a warning citation on
Table 7. Annual tailgating traffic incidents.
Table available in the original PDF paper.
Year Number of Tailgating Traffic Incidents
2018 180 2019 269 2020 128 2021 95
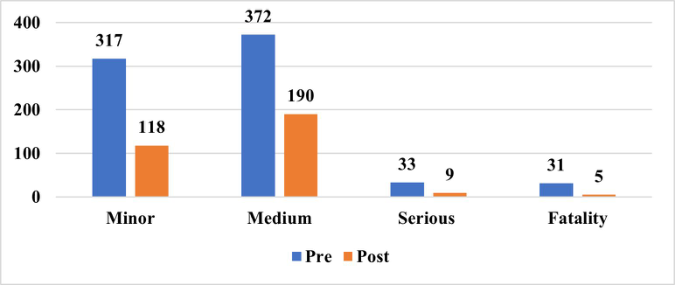
Figure 4: Number of tailgating incidents injuries.
the first registered tailgating violation warning the driver about the infrin- gement, and all following violations were configured to be regular citations which incurred a penalty payment and demerit points. The awareness cam- paign carried along a project similar to the one carried out by the Minnesota DOT back in 2006, which entailed painting two highways in Abu Dhabi with dotted patterns to help raise awareness regarding the safe following distance.
Table 7 presents the number of registered traffic incidents caused by tailga- ting in Abu Dhabi. It is evident from the results that the number of tailgating incidents was reduced greatly following the implementation of automated tailgating enforcement and the traffic safety awareness campaign that went along with it. After only one year of implementation, the number of tail- gating traffic incidents was reduced from 269 to 128 resulting in a 52.4% reduction. The total number of tailgating traffic incidents within two years prior to implementation was 449, while the number of incidents in the two following years was 223, which resulted in a 50.3% reduction.
Figure 4 presents a comparison between the number of injuries that resul- ted from tailgating traffic incidents prior and post implementation of the automated tailgating enforcement. Most notably, Fatalities due to tailga- ting accidents were reduced by 83.9%, and serious injuries were reduced by 72.7%. Minor and medium injuries were reduced by 62.8% and 48.9% respectively. When comparing the total number of injuries that resulted from tailgating incidents prior and post implementation of the automated tailgating enforcement, a 57% reduction in injuries was the result.
The number of tailgating traffic fines is presented in Table 8. The table compares the number of tailgating fines which were issues two years prior
The Use of Automated Traffic Enforcement Methods by Abu Dhabi Police 411
Table 8. Pre and post implementation tailgating traffic fines.
Table available in the original PDF paper.
Time Period Number of Tailgating Fines Pre-Implementation 74,133 Post- Implementation 79,932
Table 9. T-test between monthly tailgating fines and monthly injuries.
Table 10. Time gap results acquired on 02/15/2018.
Table available in the original PDF paper.
Leading Time Gap L1 L2 L3 L4 0 – 1 s 688 272 148 27 1 – 2 s 2449 1756 951 380 >2 3916 4130 3338 2459 % Of vehicles >2 s 56% 67% 75% 86%
Table 11. Time gap results acquired on 02/27/2020.
Table available in the original PDF paper.
Leading Time Gap L1 L2 L3 L4 0 – 1 s 384 62 22 12 1 – 2 s 1505 731 218 69 >2 2497 2313 1593 926 % Of vehicles >2 s 57% 75% 87% 92%
and post implementation of the automated tailgating enforcement. The num- ber of tailgating fines increased by 7.8%. However, it also worth mentioning that there were an additional 1,779 warning fines issued by the automated tailgating enforcement against tailgating offenders during the two-year time period.
Table 9 displays the results of a t-test comparison between 48 monthly tail- gating fines and the total number of monthly injuries. The Pearson correlation value was 0.06, which indicates an extremely weak statistical linear correla- tion between the number of tailgating fines and the total number of injuries. Therefore, it can be deducted from the results that the number of fines did not have a significant impact on reducing injuries which resulted from tailga- ting behaviour. Nevertheless, the positive impact of implementing automated tailgating enforcement cannot be dismissed by simply looking at the number of fines. It can be concluded that warning tailgating violations along with the tailgating awareness campaign delivered a stronger social message to drivers to deter them from tailgating behaviour.
Tables 10 and 11 present the results of traffic data collection which took place using a discrete speed camera on the same road, but on different dates. The data included a traffic count of the vehicles, vehicle speed and time stamps for each vehicle categorized by lanes. It is evident from the results, that the percentage of adherence to the 2-second following distance rule has seen significant improvement on all lanes except for lane 1. When compa- ring the percentage of vehicles adhering to the safe following distance, lane 1 recorded a non-significant increase of 1%, lane 2 recorded an increase of 8%, lane 3 recorded an increase of 12% and lane 4 recorded an increase of 6%. On average, the overall percentage of vehicles abiding by the safe follo- wing distance increased from 71% to 78%, resulting in a positive difference of 7%.
CONCLUSION
The paper examined three different automated traffic enforcement systems which replace traditional traffic enforcement by police officers. All three enforcement systems proved to have positive results in terms of the num- ber of traffic incidents and the injuries resulting from them. Regarding the dynamic speed management during adverse weather conditions, the average speed during the activation was 78.8 kph. The average speed for in regular weather conditions was 116.9 kph. On aggregate, the mean speed difference was 38.1 kph. The results indicate adherence from road users to the activa- tion of dynamic speed limits during adverse weather conditions, especially with the mean speed falling under the 80 kph posted speed limit during the activation. The data reflects a reduction across all injury categories; whereas minor injuries were reduced by 53%, medium injuries were reduced by 76%, serious injuries were reduced by 80% and fatalities were reduced by 50%. As for overall injuries, the results from implementing the trial project redu- ced injuries resulting from fog related traffic incidents by 62%. The results indicate approximately a 59.2% reduction in the number of traffic incidents which took place during fog. Regarding the smart heavy vehicle management system, in terms of the number of traffic incidents involving heavy vehicles, the project resulted in a reduction equating to 18.2%. The results indicate that at fault heavy vehicle incidents were reduced by 32.3%, while injured heavy vehicle incidents were only reduced by 6.2%. It is worth noting that this result could indicate improved traffic safety awareness on heavy vehicle drivers after the implementation of smart heavy vehicle management system. Minor injuries were reduced by 12%, medium injuries were reduced by 9.2%, serious injuries were reduced by 44.6% and fatalities were reduced by 28.6%. The total number of injuries involving heavy vehicles was reduced by 15.9% post implementation. For the final project, which was assessed in this paper, the total number of tailgating traffic incidents within two years prior to implementation was 449, while the number of incidents in the two following years was 223, which resulted in a 50.3% reduction. Fatalities due to tail- gating accidents were reduced by 83.9%, and serious injuries were reduced by 72.7%. Minor and medium injuries were reduced by 62.8% and 48.9% respectively.
The Use of Automated Traffic Enforcement Methods by Abu Dhabi Police 413
A statistical test was done between the number of issued traffic fines and the number of injuries for the smart heavy management system and the automated tailgating enforcement. Both tests indicated an extremely weak statistical linear correlation between the number of fines and the total number of injuries. Therefore, it could be concluded the there is no direct relationship between the number of fines on reducing the number of injuries; however, when analysing key injury and traffic incident metrics via a before and after scenario the data is quite clear on the positive impact of each system. It could be deduced that the social impact and awareness of having autonomous traf- fic enforcement systems in place prove to be a much more efficient tool in increasing traffic safety performance compared to traditional enforcement campaigns carried out by police officers.
LIMITATIONS AND FUTURE RESEARCH The paper did not analyse the financial costs related to the required infra- structure which is required to be able to enforce the automated traffic enforcement systems mentioned. However, having a network of more than 1,200 speed cameras which are interconnected to a central location can incur a substantial financial cost. Precise figures could be analysed as future rese- arch to support the current paper in terms of related financial costs, which can play a major factor to decision makers when analysing such projects.
REFERENCES
Al-Ghamdi, A.S., 2007. Experimental evaluation of fog warning system. Accident Analysis & Prevention, 39(6), pp. 1065–1072. De Pauw, E., Daniels, S., Franckx, L. and Mayeres, I., 2018. Safety effects of dynamic
speed limits on motorways. Accident Analysis & Prevention, 114, pp. 83–89. Knipling, R.R., Mironer, M., Hendricks, D.L., Tijeripa, L., Everson, J., Allen, J.C. and Wilson, C., 1993. Assessment of IVHS countermeasures for collision avoidance: Rear-end crashes (No. DOT-HS-807-995). United States. Joint Program Office for Intelligent Transportation Systems. Lee, C., Hellinga, B. and Saccomanno, F., 2006. Evaluation of variable speed limits
to improve traffic safety. Transportation research part C: emerging technolo- gies, 14(3), pp. 213–228. National Highway Traffic Safety Administration, 2006. Minnesota Tailgating Pilot Project. Minnesota Department of Transportation, viewed 10 January 2022, <http://www.dot.state.mn.us/trafficeng/tailgating/> Saha, P., Ahmed, M.M. and Young, R.K., 2015. Safety effectiveness of varia-
ble speed limit system in adverse weather conditions on challenging roadway geometry. Transportation Research Record, 2521(1), pp. 45–53. Yan, X., Radwan, E. and Abdel-Aty, M., 2005. Characteristics of rear-end accidents at signalized intersections using multiple logistic regression model. Accident Analysis & Prevention, 37(6), pp. 983–995. Yuan, Q., Lu, M., Theofilatos, A. and Li, Y.B., 2017. Investigation on occupant
injury severity in rear-end crashes involving trucks as the front vehicle in Beijing area, China. Chinese journal of traumatology, 20(01), pp. 20–26.
LISTED IN THE AHFE DIGITAL BOOKSTORE CATALOGUE
Explore the complete digital volume
Human Factors in Transportation
Read this individual research paper free through the original publisher, or explore the full digital proceedings book.
ISBN 978-1-958651-36-0
Explore this ISBN in the AHFE Bookstore ↗Listed in the July 2026 bookstore catalogue; search by ISBN to confirm current availability · Digital book purchase optional