Ana Paula Larocca, Felipe Calsavara (2023). Effects of Intelligent Warning Systems on Drivers' Steering Wheel Angle in Fog Situations. In: Human Factors in Transportation. AHFE Open Access, vol. 95, pp. 448–459. https://doi.org/10.54941/ahfe1003830
Visibility is essential for the driving task and its reduction due to fog influences drivers' behavior. A solution to reduce accidents in fog is adopting intelligent transport systems that notify the driver in advance about the road conditions, allowing the driver to adapt his driving behavior. Intelligent Transport Systems (ITS) based on connected vehicle communication have increasingly been incorporated into vehicles to help overcome the abovementioned problem. They notify drivers of potentially dangerous road conditions, such as fog, to adapt their driving behavior better. Few academic studies link driver behavior with their safety in low visibility situations, leaving gaps in understanding a driver's directional change strategy in low visibility situations and the relationships due to the use of in-vehicle warning systems. In order to achieve the objectives of the work, this study proposes a controlled experiment with real drivers in a simulated driving environment. Through driving simulators, drivers can be repeatedly confronted in different circumstances, including specific weather conditions, without risk to life and with reduced costs, which is a tremendous advantage over field tests. This work investigated the effects of the presence or absence of fog on the steering wheel angle of drivers. A driving simulator was used to recreate real scenarios of a Brazilian highway with a high incidence of fog, showing the geometric and meteorological conditions of the site. The physical structure of the simulator is composed of a driving cockpit with a car seat, steering wheel with force feedback, gearshift lever and pedalboard with accelerator, brake and clutch pedals. The cockpit station also allows for height and distance adjustments between the seat and the steering wheel. The simulated environment was projected onto a 1.40 x 0.80 m flat panel by a DepthQ HDs3D2 projector with a resolution of 1080p and a refresh rate of 60 Hz. The projected field of view is 120º and 50º in horizontal and vertical views, respectively. For eye tracking, a device specifically designed for this purpose was attached to the simulator: Smart Eye, model Pro 5.10® (SE). A frame-by-frame analysis was performed on each video with gaze position superimposed on the field of view to identify participants' attentional allocation on the HUD when the fog warning was displayed. To investigate how often and when participants inspected the HUD, the fog alert region on the HUD was defined as a region of interest (ROI), as seen on the right of Figure 1 and only those participants whose fixation at the time of the warning was included in this area were part of the sample of this research. Rearview mirrors are also projected into the dashboard, as well as a Head-Up Display (HUD) to show fog warning messages and the speedometer. Speakers with 32 watts RMS of power were used to reproduce sounds similar to the vehicle's engine and the wind, in order to improve immersion. The simulated rural road is a 5 km stretch of an essential Brazilian highway. The stretch is in a mountainous region with a high incidence of fog and many curves in its geometry. The highway administrator provided the geometric design of the section necessary for the virtual modeling, the VDM (Average Daily Volume), as well as the location, type, and severity of accidents that occurred in recent years. The simulation period was the month of June, and the time was set to 6 am, which, according to data from the Federal Highway Police (DPRF, 2022), is the most frequent period of accidents with foggy weather conditions. The results agree with those found by Abdel-Aty et al. (2011), who observed in the state of Florida (USA) that fog was the leading cause of collisions in rural areas during the winter months and in the early morning hours. However, the results of the most common type of collision analyzed in Brazil differ from those found by Abdel-Aty et al. (2011). In Brazil, between 2017 and 2021, the fog's most common type of collision was “Exit from car bed” (23%) and involved only one vehicleIn the foggy scenario, the driver adjusted the steering wheel angle more times than in the no-fog scenario. This text, in addition to presenting detailed analyses of accidents that occurred under foggy weather conditions, also sought to clarify drivers' behavior when driving in fog with a warning system built into the vehicle.In Brazil, unlike what is found in the USA, the most common type of accident to happen is "Exit from a cart" and it does not involve multiple vehicles.
Vision is the most used human sense in driving a vehicle, and its impairment reduces the driver’s ability to perceive information from the environment. Situations with smoke or weather conditions such as fog and heavy rain are scenarios that reduce the overall visibility and contrast of the driving scene, decreasing visual detail as distance increases. Visual attention has been con- sidered a contributing factor to traffic accidents, and fog-related accidents tend to be more severe and involve multiple vehicles.
Intelligent Transport Systems (ITS) based on connected vehicle commu- nication have increasingly been incorporated into vehicles to help ove- rcome the abovementioned problem. They notify drivers of potentially dangerous road conditions, such as fog, to adapt their driving behavior better.
Few academic studies link driver behavior with their safety in low visi- bility situations, leaving gaps in understanding a driver’s directional change strategy in low visibility situations and the relationships due to the use of in-vehicle warning systems. A broad understanding of driving behavior in low visibility can help researchers and designers improve road safety through more effective measures.
Effects of Intelligent Warning Systems on Drivers’ Steering Wheel Angle 449
The driving simulator is a widely used tool to investigate the impact of individual driver differences, vehicle technology, driver support system, road designs, and the effectiveness of road safety interventions. However, for ethi- cal reasons, carrying out a natural driving experiment is unfeasible, as it risks the driver’s life.
Another fundamental factor that has supported this research is that studies on the subject have been published in North American and European coun- tries and, therefore, may not correspond to the behavior profile of Brazilian drivers and the infrastructure conditions of Brazilian highways. The present study examines the effects of low visibility and warning systems present in the vehicle on the driver’s driving performance, based on an experiment in a driving simulator. More specifically, its main objective is to investigate the driving behavior of a vehicle with an on-board warning system and in low visibility situations, and the specific objectives are: a) analyze and characterize the accidents that occur under fog in the Brazilian scenario;
b) verify if the presence or absence of fog significantly affects the direction corrections made by the driver.
METHODS
In order to achieve the objectives of the work, this study proposes a con- trolled experiment with real drivers in a simulated driving environment. Through driving simulators, drivers can be repeatedly confronted in diffe- rent circumstances, including specific weather conditions, without risk to life and with reduced costs, which is a tremendous advantage over field tests (Lucas et al., 2013).
Bibliography Review Accidents in fog Adverse weather conditions significantly impact pavement conditions, vehi- cle performance, sight distance, driver behavior, travel demand, traffic flow characteristics, and traffic safety (Hassan and Abdel-Aty, 2011). Ni et al. (2012) state that fog is an example of a weather condition that directly impacts the driver’s vision. Its presence reduces the contrast and visibility of the driving scenery, resulting in a reduction in detail as the sighted distance increases. The absence or reduction of long-range visual information con- stitutes a danger since, in typical visibility situations, drivers tend to look further along the road they are traveling than at its edges (Calsavara et al., 2021). Thus, it is evident that fog increases the risk of accidents as it hides long-range visual information making it difficult to predict the path to be taken and anticipate events such as pile-ups or vehicle decelerations ahead (Rosey et al., 2017).
The level of visual attention has been considered a contributing factor to traffic accidents. In Brazil, according to accident statistics from the Federal Highway Police, fog contributed as an important factor for 2,263 accidents in the South and Southeast regions between 2017 and 2021, which represents
450 Calsavara and Larocca
about 1% of all accidents. (DPRF, 2022). Although the percentage of acci- dents in fog is small compared to normal visibility conditions, these accidents tend to be more severe and involve multiple vehicles (Hassan and Abdel-Aty, 2011; Park et al., 2019; Wu, Abdel-Aty, 2019; Wu, Abdel-Aty). Cai et al., 2018). A detailed study of collisions in the state of Florida (USA) carried out by Abdel-Aty et al. (2011) showed that collisions whose leading cause was the occurrence of fog occurred in more significant amounts far from urban cen- ters, during the winter months and in the early hours of the morning. Also, that front and rear collisions were the most prevalent types in terms of risk and severity.
Change of direction According to Mueller and Trick (2012), reduced visibility increases the risk of collision, however, not all drivers are affected in the same way. Some are more likely to make safety-related adaptations than others, and these adaptations can be measured primarily by speed compensation, ability to follow a car ahead, and ability to stay in lane.
When driving in foggy conditions, the driver has limited information about their field of vision and road conditions, for example, making it difficult to stay in the roadway. Brooks et al. (2011) used a driving simulator with diffe- rent fog densities to assess the driver’s ability to stay in the lane. The results showed that the average time spent in the lane of drivers was reduced when they drove in fog situations with less than 30 meters of visibility. Mueller and Trick (2012) investigated the influence of driving experience on fog compen- sation. For this, variables such as average speed, response time and variation in direction were collected through a driving simulator. Compared with more experienced drivers, less experienced drivers had greater response times, spe- eds, and steering variations. They concluded that less experienced drivers did not handle the compensations as well as more experienced drivers. Saffarian et al (2012) evaluated risk and lateral control (through steering wheel acti- vity) of 27 drivers in a driving simulator. The results showed greater risk feeling and steering wheel activity, therefore, less lateral control, when there was no car to be followed within the field of vision due to the presence of fog.
Intelligent warning systems Efforts have been devoted to solving traffic safety issues in a foggy area. Warning Intelligent Transport Systems (ITS), based on the communication of connected vehicles with infrastructure or other vehicles, help drivers take action, through externally acquired information, or even actively acting on the vehicle’s brakes and steering wheel.
The most typical warning systems that provide drivers with real-time traffic alerts are located on the highway infrastructure, called Variable Message Panels (PMV) and inside connected vehicles, called in-vehicle war- ning systems. Liu and Khattak (2016) state that vehicles sharing their status information with other vehicles or with the infrastructure lead to better- planned actions while driving, earlier identification of hazards and safer responses.
Effects of Intelligent Warning Systems on Drivers’ Steering Wheel Angle 451
In recent years, due to the significant development of ITS technology, inve- stigations into the effectiveness of in-vehicle warning systems have increased. Zhao et al (2019) used a connected vehicle platform driving simulator to analyze drivers’ speed adjustment after receiving alert information in diffe- rent fog densities. The results indicated that the warning system effectively led to speed reductions in all fog scenarios. Chang et al. (2019) used a fixed-base driving simulator to investigate the effectiveness of fog warning systems on driving performance. According to the results, the scenarios with fog warning systems significantly improved safety due to the reduction in speed before a foggy area compared to the scenario without this warning system. Wu et al. (2018) conducted a driving simulator study to assess the effectiveness of the warning system, with Head-Up Display (HUD) as an interface, on drivers’ braking behaviors. The results indicated that the system could help decrease drivers’ reaction time and reduce the likelihood of accidents.
Equipment The physical structure of the simulator is composed of a driving cockpit with a car seat, steering wheel with force feedback, gearshift lever and pedalboard with accelerator, brake and clutch pedals. The cockpit station also allows for height and distance adjustments between the seat and the steering wheel. The simulated environment was projected onto a 1.40 × 0.80 m flat panel by a DepthQ HDs3D2 projector with a resolution of 1080p and a refresh rate of 60 Hz. The projected field of view is 120
and 50
in horizontal and vertical views, respectively. Rearview mirrors are also projected into the dashboard, as well as a Head-Up Display (HUD) to show fog warning messages and the speedometer. Speakers with 32 watts RMS of power were used to repro- duce sounds similar to the vehicle’s engine and the wind, in order to improve immersion.
Two computers process the experiment in real time. The first, responsi- ble for rendering and simulating the environment, and the second computer, responsible for modeling the vehicle dynamics, vehicle-road interaction and the mechanical responses to the driver’s actions.
For eye tracking, a device specifically designed for this purpose was atta- ched to the simulator: Smart Eye, model Pro 5.10® (SE). This model consists of three front cameras that follow the driver’s eyes. An additional rear camera records the scenes seen by the driver. The SE is capable of remotely tracking gaze direction, head position, eyelid opening, blinking, fixation points, pupil dilation, among others. In addition to detecting the intersection of the dri- ver’s gaze with objects created in the virtual environment, such as traffic signs, cars and pedestrians. This information can help to better determine response time and map the regions on the screen most viewed by the dri- ver. MAPPS 3.3 software, developed by EyesDX, was used to analyze eye movement data.
A frame-by-frame analysis was performed on each video with gaze posi- tion superimposed on the field of view to identify participants’ attentional
452 Calsavara and Larocca
allocation on the HUD when the fog warning was displayed. To investi- gate how often and when participants inspected the HUD, the fog alert region on the HUD was defined as a region of interest (ROI), as seen on the right of Figure 1 and only those participants whose fixation at the time of the warning was included in this area were part of the sample of this research.
Description of the Study Excerpt The simulated rural road is a 5 km stretch of an essential Brazilian highway that connects São Paulo to Curitiba and is the main link between the South and Southeast regions, representing approximately 80% of accidents in fog. The stretch is in a mountainous region with a high incidence of fog and many curves in its geometry. The highway administrator provided the geometric design of the section necessary for the virtual modeling, the VDM (Average Daily Volume), as well as the location, type, and severity of accidents that occurred in recent years.
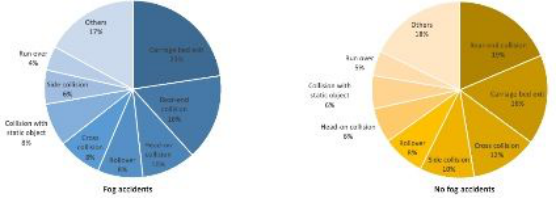
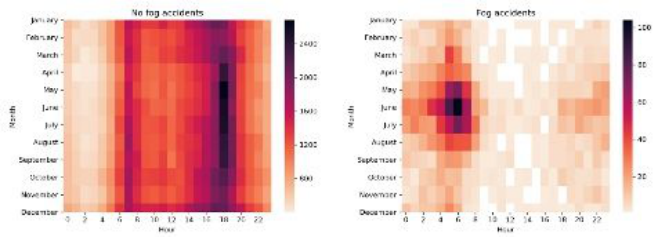
The simulation period was the month of June, and the time was set to 6 am, which, according to data from the Federal Highway Police (DPRF, 2022), is the most frequent period of accidents with foggy weather conditions (Figure 3). The results agree with those found by Abdel-Aty et al. (2011), who observed in the state of Florida (USA) that fog was the leading cause of collisions in rural areas during the winter months and in the early morning hours. However, the results of the most common type of collision analyzed in Brazil differ from those found by Abdel-Aty et al. (2011). In Brazil, between 2017 and 2021, the fog’s most common type of collision was “Exit from car bed” (23%) and involved only one vehicle, as seen in Figure 2.
In addition to the absolute rates of victims and traffic accidents, the metho- dology of the severity index, which is obtained by assigning different weights to accidents according to severity, identified the most critical curves in the segment. In this methodology, the severity index is obtained through a nume- rical method from the National Traffic Department (Denatran) that assigns weight to the types of accidents according to the severity of the damage cau- sed. In Brazil, Denatran (1987) recommends the following weights and their expression (Equation 1) to determine the severity index (S), measured in UPS (Standard Severity Unit), where D, V and F represent the number of accidents
Figure 1: Photos of the driving simulator (left) and scenery (right) used during the collections.
Effects of Intelligent Warning Systems on Drivers’ Steering Wheel Angle 453
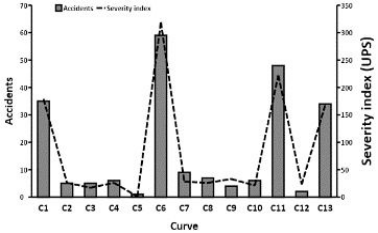
Figure 2: Types of collisions in Brazil under fog (left) and without fog (right).Figure 3: Distribution of accidents on Brazilian federal highways throughout the year and time of day in the last five years: with fog (right) and without fog (left).Figure 4: Accident statistics and severity index identified by curves.
no victims (with only material damage), with non-fatal victims and with fatal victims, respectively.
S = 1×D+5×V+13×F (1) The severity index was determined for each curve of the stretch with acci- dents recorded in the last five years (Figure 4). The 6th curve (C6) presented the highest number of accidents and severity index. Both this curve and the posterior one (C7) are complex curves with a small radius and short tan- gents (length of the anterior tangent to C6: 275 m; sector of the C6 curve with a length of 245 m and a radius of 130 m; length of the tangent after C6: 50 m; C7 with a sector of 340 m in length and 180 m in radius).
454 Calsavara and Larocca
Experimental Draw The experiment was carried out with 28 participants, who needed to have a driver’s license for at least one year and normal or corrected-to-normal vision. The group of volunteers consisted of 18 men and 10 women, aged between 21 and 33 years (M = 25.4 and SE = 4.0). A repeated-measures ANOVA experimental design was employed, and each participant went through clear weather, fog weather, and fog weather scenarios using a car with fog warning, totaling three scenarios for each. The clear weather scenario (Scenario 1) represents the control group and was used to analyze the drivers’ standard behavior. The other two scenarios were designed to enable analysis of how fog and an in-car warning system change drivers’ behavior. The order of scenarios was randomly sorted for each parti- cipant to avoid bias, and the experiment time limited to avoid possible motion sickness when using the simulator.
The scenarios described above were modeled and simulated using the Virtual Test Drive (VTD) package developed and marketed by Vires®. The data sets were then analyzed using programming codes in Python 3.6 lan- guage. All scenarios were designed for analysis in the vicinity of the curve C6 and C7 with the proportion between light and heavy vehicles in the traffic flow at 6 am, respecting the data obtained.
The only changes between the scenarios were the presence or absence of fog and fog warning to ensure that differences were not confounded with other factors. Fog position (established on the tangent between C6 and C7) and fog intensity based on visibility (50 m) were fixed in all fog scenarios. The fog warning was set 400 m before the driver entered the fog zone.
Procedures The experiment was conducted in a driving simulator, the recruitment of participants was carried out through dissemination on social networks, and they responded to an online form to verify if they meet the require- ments of having a driver’s license, driving experience of at least one year and normal or corrected-to-normal visual contrast and acuity. All partici- pants are of the same age group, avoiding possible variations caused by age differences.
An approval from the Ethics Committee designated by Plataforma Brasil, under opinion number 2,611,849, one of the requirements for processing data with personal information of the participants, was obtained before the experiments. Upon arrival at the laboratory, each participant signed the Free and Informed Consent Form (FICT) and completed a personal information
Table 1. Scenarios for each participant.
Table available in the original PDF paper.
Fog ITS Scenario Absent Absent 1 Present Absent 2 Present Present1 3
Effects of Intelligent Warning Systems on Drivers’ Steering Wheel Angle 455
questionnaire. They were also instructed in the driving simulator’s mecha- nical procedures and operations. The instructions did not include detailed information about the experiment influencing driving behavior. First, they conducted an adaptation scenario until they felt adapted to the simulator and comfortable with the simulation. The adaptation simulation lasted at least 5 minutes for each participant and could be repeated as often as neces- sary. After the adaptation scenario, participants drove for approximately 5 minutes in each of the three experimental scenarios, with a 2-minute inte- rval between them. The experiment lasted approximately 30 minutes for each participant.
RESULTS
With the collections made in the simulator, through the VTD package, it was possible to obtain the variable steering wheel angle, in radians, along with the participant’s performance when passing through the C6 and C7 curves of the studied scenario. This variable was collected at a frequency of 60 Hz, from the beginning of the sixth curve sector to the end of the seventh curve, passing through the tangent segment between them.
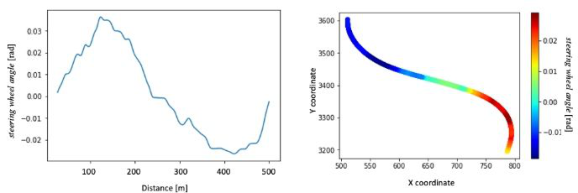
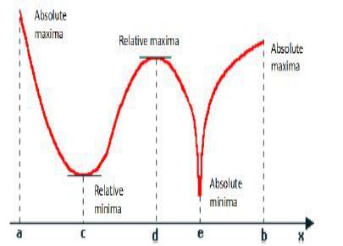
With the collection of this variable for each of the 28 participants, it was possible to determine the number of corrections in the vehicle’s direction. A correction in the direction of the vehicle occurs when the direction of the stee- ring wheel angle changes. That is when the curve presented in the graph on the left of Figure 5 passes through “peaks” and “valleys”, which are equivalent to the local maximum and minimum of the graph formed.
Pierre Fermat’s Theorem was used to obtain a function’s maximum or minimum points. By the theorem, if a function f has an extremum point (local maximum or minimum) at ximage7.emfthe number of steering wheel corrections, for each participant.
To obtain maximum or minimum points of a function, Pierre Fermat’s Theorem is used. By the theorem, if a function f has an extremum point (local maximum or minimum) at x=c and the function f is differentiable at this point, then x=c is a critical point, that is, f ‘(c)=0, see Figure 6. Thus, using the Python programming language, it was possible to find the number of maximums and minimums, that is, the number of steering wheel corrections, for each participant.
Figure 5: Steering wheel angle, in radians, of one of the participants as a function of the distance traveled (left) and in plan (right).
456 Calsavara and Larocca
Figure 6: Local and absolute maximums and minimums of functions. Source: (Sodré, 2007).Table 2. Average steering wheel corrections and standard deviation per scenario.
Table available in the original PDF paper.
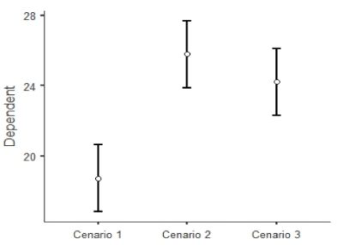
Scenario 1 Scenario 2 Scenario 3 Average 19 26 24 Standard deviation 4.36 6.45 3.83 Shapiro-Wilk p 0.795 0.501 0.435
DISCUSSION
Tukey’s multiple comparison test (Post Hoc) made it possible to compare whether there were significant differences between the scenarios. From the data in Table 3, it is noted that there was a significant difference between scenarios 1 and 2 (p < 0.001), so there was a significant increase in the average number of corrections in the direction of the steering wheel when passing through the section with fog (26 corrections) if compared to the same stretch without fog (19 corrections). Therefore, it can be deduced that fog makes drivers adjust their stay in the roadway more, validating the results found by Brooks et al. (2011). This would also explain the type of collision “Exit from the roadbed” being the primary type of accident under fog conditions in Brazil.
The difference was significant between scenarios 1 and 3 (p < 0.001) and not significant between scenarios 2 and 3 (p = 0.157). Therefore, it can be deduced that the fog was the main factor that led the participants to correct their steering wheel direction. On the other hand, despite showing a drop in the average of corrections, the warning system was not significant enough, leading to the belief that the use of a warning system does not help drivers’ lateral control.
Effects of Intelligent Warning Systems on Drivers’ Steering Wheel Angle 457
Figure 7: Average number of times participants corrected the direction in each scenario.
CONCLUSION
This text, in addition to presenting detailed analyses of accidents that occur- red under foggy weather conditions, also sought to clarify drivers’ behavior when driving in fog with a warning system built into the vehicle.
In Brazil, unlike what is found in the USA, the most common type of acci- dent to happen is “Exit from a cart” and it does not involve multiple vehicles.
The average of direction corrections in the foggy scenario is higher than in the scenario without fog. However, when compared to the fog-only sce- nario, there was no statistically significant difference in the scenario using a fog warning system, which passively warns drivers. This indicates that active systems, with direct actions on the vehicle’s brakes and steering wheel, maybe more critical in foggy regions to keep the vehicle in the driving lane.
To complement this result, a future study with active systems embedded in the vehicle could demonstrate greater efficiency than passive systems in regions with the incidence of fog. Finally, it is suggested as future work to verify how the driving experience can influence the direction of the Brazilian driver and his maintenance in the roadway.
ACKNOWLEDGMENT
The authors acknowledge the São Paulo Research Foundation (FAPESP) for the financial support, grant 2021/10727-1, CNPq grant 307772/2019-5 and 407056/2022-0, Vi-Grade, Smart Eye and the Coordination for the Improvement of Higher Education Personnel - Brazil (CAPES) - Financing Code 001.
AUTHOR CONTRIBUTIONS The authors confirm contribution to the paper as follows: study conception and design: Calsavara, Larocca; data collection: Calsavara; analysis and interpretation of results: Calsavara, Larocca; draft manuscript preparation: Calsavara, Larocca. All authors reviewed the results and approved the final version of the manuscript.
458 Calsavara and Larocca
REFERENCES
Abdel-Aty, M., Ekram, A. A., Huang, H., e Choi, K. (2011) A study on crashes related to visibility obstruction due to fog and smoke. Accident Analysis and Prevention, 43(5), 1730–1737. doi: 10.1016/j.aap.2011.04.003. Brooks, J. O., Crisler, M. C., Klein, N., Goodenough, R., Beeco, R. W., Guirl,
C., Tyler, P. J., Hilpert, A., Miller, Y., Grygier, J., Burroughs, B., Martin, A., Ray, R., Palmer, C., e Beck, C. (2011) Speed choice and driving performance in simulated foggy conditions. Accident Analysis and Prevention, 43(3), 698–705. doi: 10.1016/j.aap.2010.10.014. Calsavara, F., Kabbach Junior, F. I., e Larocca, A. P. C. (2021) Effects of Fog in a Brazilian. Chang, X., Li, H., Qin, L., Rong, J., Lu, Y., e Chen, X. (2019) Evaluation
of cooperative systems on driver behavior in heavy fog condition based on a driving simulator. Accident Analysis & Prevention, 128, 197–205. doi: 10.1016/j.aap.2019.04.019. Denatran – Departamento Nacional de Trânsito. (1987) Manual de Identificação, Análise e Tratamento dos Pontos Negros. Departamento Nacional de Trânsito (Vol. 2). Ministério da Justiça, Brasília. DPRF. (2022) Dados Abertos das Rodovias Federais. República Federativa do Brasil.
Obtido 13 de junho de 2021, de https://www.prf.gov.br/portal/dados-abertos. Hassan, H. M., e Abdel-Aty, M. (2011) Analysis of drivers’ behavior under reduced visibility conditions using a Structural Equation Modeling approach. Transpor- tation Research Part F: Traffic Psychology and Behaviour, 14(6), 614–625. doi: 10.1016/j.trf.2011.07.002. Liu, J., e Khattak, A. J. (2016) Delivering improved alerts, warnings, and con-
trol assistance using basic safety messages transmitted between connected veh- icles. Transportation Research Part C: Emerging Technologies, 68, 83–100. doi: 10.1016/j.trc.2016.03.009. Lucas, F. R., Russo, L. E. A., Kawashima, R. S., Figueira, A. C., Larocca, A. P. C., e Kabbach Jr., F. I. (2013) Use of driving simulators Applied to road safety project. Boletim de Ciencias Geodesicas, 19(2). Mueller, A. S., e Trick, L. M. (2012) Driving in fog: The effects of driving experience
and visibility on speed compensation and hazard avoidance. Accident Analysis and Prevention, 48, 472–479. doi: 10.1016/j.aap.2012.03.003. Ni, R., Bian, Z., Guindon, A., e Andersen, G. J. (2012) Aging and the detection of imminent collisions under simulated fog conditions. Accident Analysis and Prevention, 49, 525–531. doi: 10.1016/j.aap.2012.03.029. Park, J., Abdel-Aty, M., Wu, Y., e Mattei, I. (2019) Enhancing In- Vehicle Driving Assistance Information Under Connected Vehicle Environment. IEEE Transactions on Intelligent Transportation Systems, 20(9), 3558–3567. doi: 10.1109/TITS.2018.2878736. Road Segment Analyzed by a Driving Simulator for Sustainable Transport: Drivers’
Visual Profile. Sustainability, 13(16), 9448. doi: 10.3390/su13169448. Rosey, F., Aillerie, I., Espié, S., e Vienne, F. (2017) Driver behaviour in fog is not only a question of degraded visibility – A simulator study. Safety Science, 95, 50–61. doi: 10.1016/j.ssci.2017.02.004.
Effects of Intelligent Warning Systems on Drivers’ Steering Wheel Angle 459
Saffarian, M., Happee, R., e de Winter, J. C. F. (2012) Why do drivers maintain short headways in fog? A driving-simulator study evaluating feeling of risk and lateral control during automated and manual car following. Ergonomics, 55(9), 971–985. doi: 10.1080/00140139.2012.691993. Sodré, U. (2007) Matemática Essencial Ensino Fundamental, Médio e Superior no
Brasil. Obtido 10 de julho de 2022, de http://www.uel.br/projetos/matessencial/s uperior/calculo/maxmin/mm02.htm. Wu, Y., Abdel-Aty, M., Cai, Q., Lee, J., e Park, J. (2018) Developing an algorithm to assess the rear-end collision risk under fog conditions using real-time data. Tran- sportation Research Part C: Emerging Technologies, 87(February 2017), 11–25. doi: 10.1016/j.trc.2017.12.012. Wu, Y., Abdel-Aty, M., Park, J., e Zhu, J. (2018) Effects of crash warning systems on
rear-end crash avoidance behavior under fog conditions. Transportation Research Part C: Emerging Technologies, 95, 481–492. doi: 10.1016/j.trc.2018.08.001. Zhao, X., Xu, W., Ma, J., Li, H., Chen, Y., e Rong, J. (2019) Effects of connected vehicle-based variable speed limit under different foggy conditions based on simulated driving. Accident Analysis and Prevention, 128(April), 206–216. doi: 10.1016/j.aap.2019.04.020.
LISTED IN THE AHFE DIGITAL BOOKSTORE CATALOGUE
Explore the complete digital volume
Human Factors in Transportation
Read this individual research paper free through the original publisher, or explore the full digital proceedings book.
ISBN 978-1-958651-71-1
Explore this ISBN in the AHFE Bookstore ↗Listed in the July 2026 bookstore catalogue; search by ISBN to confirm current availability · Digital book purchase optional