Cyril Marx, Nikolai Ebinger, Erika Santuccio, Peter Moertl (2022). Bringing the Driver Back In-The-Loop: Usefulness of Letting the Driver Know the Duration of an Automated Drive and its Impact on Takeover Performance. In: Human Factors in Transportation. AHFE Open Access, vol. 60, pp. 432–440. https://doi.org/10.54941/ahfe1002475
A critical challenge of higher levels of automated driving (SAE level 3) is the reengagement of the driver to take back manual control. In this relatively novel mode of automated driving that is slowly becoming commercially available, the driver can perform non-driving related tasks but has to take over when the vehicle reaches the boundaries for its design domain for automated driving. The challenge here is for the driver to build sufficient situation awareness of the vehicle and the environment before taking back control in a timely and safe manner. In this study we investigated to what extent the driver could be helped by receiving predictive information about the duration of the automated driving as well as the available time for the reengagement.To address this research question, we conducted a simulator study where 41 participants drove alternating in manual mode and automated mode. Multiple times the participants had to take back control of driving prior to a stationary vehicle that blocked the lane. Audiovisual cues informed the participants about the necessary take-over 15 seconds in advance. The cockpit display showed the current driving mode (automated versus manual), as well as one of four types of prediction information: a) The baseline display type showed no prediction of time at all, b) the transition prediction (TP) display type showed the available time for the take-over, c) the automated driving prediction (AP) display type showed a remaining time during automated driving, and d) the combined display type showed both types of information (TP and AP). We compared the perceived usefulness of the prediction types in a questionnaire, the gaze behavior during control transition/automated driving segments as well as driving performance.The results indicate that the combined display type was perceived to be highly useful by the participants when transitioning control from automated to manual driving. This perceived usefulness is positively associated with their intention to use such a system in their daily lives. An analysis of the driver’s gaze indicates that drivers used the combined display type during takeovers and automated driving more than the other display types. Furthermore, drivers apparently acquired over time a safer gaze behavior with the combined display type as they monitored the road environment more during control transitions than in the other conditions. This effect was only present after a couple of takeovers, showing a gradual increase, which indicates that it requires some learning to fully utilize the time predictions.The results imply that a combined display type of predictive information about the duration of automated driving and reengagement time was perceived to be highly useful by the participants. In this paper we describe the results along with performance results and a comprehensive assessment with implications for further research.
Highly automated driving (AD) offers the promise of improved safety toge- ther with a multitude of previously unimagined possibilities such as reduced disparities, stress, and more meaningful activities while driving. Driving assi- stance such as lane keep assistants (LKA) and adaptive cruise control (ACC) have already become common in many new vehicles. Today the first vehi- cles that allow drivers to disengage from driving for extended periods of time come to the markets. Such level of automated driving is defined in the interna- tional taxonomy of automated driving SAE J3016 (SAE International, 2018) as Automated Driving at Level 3 and allows drivers to perform non-driving related tasks such as reading or watching a movie while the vehicle drives itself. However, the driver has to reengage and take back control for manual
Bringing the Driver Back In-The-Loop: Usefulness of Letting the Driver Know the Duration 433
driving when the vehicle has reached the end of its operational design domain, or an unexpected event is happening. Thereby, human factors research has shown that the reengagement of the human driver in the driving task can be complex and error-prone (see e.g. de Winter et al., 2014; Endsley, 2016, 2019; Hancock, 2019). After some periods of disengagement, it can be dif- ficult for the driver to takeover control and start driving again. Accidents or safety incidents could be the result. Therefore, much research is investigating how to increase the safety of takeover maneuvers. In this study, we investiga- ted whether drivers could be supported in the takeover and their experience using an automated vehicle by providing the duration of the automated drive and the transition period.
Possible Advantages of Displaying AD Duration During-Takeovers Uncertainty about the timing of takeover requests challenges the task of “fall- back ready” drivers and could be addressed by making the takeover request predictable. A better overview over the time constraints of the takeover and therefore less distraction due to thinking about the remaining time may allow for increased situation awareness, which is the perception, comprehension, and future projection of situations (Endsley, 1995). This takeover prediction (TP) could lead to an increased monitoring behavior and driving maneuver performance during takeovers. Beggatio et al. (2015) found in an interview study, among others the time remaining for takeovers is reported to be one of the most important information types an automated vehicle should feedback to the driver (Beggiato et al., 2015).
During-Automated-Driving Knowing the timing until the next take-over may reduce the amount of monitoring the driving task and instead may allow the driver to engage in non-driving related activities (NDRAs). Furthermore, the switch from the NDRA to the takeover task, which is essential for a fallback-ready driver, may be assisted by making it predictable when it should happen. In general, predictability brings benefits for task switching (Koch, 2005). When driving automated the indication of the car’s ability to drive automated increases both, the takeover performance and the time looking away from the road ahead (Helldin et al., 2013).
In general, drivers may perceive takeover and automated driving prediction as useful for their driving task.
Hypotheses Our hypotheses for the present study are, that AP should increase gazes on the display while in automated driving mode. TP should increase gazes on the display and should lead to better monitoring of the environment by looking more at the street while performing a takeover. Additionally, we expect dri- vers to find a display showing a combination of TP and AP more useful than only one alone, and that they would improve driving performance during takeovers than only TP or AP alone.
METHOD
Design To investigate these hypotheses, we conducted a driving simulator study with 41 participants (24 male, 17 female). Each participant drove a simulated vehicle with automated driving functionaliy and performed four takeovers during the study and was provided with one out of four duration prediction types. The study design was a mixed model with the takeover number as the within factor and the duration prediction type as the between subject factor. Dependent variables were the participants usefulness ratings, gaze behavior and driving performance.
Procedure The participants first answered questions on socioeconomic information and previous simulator sickness and technology affinity. Afterwards they were instructed with the simulator and the automated driving display (AD display) and had the chance to test it out. The experiment then consisted of one long drive on a two-lane street.
Participants started driving manually for one minute after which they alter- nated four times between automated driving segments of various lengths and manual drives each. The end of each automated driving segment was initiated by a broken down and still standing vehicle on the driver’s lane which they had to overtake. It was indicated by an auditive cue and a color animation on the display (pulsing between green and grey). Participants then stopped for a short time, answered some questions about the difficulty of the takeover, and continued to drive. To motivate the need for an automated mode, par- ticipants were asked to play a game on a handheld tablet during automated driving segments. They were instructed to get as many points in the game as possible. After the drive, participants answered questionnaires about useful- ness, perceived simulator sickness, and intention to use the previously used system in their everyday life.
Material Driving-Simulator The used driving simulator was fixed-based with three horizontally aligned screen to grant a wider field of view. It allows for automated driving functi- onality which, comparably to SAE level 3, can take over all driving tasks. The ADAS functionality is developed internally in ViF and implemented in Matlab® 2013. The driving simulator software used was CarMaker® 4.
Eyetracker To track the gaze of the participants, the SmartEye Pro system with two frontally mounted infrared sensors and infrared illuminators was used. The software SmartEye Pro 9.1 allows for tracking the drivers gaze direction and head rotation in real time and for interpreting the specific area of interest
Bringing the Driver Back In-The-Loop: Usefulness of Letting the Driver Know the Duration 435
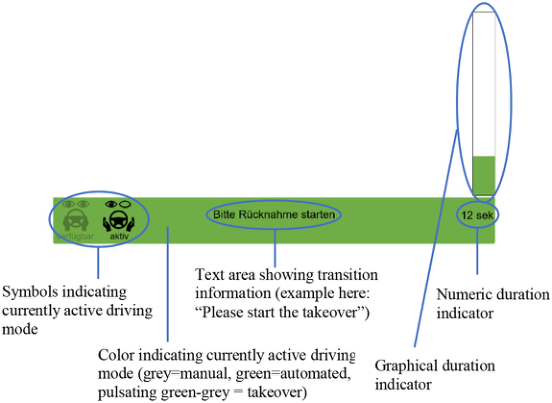
Figure 1: AD display with combined TP and AP information during a takeover.
(AOI) the driver looks at every given moment. We were especially intere- sted in AOI data regarding the frontal outside view, the speedometer, and the duration prediction display.
AD-Display Every subject used one of four different AD displays containing different information for each of the experimental conditions. a) The baseline display showed no duration prediction information at all. b) The takeover prediction (TP) showed duration indication in seconds during the 15 second takeover phase back to manual driving. c) The automated driving prediction showed duration indication for the duration of the automated driving in minutes. d) The combined duration prediction showed both information from TP and AP in minutes switching to seconds before the takeover. Durations were indi- cated with a numerical countdown in the bottom right corner and a graphical indicator in shape of a shrinking bar on the right-hand side of the display to visualize the time left. Additionally all display types showed a symbolic indi- cator of the current driving mode (manual or automated), as well as a colored interface showing the current driving mode (green for automated mode, grey for manual drive). The display presented auditive cues for critical events, such as availability of automated mode, start and end of automated mode, and start of 15 second takeover time. It also showed certain important informa- tion in textual form. An example of the combined duration prediction display with description of functional elements is presented in Figure 1.
Questionnaires Technology affinity was measured with the Affinity for Technology Scale (ATI) (Franke, Attig and Wessel, 2019) and intention to use the system in everyday life with adapted questions from a study by Nordhoff et al. about acceptance of conditionally automated cars (Nordhoff et al., 2020).
Usefulness of the system, difficulty of the takeover and simulator sickness were measured with one question each.
RESULTS
We defined outliers in our dependent variables as a deviance from the sam- ple’s average larger than three standard deviations. With this approach, we only had to exclude a maximum of two datapoints from an analysis at rare occasions. Mostly we did not have to exclude data. Due to invalid eyetracking data, five participants were excluded from the eyetracking analyses.
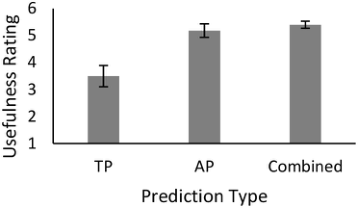
Usefulness Ratings of Duration Prediction When analyzing the usefulness ratings of the prediction types, we only com- pared the three different groups where a duration prediction was given. An ANOVA analysis revealed a significant difference between the groups (F (2, 27) = 4.60; p<.05; η2 = 0.25). Combined TP and AP are rated highly useful by the participants. Significantly higher than TP (p<.05). The precise usefulness ratings can be seen in Figure 2.
Gazes on Display as Indication of Display Use To analyze how much the display was used, we investigated different para- meters for the use during automated driving and during takeovers. When analyzing the use during automated driving, we calculated the percentage of total time participants looked at the AD display. Since the takeovers only took a few seconds and the display can be understood in a very short time, the average number of gazes are more representative for AD display use.
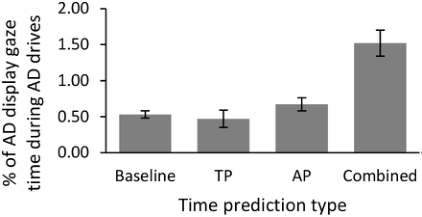
Drivers in the combined prediction use the AD display more often during takeover (F (3, 29) = 3.62; p<.05; η2 = 0.27) and in total longer during auto- mated driving (F (3, 31) = 6.23; p<.05; η2 = 0.28). Drivers with the combined prediction learn to focus their gaze more on the street during takeover after some takeovers (F (3, 29) = 5.62; p<.01; η2 = 0.37). Figure 3 shows the percentage of gaze time on the AD display during automated driving.
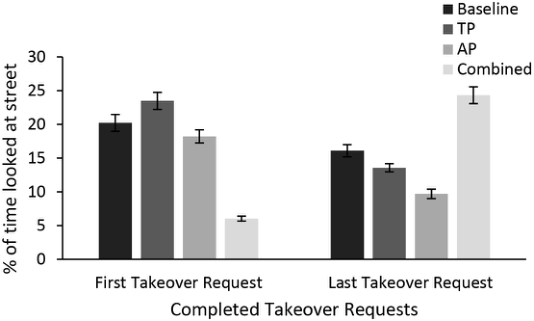
Monitoring Performance During Takeovers Our statistical analysis revealed an interaction between the duration pre- diction type and the number of the takeover (F (3, 29) = 5.62; p<.01; η2 = 0.37). Drivers with the combined duration displays look significan- tly less at the street during the first takeover, than other groups. During the last takeover however, they looked significantly more at the street than other groups (see figure 4).
Driving Performance After the takeover request, the driver was supposed to perform a double lane change maneuver to avoid a stopped vehicle ahead and then bring the vehicle to a stop at a “STOP”sign. In this interval we investigated a) maneuver length (in seconds); b) reaction time for maneuver; c) attentiveness of the driver (measured with steering wheel reversals); d) vehicle handling; and e) the speed
Bringing the Driver Back In-The-Loop: Usefulness of Letting the Driver Know the Duration 437
Figure 2: Reported usefulness of different duration predictions.Figure 3: Percentage of gazes of AD display during automated drives.Figure 4: Gaze at street during takeover in percent.
variation. The results show no significant differences between the AD display types.
Intention to Use Exploratively we additionally investigated the correlation between perceived usefulness and the intention to use takeover assistance. A Pearson correlation showed a positive relation between both (r(40) = .68, p < .001).
DISCUSSION
The present results partially support the hypotheses that the display of TP and AP information helps drivers during the take-over from automated to manual driving.
Usefulness of Displaying AP and TP Participants rated AP and the combined AD display highly useful while, TPs usefulness was rated as medium useful. This effect might be the result of the type of takeover task. The takeover was designed to be of low to average difficulty with only one vehicle to overtake and a little upcoming traffic, to get more control over the induced statistical effects. This could have led to an underestimation of the TPs usefulness since they could have benefitted more from it in a more complex environment with more audiovisual cues. AP however seems to be a highly useful feature for drivers of future automated vehicles, even in low difficulty situations.
Gaze Behavior of Drivers with the Combined TP and AP While it was expected, that people using TP would use the AD display more during takeovers and people using AP would use it more during automated driving, it appears that people only really use the display, when they have combined TP and AP information available all the time. This could have emerged due to the fact, that the combined duration prediction was displayed during the transition from automated driving to the takeover, while the AP countdown stopped before the takeover. It seems, that during this interval, a precise duration countdown in seconds was most beneficial to the drivers to mentally prepare for the takeover.
The beneficial effects of the TP and AP prediction as a countdown timer also could explain the lower street gaze time at the beginning of the study during takeovers for people with the combined duration indication. Peo- ple possibly were slightly distracted by the display. However, with growing experience they were able to utilize the combined duration indication more efficiently leading to more gaze time on the street.
Intention to Use the System Perceived usefulness seems critical for drivers to use takeover assistance for automated driving. The higher the driver’s perceived usefulness of takeover assistance, the higher is their intention to use it. Consequently, when intro- ducing a takeover assistance, it is important that it is useful for drivers, and they are aware of its usefulness. Such a system can only be perceived as use- ful, if drivers are aware that takeovers are critical for them. Assistance then must address the critical aspects perceived by the driver. The experience of using the takeover assistance informs the driver’s perceived usefulness and thus their intention to use it. Consequently, research as conducted in this study is needed to assess the extent to which assistance support meets the driver’s needs.
Bringing the Driver Back In-The-Loop: Usefulness of Letting the Driver Know the Duration 439
Study Limitations In the present experiment only one specific type of takeover was investigated. This takeover consisted of avoiding a static object on the street, which has a moderate difficulty. We also used a rather simple traffic environment of a country road without crossings, pedestrians, etc. This could explain the missing differences in driving performance during takeovers. It would make sense for future studies to investigate effects of duration displays in various other situations with more complexity and higher difficulty.
CONCLUSION
We can conclude, that drivers find the display the duration of automated driving duration as well as a combined display of automated driving and takeover duration highly useful. People also learn to monitor their envi- ronment better during takeover, if presented with a combination of both duration display types. However, drivers seem to require a acclimatization phase before being able to use it efficiently. Additional research should inve- stigate the effects of duration information in challenging driving scenarios and environments.
ACKNOWLEDGMENT
HADRIAN has received funding from the European Union’s Horizon 2020 re-search and innovation programme under grant agreement No 875597. This document reflects only the author’s view, the Innovation and Networks Executive Agency (INEA) is not responsible for any use that may be made of the information it contains. The publication was written at VIRTUAL VEHICLE Research Center in Graz and partially funded by the COMET K2 – Competence Centers for Excellent Technologies Programme of the Fede- ral Ministry for Transport, Innovation and Tech-nology (bmvit), the Federal Ministry for Digital, Business and Enterprise (bmdw), the Austrian Re-search Promotion Agency (FFG), the Province of Styria and the Styrian Business Promotion Agency (SFG).
REFERENCES
Beggiato, M. et al. (2015) ‘What would drivers like to know during automated driving? Information needs at different levels of automation.’, in. 7th conference on driver assistance, Munich: Unpublished. doi:10.13140/RG.2.1.2462.6007. de Winter, J.C.F. et al. (2014) ‘Effects of adaptive cruise control and highly auto-
mated driving on workload and situation awareness: A review of the empirical evidence’, Transportation Research Part F: Traffic Psychology and Behaviour, 27, pp. 196–217. doi:10.1016/j.trf.2014.06.016. Endsley, M.R. (1995) ‘Toward a Theory of Situation Awareness in Dynamic Systems’, Human factors, 37, pp. 32–64. Endsley, M.R. (2016) ‘From Here to Autonomy: Lessons Learned From Human–
Automation Research’, Human Factors, p. 0018720816681350.
Endsley, M.R. (2019) ‘Situation Awareness in Future Autonomous Vehicles: Beware of the Unexpected’, in Bagnara, S. et al. (eds) Proceedings of the 20th Con- gress of the International Ergonomics Association (IEA 2018). Cham: Springer International Publishing, pp. 303–309. doi:10.1007/978-3-319-96071-5_32. Franke, T., Attig, C. and Wessel, D. (2019) ‘A Personal Resource for Technology
Interaction: Development and Validation of the Affinity for Technology Intera- ction (ATI) Scale’, International Journal of Human–Computer Interaction, 35(6), pp. 456–467. doi:10.1080/10447318.2018.1456150. Hancock, P.A. (2019) ‘Some pitfalls in the promises of automated and autonomous vehicles’, Ergonomics, pp. 1–17. doi:10.1080/00140139.2018.1498136. Helldin, T. et al. (2013) ‘Presenting system uncertainty in automotive UIs for
supporting trust calibration in autonomous driving’, in Proceedings of the 5th International Conference on Automotive User Interfaces and Interactive Vehicular Applications - AutomotiveUI ‘13. the 5th International Conference, Eindhoven, Netherlands: ACM Press, pp. 210–217. doi:10.1145/2516540.2516554. Koch, I. (2005) ‘Sequential task predictability in task switching’, Psychonomic Bulletin & Review, 12(1), pp. 107–112. doi:10.3758/BF03196354. Nordhoff, S. et al. (2020) ‘Using the UTAUT2 model to explain public acceptance
of conditionally automated (L3) cars: A questionnaire study among 9,118 car drivers from eight European countries’, Transportation Research Part F: Traffic Psychology and Behaviour, 74, pp. 280–297. doi:10.1016/j.trf.2020.07.015. SAE International (2018) Taxomony and Definitions for Terms Related to Driving Automation Systems for On-Road Motor Vehicles: J3016. Venkatesh, V. and Bala, H. (2008) ‘Technology Acceptance Model 3 and a
Research Agenda on Interventions’, Decision Sciences, 39(2), pp. 273–315. doi:10.1111/j. 1540–5915.2008.00192.x.
LISTED IN THE AHFE DIGITAL BOOKSTORE CATALOGUE
Explore the complete digital volume
Human Factors in Transportation
Read this individual research paper free through the original publisher, or explore the full digital proceedings book.
ISBN 978-1-958651-36-0
Explore this ISBN in the AHFE Bookstore ↗Listed in the July 2026 bookstore catalogue; search by ISBN to confirm current availability · Digital book purchase optional