Ilit Oppenheim, Yisrael Parmet, Tal Oron-Gilad (2022). Can Driver Behavior be traced to Gender Role, Sex and Age?. In: Human Factors in Transportation. AHFE Open Access, vol. 60, pp. 450–459. https://doi.org/10.54941/ahfe1002477
Traffic violations are deliberate deviations from safe driving rules associated with enhanced risks for crash involvement, impacted by traits and demographics. Violations tend to decrease with age, males and young drivers tend to make more violations. But some studies reported the opposite or no sex differences. We argue that part of this ambiguity can be attributed to gender role (Undifferentiated, Feminine, Masculine, and Androgynous). Previously, we showed that for a group of 527 adult drivers (mean age 29), gender role was a better predictor of violation tendency than sex. Now we extend this study by using a larger sample in three age categories (≤20, 21-54, and 55-65). We aim to examine whether gender role contributes to explaining violations. We distributed a web-based survey containing self-reports of traffic violations (DBQ; Reason et al., 1990), the Bem Sex-Role Inventory (BSRI; Bem, 1974), and demographics. In total we collected 1039 questionnaires, 485 females and 554 males. We used a K-Means cluster analysis to define the gender role groups and came up with 5 meaningful clusters (Undifferentiated, Feminine, Masculine, Androgynous, and Mid). The mid group is new, and indicative of possible preconception in gender roles of the Bem inventory. We then conducted a three-way interaction model on violations. Gender role, age and sex predicted respondents' violation tendency, and their three-way interaction was statistically significant. The masculine young males had the highest predicted DBQ violation scores. Scores decreased with age except for the older masculine males. Furthermore, androgynous elderly males had the lowest scores. Our results show that there is value to include gender role in analysis of violations, and that this factor contributes over age and sex alone. Including gender role yielded better predictors of driver behavior than sex alone. The effect of gender role on drivers' self-reported violation tendency is an exciting and intriguing finding which indicates the need to further examine gender role effects in driving.
We focus on traffic violations, deliberate deviations from accepted proce- dures, standards, and rules of safe driving (like speeding). Traffic violations are associated with enhanced crash involvement (Barraclough et al., 2016). They are intentional, motivational acts influenced by attitude and personality and they occur among all driver age groups: young, adult and older (Lucidi et al., 2019). Reason et al.’s (1990), Driver Behavior Questionnaire (DBQ) remains the most popular self-report assessment tool (de Winter et al., 2015;
Can Driver Behavior Be Traced to Gender Role, Sex and Age? 451
Lucidi et al. 2019). There are different ways to look at violation tendency based on the DBQ, as one factor (Lucidi et al. 2019) or two factors or sepa- rating ordinary violations from aggressive (e.g., Rowe et al., 2015). Most of those with greater traffic tickets are males, and young drivers (Factor, 2018). A Meta-analysis of drivers’ violations, age and experience concluded that violations decrease with age (de Winter et al., 2010). The older the drivers, the lower their DBQ scores were, except for the ‘age related problems’ factor which had the opposite effect. Lucidi et al. (2019) suggested that personal characteristics like sex may be necessary. About three-quarters (73%) of road traffic fatalities are young males (WHO, 2018). Some studies show that sex differences in driving behavior persist even after adjusting for differences in mileage; male drivers are involved in more accidents, receive more traffic fines and self-report more traffic violations, whereas female drivers tend to commit more errors (González-Iglesias et al., 2012; Granie et al., 2021; Reason et al., 1990). Cordazzo et al., (2016) found that males were prone to have higher scores on ‘distraction and hurry’ and ‘aggressive violations’ factors, while women had higher scores on ‘age related problems’. Ellison et al., (2010) argued that the impact of sex on speed is not clear (see also Wundersitz et al., 2008). According to Bem (1974), there are other ways of distinguishing between males and females than their biological sex. Femininity and masculinity refer to the degree to which people see themselves as masculine or feminine given what it means to be a man or woman in society. Guého et al., (2014) found that sex (being female) predicted inexperience errors, where femininity nega- tively predicted the number of accidents. Another study of female drivers, aged 18 to 52, found that femininity was associated with driving aggression, with higher femininity scores predicting lower aggressive driving scores. In contrast, masculinity failed to predict aggressive driving (Krahé, 2005). In Özkan and Lajunen, (2005) a study with young drivers, sex (being male) predicted only ordinary violations, while masculinity correlated positively with the number of offences, aggressive and ordinary violations. Femininity correlated negatively with offences, aggressive and ordinary violations, and errors. An interaction between masculinity and femininity was found for the number of reported accidents and aggressive violations. Sullman et al. (2017), supported a positive relationship between masculinity and forms of aggres- sive anger expression, whereas, those high in femininity were more likely to express anger in adaptive and constructive manners. More recent, Deniz et al., (2021) suggested that masculinity and femininity moderate the relationship between driving anger and the expression of driving anger among young dri- vers. Nevertheless, gender role studies, should relate also to “androgynous” (those who score high on both masculinity and femininity) or “undifferen- tiated” (those who score low on both masculinity and femininity) types of gender role. How these two types are associated with driving behavior has hardly been investigated. Oppenheim et al. (2016) showed that for a group of 527 respondents with the mean age of 29 years, gender role was a better predictor of violation tendency than sex. Their results are indicative of the predictive potential of taking gender role into account when trying to explain risk-taking differences between and within groups of drivers, yet they only
examined one age category of adult drivers. The aim of the current study was to further investigate whether gender role is a better predictor than sex to drivers’ violations tendency, as measured by the DBQ, while considering the effects of age group. Looking at the predictability of age category (young, adult, and older adult drivers), sex, and gender role on violations tendency. It was hypothesized that: (1) in line with Oppenheim et al. (2016), gender role will be more highly correlated with violation tendency than sex, and (2) DBQ score will decrease with age and will be highest for the young drivers group.
METHOD
A self-completion web-based questionnaire was administered. It consisted of the Hebrew versions of the following: 60 items of the Bem Sex Role Inventory (BSRI, Bem, 1974), 12 violation items of the Driver Behaviour Questionnaire (DBQ, Reason et al., 1990) and demographic items – driving exposure, age, and sex.
Respondents One thousand thirty-nine respondents replied to the questionnaire. Average age was 33.5 (range 18-61, SD = 15.2), median = 27. Age was divided into three categories based on common distinctions in the literature; young (N = 264) ≤20 years old, median = 19, adult (N = 510): 21 to 54 years old, median = 27, and older adult drivers (N = 265): 55 to 65 years old, median = 58. Sex distribution was 554 (53%) males and 485 (47%) females. Five hundred and sixty-nine (55%) of the respondents drove less than 10,000 km per year. All respondents were Israelis.
Procedure The questionnaire was distributed via social media through social networks, forums, friends and colleagues in two waves; first, the adult respondents; see Oppenheim et al., (2016), then, during 2016/2017, efforts were made to reach younger than 20 and older than 55 respondents to expand the age range.
Variables A dataset was created. It consisted of the following variables: (1) Age, (2) Sex and (3) Gender role as measured by the BSRI - The 60 items are based on 20 female stereotypical traits and characteristics, 20 stereotypical masculine and 20 neutral characteristics. It provides independent assessments of mascu- linity and femininity in terms of the respondent’s self-reported possession of socially desirable, stereotypically masculine and feminine personality chara- cteristics. Respondents had to rate themselves on 1 (never) to 7 (always) scale. The dependent variable was the violation tendency as measured by the Driver Behavior Questionnaire (DBQ) - based on 12 violation questions; each que- stion specifies one kind of driving offense. Respondents rated their violation tendency according to the frequency they commit these offenses on a scale
Can Driver Behavior Be Traced to Gender Role, Sex and Age? 453
Table 1. Gender role median score among respondents and distribution across sex.
ranging from 1 (never) to 6 (almost always). Violation tendency was defined as one factor - the average of all 12 DBQ violation items.
RESULTS
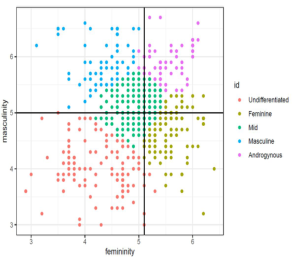
Gender Role Clusttering Gender Role. Each respondent had 2 scores, one for femininity and one for masculinity. There are different approaches to establish the typology of femi- ninity versus masculinity. Often, the empirical median is used to distinguish the high versus low in each of the two dimensions. In our dataset, a person was rated as high on femininity (F) or masculinity (M) if he/she obtained a score of F ≥5.1 and/or M > 5.0, respectively, yielding four groups: Undiffe- rentiated = low M and F; Masculine = high M and low F; Feminine = high F and low M and Androgynous = high M and high F. In this type of clas- sification most males are assigned masculine gender roles and most females; feminine gender roles, as shown in Table 1. Yet, median split may be overly dependent on the sample and tend to give the best results when the original variables have a symmetric distribution which is not the case here.
Therefore, we conducted the classification of gender roles from a data- driven approach by applying a cluster analysis with the K-MEANS method and Hartigan-Wong (Hartigan and Wong, 1979) algorithm. Trying several random starts (nstart> 1) is often recommended and we took nstart = 2000. The first attempt was to produce four clusters like the four groups in the median split division, this division yielded one large dominant cluster and three small clusters. Therefore, an attempt was made to move into five clu- sters. The division into five clusters indeed “split”the large cluster to two and was preferable to the division into four clusters by lower S_Dbw internal clu- stering validation measure (Halkidi and Vazirgiannis, 2001). The choice of S_Dbw was based on Liu et al., (2010). The analysis was done using R 4.1.2.
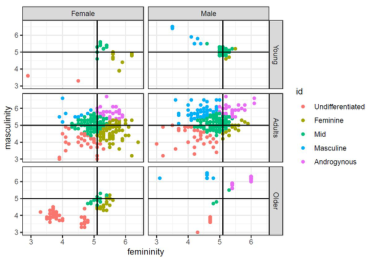
The five clusters are shown in Figure 1 and Table 2. It can be seen from Table 2 that cluster belonging (i.e., gender role) and sex are statistically dependent (χ2 (4) = 295.6 P<0.001). The distribution of responses by gender role, sex and age is shown in Figure 2. (*Note: two male respondents were excluded from the analysis because the model could not fit their observations to any cluster).
Table 2. Gender role median score among respondents and distribution across sex.
Table available in the original PDF paper.
Bem Median Score Female Male Femininity Masculinity Count Percent Count Percent
Figure 1: Distribution of respondents by gender role – per cluster analysis.Figure 2: Distribution of respondents by gender role, sex, and age – per cluster analysis.
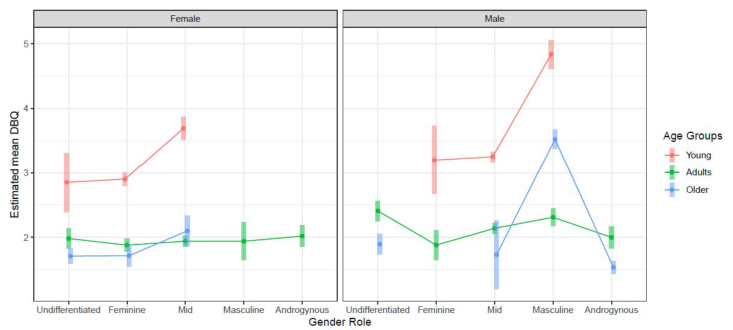
DBQ Violations Predictions Based on Gender Role, Sex and Age The average DBQ scores were relatively low, meaning people probably unde- restimate their violations tendencies. The total scores ranged from 1.0 to 5.2, the average equaled 2.3 (std. = 0.8) and the median equaled 2.1. A linear model (LM) analysis was carried out using R 4.1.2. A full factorial LM, inclu- ding all independent variables, age (3 categories), sex (2), and gender role (5) and all their two and three order interactions - and the DBQ score as the dependent variable. The three-way interaction was statistically significant. See Table 3 and Figure 3.
Can Driver Behavior Be Traced to Gender Role, Sex and Age? 455
Table 3. Tests of between subjects effects for the DBQ score.
Table available in the original PDF paper.
Factor Sum Sq Df F Sig.
Gender role 89.6 4 103.6 <.001 Sex 1.4 1 6.5 .011 Age 246.1 2 568.9 <.001 Gender role * Sex 2.5 4 2.8 .023 Gender role * Age 55.5 7 36.7 <.001 Sex * Age 5.7 2 13.1 <.001 Gender role *Sex* Age 2.0 2 4.6 .011 Residuals 219.3 1014
Figure 3: Estimated means for DBQ traffic violations by gender role, sex and age.
DISCUSSION
The literature review yielded only few yet relatively recent studies that exa- mine the relationship between gender role and driving behavior (Sullman et al., 2017; Albentosa et al., 2018; Deniz et al., 2021; Öztürk et al, 2021; Granie et al., 2021). Our results show a statistically significant interaction of gender role, age and sex on drivers’ self-reported violation tendency, with the highest scores for the young masculine males, followed by the young females within the mid group (average scores on both femininity and masculinity) and for the older masculine males. Furthermore, the young males within the mid and femininity groups declared moderate tendency to commit violati- ons. The lowest DBQ scores are predicted for the androgynous older males. Notably, the definition of the “common” four gender role groups in each and every study is based on study-specific median scores of femininity and masculinity which might be different in each sample. The review of the lite- rature did not reveal standard threshold scores for the four groups. However, Twenge (1997) investigated the changes in masculinity and femininity scores over twenty-year period (1973–1994) and showed a very linear increase in masculinity scores for women and for men and a possible increase in femini- nity scores for men, suggesting cultural and environmental changes. Recently, Donnelly and Twenge (2017) conducted a cross-temporal meta-analysis of
U.S. college students’ BSRI scores, from 1974 until 2012. They found that only women’s masculinity and androgyny scores were increased significan- tly, whereas women’s femininity, and men’s both masculinity and femininity scores showed no significant changes over the years. They suggested that the BSRI items do not match modern sex stereotypes, thus, the scales may need updates to reflect current conceptions of gender role. Our results support this assumption, as we identified 5 clusters; where the mid group accounts for 39% of the total, while the other four groups, altogether, were 61% (11% to 20% each). Further, our results are partially consistent with those presen- ted by González-Iglesias et al., (2012) who suggested that age, sex and annual mileage account for a large proportion of the variance in traffic violations. In that, the young, males, and those with increased exposure, violated traffic rules more frequently. de Winter et al. (2010) findings were that regardless of the age range of the sample in any study the correlation of violation with age remains moderate (r = −0.2). Zhao et al., (2012) found a significant interaction of violations and age (χ2 (2) = 9.390, p = .009). In their study the high-violation group contained more young participants (in their 20s’) whereas greater proportion of older participants (in their 60s’) was in the low-violation group. Yet, Krahé (2005), supporting Reason’s (1990) findings regarding decrease in aggressive driving behavior with age, found this effect particularly for women - the older they were, the less aggressive driving they reported. Our results indicate this same pattern for females, whereas among males the pattern was slightly different - young males were more likely to commit violations, but older masculine males were predicted to score higher on the DBQ compared to their adults (aged 21-54) counterparts. This finding is important since older masculine males are prone to drive like their young counterparts while their cognitive abilities are inferior. It may require consi- deration in terms of enforcement, insurance policies and awareness programs for drivers. To sum, our study reveals new findings regarding gender role, sex and age classifications which could have practical implications. Most stu- dies look for significant associations between DBQ factors and accidents (de Winter et al., 2010). Violations are related to accidents but are much more frequent, using violations can reduce the need to wait until an accident has occurred in order to intervene, and can provide more robust data (de Winter et al., 2015). The focus therefore has changed from accidents to unsafe acts as violations, and how they are traced to gender role, sex and age. Limita- tions. Specific questionnaires were used to measure gender role (BSRI, Bem, 1974), and violations tendency (DBQ, Reason et al., 1990). Other instru- ments to measure the same traits are available and could lead to different conclusions. We have used the one factor approach to calculate the DBQ violations, studies using the DBQ show a confusing range of different combi- nations of items, factors, statistical methods and results (Barraclough et al., 2016) yet it is acknowledged as a useful tool for traffic safety (de Winter et al., 2015). Regarding gender role assessment, there may be more reservations for using the BSRI. Fernández et al., (2010) found that the two questionnaires measuring gender role; Personality Attributes Questionnaire (PAQ, Spence & Helmreich, 1978) and the BSRI are not quite interchangeable when classif- ying individuals into the four-fold typology. It is not clear whether deficiencies
Can Driver Behavior Be Traced to Gender Role, Sex and Age? 457
in certain groups represent the population in general or only our sample. The source for the empty groups may be indicative of a limitation of the BSRI which is a stereotypical based tool to capture gender role among age groups due to behavioral and cultural changes over time and no standard cutoff criteria.
To conclude, understanding more about the characteristics of high- violation prone drivers is undoubtedly crucial for predicting safety-related behaviors. This is particularly crucial for speeding. Greaves et al., (2011) found that personality traits correlated with self-reported speeding behavior. However, they also noted that self-reported speeding behavior was context- specific and varied among speed zones. Thus, for the interim period of mixed traffic of driverless cars with human-driven vehicles on the road, it is neces- sary to investigate and understand driving behavior (e.g., driving speed, gap acceptance behavior, and lane variability). Zhao et al., (2012) found that dri- vers with high violations scores on the DBQ drive faster, have poorer lateral control, change lanes more frequently, spend more time in the left lane, and have more sudden unidirectional accelerations.
REFERENCES
Albentosa, J., Stephens, A. N., & Sullman, M. J., (2018). Driver anger in France: the relationships between sex, gender roles, trait and state driving anger and appraisals made while driving. Transportation research part F, 52, 127–137. Barraclough, P., af Wåhlberg, A., Freeman, J., Watson, B., & Watson, A., (2016).
Predicting crashes using traffic offences. A meta-analysis that examines potential bias between self-report and archival data. PLoS one, 11(4), e0153390. Bem, S. L.,(1974). The measurement of psychological androgyny. Journal of Clinical and Consulting Psychology, 42, 155–162. Cordazzo, S. T., Scialfa, C. T., & Ross, R. J., (2016). Modernization of the Driver
Behaviour Questionnaire. Accident Analysis & Prevention, 87, 83–91. Deniz, P., Lajunen, T., Özkan, T., & Gaygısız, E. (2021). Masculinity, femininity, and angry drivers: masculinity and femininity as moderators between driver anger and anger expression style among young drivers. Accident Analysis & Prevention, 161, 106347. de Winter, J. C., Dodou, D., and Stanton, N. A., (2015). A quarter of a century
of the DBQ: some supplementary notes on its validity with regard to accidents. Ergonomics 58, 1745–1769. doi: 10.1080/00140139.2015.1030460 de Winter, J. C. F., & Dodou, D., (2010). The Driver Behaviour Questionnaire as a predictor of accidents: A meta-analysis. Journal of Safety Research, 41(6), 463–470. Donnelly, K., & Twenge, J.M., (2017). Masculine and feminine traits on the Bem Sex-
Role Inventory, 1993–2012: A cross-temporal meta-analysis. Sex Roles, 76(9-10), 556–565. Ellison, A. B., & Greaves, S., (2010). Driver Characteristics and Speeding Behaviour.
In Australasian Transport Research Forum (ATRF), 33rd, 2010, Canberra, ACT, Australia. Factor, R., (2018). An empirical analysis of the characteristics of drivers who are ticketed for traffic offences. Transportation research part F, 53, 1–13.
Fernández, J., & Coelleo, M. T., (2010). Do the BSRI and PAQ really measure masculinity and femininity?. The Spanish journal of psychology, 13(02), 1000–1009. González-Iglesias, B., Gómez-Fraguela, J. A., & Luengo-Martín, M. Á., (2012). Dri-
ving anger and traffic violations: Gender differences. Transportation research part F, 15(4), 404–412. Granie, M.A., Thevenet, C., Varet, F., Evennou, M., Oulid-Azouz, N., Lyon, C., Meesmann, U., Robertson, R., Torfs, K., Vanlaar, W. and Woods-Fry, H., (2021). Effect of culture on gender differences in risky driver behavior through comparative analysis of 32 countries. Transportation research record, 2675(3), pp. 274–287. Greaves, S. P., & Ellison, A. B., (2011). Personality, risk aversion and speeding: An
empirical investigation. Accident Analysis & Prevention, 43(5), 1828–1836. Guého, L., Granié, M. A., & Apostololidis, T., (2014). Gender identity and risky behaviors among young drivers. In 5th International Conference on Women’s Issues in Transportation. Halkidi, M. and Vazirgiannis, M., (2001), November. Clustering validity asses-
sment: Finding the optimal partitioning of a data set. In Proceedings 2001 IEEE international conference on data mining (pp. 187-194). IEEE. Hartigan, J. A. and Wong, M. A. (1979). Algorithm AS 136: A K-means clustering algorithm. Applied Statistics, 28, 100–108. doi: 10.2307/2346830. Krahé, B., 2005. Predictors of women’s aggressive driving behavior. Aggressive
behavior, 31(6), 537–546. Liu, Y., Li, Z., Xiong, H., Gao, X. and Wu, J., (2010), December. Understanding of internal clustering validation measures. In 2010 IEEE international conference on data mining (pp. 911–916). IEEE. Lucidi, F. Girelli, L. Chirico, A. Alivernini, F., Cozzolino, M. Violani, C. and Mal-
lia, L., (2019). Personality traits and attitudes toward traffic safety predict risky behavior across young, adult and older drivers, Frontiers in Psychology 10, 536 Oppenheim, I., Oron-Gilad, T., Parmet, Y. and Shinar, D., (2016). Can traffic violations be traced to gender-role, sensation seeking, demographics and driving exposure?. Transportation research part F, 43, 387–395. Özkan, T., & Lajunen, T., (2005). Why are there sex differences in risky driving? The
relationship between sex and gender-role on aggressive driving, traffic offences, and accident involvement among young Turkish drivers. Aggressive Behavior, 31(6), 547–558. Öztürk, ˙I., Özkan, Ö. and Öz, B., (2021). Investigating sex, masculinity and femininity in relation to impulsive driving and driving anger expression. Transportation research part F, 81, pp. 14–26. Reason, J., Manstead, A., Stradling, S., Baxter, J., & Campbell, K., (1990). Errors
and violations on the roads: a real distinction? Ergonomics, 33, 1315–1332. Rowe, R., Roman, G. D., McKenna, F. P., Barker, E., & Poulter, D., (2015). Measuring errors and violations on the road: A bifactor modeling approach to the Driver Behavior Questionnaire. Accident Analysis & Prevention, 74, 118–125. Spence, J. T., & Helmreich, R. L., (1978). The Intermediate Personal Attributes Que-
stionnaire: A simplified version for children and adults. Unpublished manuscript Department of Psychology, University of Texas at Austin Sullman, M. J., Paxion, J., & Stephens, A. N., (2017). Gender roles, sex and the expression of driving anger. Accident Analysis & Prevention, 106, 23–30. Twenge, J. M., (1997). Changes in masculine and feminine traits over time: A meta-
analysis. Sex roles, 36(5-6), 305–325.
Can Driver Behavior Be Traced to Gender Role, Sex and Age? 459
World Health Organization, (2018). Road traffic injuries. World Health Organization. (Retrieved on 10th February 2019 https://www.who.int/news-room/fact- sheets/detail/road-traffic-injuries) Wundersitz, L., & Burns, N., (2008). Can personality characteristics and attitudes
predict risky driving behaviour among young drivers? In Joint ACRS-Travelsafe National Conference (2008: Brisbane, Australia). Zhao, N., Mehler, B., Reimer, B., D’Ambrosio, L. A., Mehler, A., & Coughlin, J. F., (2012). An investigation of the relationship between the driving behavior que- stionnaire and objective measures of highway driving behavior. Transportation research part F, 15(6), 676–685.
LISTED IN THE AHFE DIGITAL BOOKSTORE CATALOGUE
Explore the complete digital volume
Human Factors in Transportation
Read this individual research paper free through the original publisher, or explore the full digital proceedings book.
ISBN 978-1-958651-36-0
Explore this ISBN in the AHFE Bookstore ↗Listed in the July 2026 bookstore catalogue; search by ISBN to confirm current availability · Digital book purchase optional