Alessandro Calvi, Fabrizio D'Amico, Chiara Ferrante, Claudio Petrella (2022). To stop, or not to stop, that it the dilemma: evaluating the effects of safety countermeasures at signalized intersections during the yellow phase. In: Human Factors in Transportation. AHFE Open Access, vol. 60, pp. 476–485. https://doi.org/10.54941/ahfe1002480
At the onset of the yellow phase of signalized intersections, the approaching drivers may hesitate to decide to go or stop due to the dilemma zone (DZ). The drivers who decide to pass through the intersection might occur in red light violations and right-angle crashes, while some others might stop suddenly and prematurely with the subsequent risk of rear-end collisions. This study is aimed at analyzing the driver's behavior at the onset of the yellow signal, and identifying the most effective safety countermeasure for the resolution of the dilemma zone in order to help drivers in their stop/go decisions and reduce the risk of crashes. To achieve this objective, a driving simulator study was carried out and the effects of the following countermeasures were tested on a signalized intersection of an urban scenario: i) Green Signal Countdown Timers GSCT (C1); ii) newly developed horizontal marking and vertical warning sign (C2); iii) an in-vehicle advanced driving assistance system based on augmented reality and connected vehicle technologies (C3). The results revealed that the most effective countermeasure was C3 which provided the drivers with prompt and personalized suggestions based on their actual speed; in fact, a major reduction of Red Light Running (RLR) and length of the dilemma zone were recorded. C2 resulted in a significant reduction of the dilemma zone with the greatest consistency in driver decision-making behaviors. Finally, using C1 it was observed an unnecessary increase in early stopping rates with a reduction of the intersection efficiency.
The drivers who approach a signalized intersection may hesitate to decide to stop or cross it when the traffic light turns yellow: some drivers may decide to proceed and cross the intersection while others may prefer to stop. This indecision area before the signalized intersection is commonly defined as “dilemma zone” and it is quite critical in terms of road safety. In fact, within the dilemma zone the indecision and hesitation of drivers, along with their different perceptions and attitude, lead to greater variability in drivers’
To Stop, or Not to Stop, that it the Dilemma: Evaluating the Effects 477
stop and go decisions. It may result in dangerous interferences between stop- ping and crossing vehicles with the consequent risk of rear-end collision, as well as possible red light violations with potential right-angle collision with crossing vehicles or pedestrians. Several studies and crash reports highligh- ted that signalized intersections are one of the most dangerous areas of road networks, accounting for a substantial percentage of road traffic fatalities and injuries (e.g., Huang et al., 2014). According to previous findings (Chang et al., 2007), 2.5 million crashes occurred at intersections in the United Sta- tes in 2004, and 20% of these crashes were identified as related to signaling. Moreover, Wang and Abdel-Aty (2006) revealed that rear-end collisions tend to occur more frequently at signalized intersections (more than 40% of all signaled intersection collisions). Dilemma zone has been studied for a long time by several researchers (e.g., Gazis et al., 1960) who proposed a lot of countermeasures over the years for improving safety at signalized interse- ctions. Among the tested countermeasures, countdown timers (Chiou and Chang, 2010; Ma et al., 2010; van Haperen et al., 2016; Islam et al., 2017), pavement markings (Yan et al., 2007, 2009; Elmitiny et al., 2010), early warning systems and in-vehicle warning systems (Bar-Gera et al., 2013; Yan et al., 2015; Hussain et al., 2020) have been demonstrated to provide impro- vements in reducing the extent of the dilemma zone and helping drivers make fair and safer decisions at the beginning of the yellow signal. However, pre- vious studies have reported conflicting results and further research is needed to implement adequate measures that can significantly improve intersection safety and reduce the risk of crashes.
OBJECTIVES The overall aim of the research presented in this paper is to study the beha- vior of drivers approaching an urban signalized intersection at the onset of the yellow signal. Moreover, the study is aimed at identifying the most effe- ctive countermeasure that provides the highest safety benefits among those specifically designed and tested in a driving simulator for the resolution of the dilemma zone.
METHODOLOGY
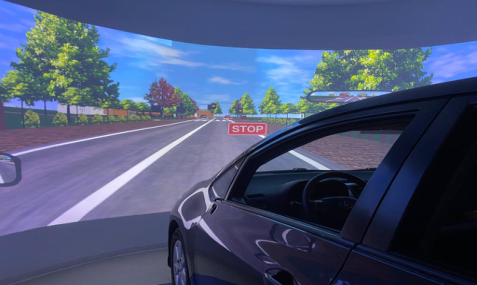
Driving Simulator The fixed-base driving simulator of the Road Safety Laboratory of the Depar- tment of Engineering at Roma Tre University (Figure 1) was used for the purpose of the study. It consists of a full cab Toyota Auris with the road sce- nario projected onto a 180° wide curved screen. The driving simulator has been fully validated in previous studies (Calvi, 2018; Calvi et al., 2020), and is typically used to investigate driving behavior in different road conditions and traffic operations (Calvi et al., 2015, 2018).
Scenario and Tested Configurations The scenario specifically designed and simulated in this experiment consisted in a two-lane urban road (50 km/h speed limit) with each lane 3.0 m wide,
Figure 1: Roma Tre driving simulator.
shoulders and sidewalks on both sides of 0.5 m and 4.0 m wide, respecti- vely. The yellow phase duration was set equal to 4s, according to the Italian recommendations (MIT, 2001) for urban intersections. The 4-kilometer road scenario included seven signalized intersections: five intersections were used for the aim of the study, meaning that the traffic light turned from green to yellow and the driver’s decision to stop or cross the intersection was analyzed; conversely, the other two intersections had always the green phase, and were included to avoid the driver’s expectation that the signal could change from green light to yellow light at each signalized intersection. The same scenario was used for creating four different configurations, each one corresponding to a different countermeasure tested in the study. Accordingly, the drivers had to perform four drives corresponding to the four configurations. Moreover, five different Distance To Stop Line (DTSL= 28 m, 42 m, 56 m, 69 m and 83 m) were set for the five intersections of the test: for each intersection the signal turned yellow when the driver was in a different position and distance (DTSL) from the intersection itself.
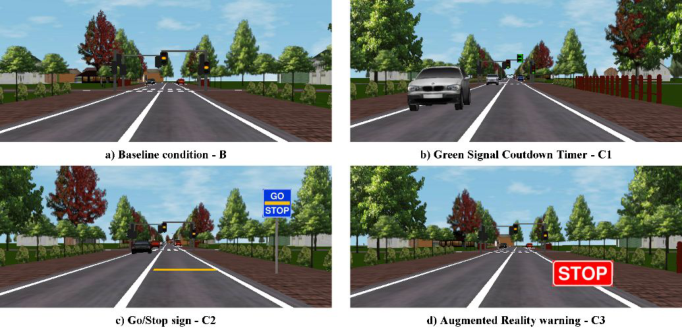
Countermeasures Four configurations of the road scenario were tested, each one chara- cterized by a different countermeasure, including a baseline configuration (B) that did not include any countermeasure (Figure 2a). The three tested countermeasures, shown in Figure 2, aimed at resolving the dilemma zone, consisted in: i) green signal countdown timer (GSCT) for vehicles, namely C1; ii) newly developed horizontal marking and vertical warning sign, namely C2; iii) in-vehicle advanced driving assistance system using augmented reality and connected vehicle technologies, namely C3. Countermeasure C1 was basically an auxiliary display with the green numbers 3, 2, 1 in sequence (Figure 2b), aimed at informing the drivers of the green time remaining before the start of the yellow phase. Countermeasure C2 was made up of a yellow horizontal line marking painted on the road pavement exactly at the same location of a vertical sign that reported the words “STOP/GO” in order to improve the driver’s understanding (Figure 2c): the drivers should slow down and stop when the yellow signal started before they had crossed the line; conversely,
To Stop, or Not to Stop, that it the Dilemma: Evaluating the Effects 479
Figure 2: Scenario and countermeasures.
if they had already crossed the line when the signal changed from green to yellow, then it was better to go ahead and cross the intersection. According to previous studies (Yan et al., 2007, 2009; Elmitiny et al., 2010), the ver- tical sign and the horizontal line marking were placed at the stopping sight distance from the stop line of the intersection, calculated under the assum- ption and hypothesis that drivers approached the intersection at the speed limit. Countermeasure C3 could be considered as a significant advancement of C2, as it took into consideration the actual speed (and not the speed limit) of the approaching driver when the yellow signal started; C3 consisted in an in-vehicle warning system based on augmented reality and connected vehicle technologies, specifically designed and tested in this study. The counterme- asure provided the driver with a timely and personalized warning (word “STOP”, Figure 2d), directly displayed on the vehicle’s windshield and based on her/his actual speed and distance from the intersection when the yellow signal started; when the stop warning was given, the drivers should not cross the intersection during the yellow phase, unless they increased their speed. It is advisable that this countermeasure needs that vehicles exchange information with the infrastructure (V2I), meaning they have to be connected to provide their position and speed to the vehicle-infrastructure connection system that, along with the residual duration of each traffic light phase, may or may not send the “STOP” warning to the driver.
Drivers Sample and Procedure Forty-six participants (31 men and 15 women) took part in the experiments. The sample of drivers had an average age of 39.4 years (SD = 15.7 years) ran- ging between 20 and 67 years. The same standard protocol was carried out for the simulations: each participant drove the same scenario four times (each one related to B, C1, C2 and C3) on two different days. After a questionnaire with general driver information and a preliminary drive of a training scena- rio to help the participant become familiarized with the tool, the participant has been made aware of the implemented countermeasures. The sequence
was diversified by groups of drivers to avoid any conditioning of the results relating to the order in which the configurations were proposed and tested.
Data Collection Several driving parameters from each simulation test were collected and analyzed for all the configurations (B, C1, C2 and C3) to evaluate poten- tial differences in driving behaviors recorded at the beginning and during the yellow phase between the different configurations; moreover, the data colle- ction was also developed to assess the effectiveness of the countermeasures in helping the drivers taking the right decision, and consequently improving the safety of urban signalized intersections. Specifically, the drivers’ decisions to stop or cross the intersection were collected in terms of the number of sto- p/go recorded in each configuration and for each DTSL; such analysis was useful for determining the length of the dilemma zone for each configuration. Moreover, the red light violations were also studied by collecting the num- ber and rate of the Red Light Running (RLR), to evaluate whether the driver crossed the intersection during the red phase or not. Finally, the driver’s speed at the onset and during the yellow phase was recorded to allow the study of the driver’s speed profile approaching the intersection.
RESULTS
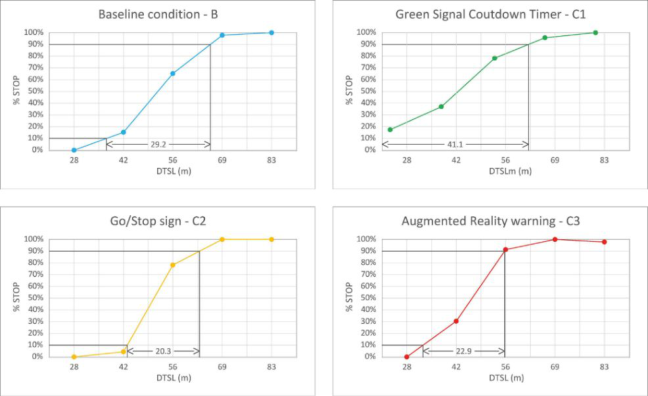
Length of Dilemma Zone The length of the dilemma zone for each configuration was measured accor- ding to Zegeer (1977), who suggested to compute it as the distance between two points where respectively 10% and 90% of drivers will decide to stop at a high-speed intersection when the signal turns yellow. The length of the dilemma zone is clearly related to the drivers’ indecision to stop or cross the intersection when the yellow signal starts; in fact, longer the dilemma zone, higher the inhomogeneity in drivers’ decision and consequently the likelih- ood of interferences among stooping and crossing vehicles that could lead to rear-end collisions and crashes. Conversely, shorter the dilemma zone, more homogeneous and consistent the driving behavior of the sample with signi- ficant benefits in terms of safety of the signalized intersection. Accordingly, for each configuration, the percentage of drivers who stopped at the inter- section for each DTSL has been calculated and shown in Figure 3, where it is also reported the extent of the dilemma zone related to each countermea- sure. It is possible to note that under the baseline condition (B), the dilemma zone had an extension of 29.2 m, significantly longer than those computed in C2 and C3 configurations (20.3 m and 22.9 m, respectively). Specifically, countermeasure C2 was found to be the most effective as it provided the lar- gest reduction of the dilemma zone of about 31% compared to B. However, also the reduction in the dilemma zone obtained with countermeasure C3 was notable, equal to 22%. Conversely, the implementation of the additional countdown timer that displayed the remaining seconds of the green phase before the starting of the yellow signal (C1) was revealed to be not effective
To Stop, or Not to Stop, that it the Dilemma: Evaluating the Effects 481
Figure 3: STOP percentage as a function of DTSL for the tested countermeasures.
at all, as it resulted in longer dilemma zone (41.1 m), even than that com- puted in the baseline condition. Moreover, in countermeasure C1 the highest percentages of drivers who stopped at the intersection were recorded, even for those DTSLs (28 m, 42 m, 56 m) where drivers could safely cross the intersection. It could increase the likelihood of rear-end collisions caused by excessively cautious drivers making unnecessary sudden stops at the interse- ction. Such increased number of stops recorded in C1 configuration could be explained considering that the drivers may have perceived the countdown time as an extension of the yellow phase rather than as a warning of the onset of the yellow phase; accordingly, the countermeasure could have incentivized the drivers to stop. Obviously, it provides safety benefits for those DTSLs where the drivers should have stopped, as the drivers anticipated their slow- down with a reduction in the average deceleration used (as it will be discussed later in the paper with the analysis of the drivers’ speed profiles); conver- sely, for the DTSLs where it was better to cross, this results in an increase of unnecessary stops with the consequent decrease in the efficiency and functi- onality of the signalized intersection. Instead, using countermeasures C2 and C3, most of the drivers behave according to the warning provided, resulting in a significant improvement obtained with the countermeasures thanks to their suggestions given to the drivers on the safest stop/go decision to take. Finally, with C2 and C3 it was found that the number of stop/go drivers were found to be more consistent and homogeneous, further reducing the potential risk of rear-end collisions and improving the functionality of the signalized intersection.
Red Light Violations For each one of the signalized intersections in all the configurations, the num- ber of the red light violations, as well as the percentage of Red Light Running (RLR) on total crossings were computed. A RLR was counted when the driver
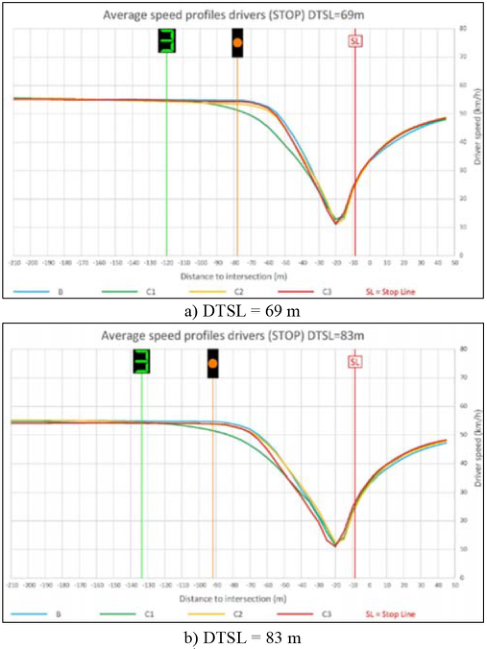
Figure 4: Drivers average speed profiles for a) DTSL = 69m and b) DTSL = 83m for the different countermeasures.
decided to cross the intersection and was located upstream of the stop line at the onset of red signal. The comparative analysis between the configura- tions with the countermeasures and the baseline condition revealed that all the countermeasures resulted in a reduction of the red crossings and of the RLR rate. Specifically, countermeasure C3 was found to be the most effective with only one RLR corresponding to 1.2% on total crossings. In the base- line condition, five RLRs were counted with 4.9% on total crossings. Also countermeasures C1 and C2 provided safety improvements with two and four RLRs (2.5% and 4.0% on total crossings), respectively.
Speed Profiles of Approaching Drivers For the signalized intersections where the yellow signal turned on at DTSL = 69m and 83m (i.e. the cases where the drivers should have stop- ped based on their speed and distance from the intersection) the profiles of the average speed of the drivers who have stopped have been plotted, as illustrated in Figure 4a and Figure 4b. The configurations are highlighted in different colors: light blue for B configuration, green for C1, orange for C2 and red for C3. Moreover, three colored vertical lines are shown in the
To Stop, or Not to Stop, that it the Dilemma: Evaluating the Effects 483
figure, corresponding to different locations: the distance from the interse- ction at which the driver is located when the number 3 was displayed on the countdown timer display (C1 configuration), colored in green; the distance from the intersection at which the driver is located at the onset of the yellow signal, colored in orange; the stop line of the intersection, colored in red.
Significant differences on the speed profiles between the configurations are shown in the figure, particularly evident in the configuration with the green signal countdown timer. In fact, it is notable that in C1 the drivers who intended to stop began to decrease their speed earlier than in the presence of the other countermeasures (110 m before the intersection for DTSL = 69 m and 125 m for DTSL = 83 m, respectively). Such earlier deceleration in the presence of timers resulted in a reduction in the applied braking forces with consequent implications in the safety conditions. However, as discussed in the previous section, C1 resulted in a higher number of drivers who stopped although they could have crossed safely the intersection, with a consequent decrease of the functionality and efficiency of the intersection itself. No signi- ficant differences were revealed for the other countermeasures with respect to the baseline condition.
CONCLUSION
This driving simulator study was aimed at analyzing the driver behavior at the onset of the yellow signal of a signalized intersection in an urban envi- ronment and to identify the most effective countermeasure for the resolution of the dilemma zone. The results revealed that the most effective counterme- asure is that based on augmented reality and connected vehicle technology (countermeasure C3), able to provide the drivers with timely and persona- lized suggestions based on their actual speed adopted; in fact, lower wrong drivers decisions have been recorded, along with a major reduction of Red Light Running (RLR) and extension of the dilemma zone. C2 resulted in a significant reduction of the dilemma zone with the greatest homogeneity of drivers’ decision-making behaviors. Finally, with C1 the drivers who decided to stop, reduced their speed much earlier, and the amount of stopping decisi- ons increased, indicating an unnecessary increase in early stopping rates and resulting in a reduction of the intersection efficiency; moreover, the dilemma zone expanded, with more inhomogeneous stopping/running decisions that may increase the risk of crashes.
Further studies are needed in order to enlarge the application of the fin- dings to other road contexts (e.g., rural roads), different types of signalized intersections, and using other characteristics (traffic, road and intersection geometries, vehicle maneuvers, operating speeds, etc.) that could affect the drivers’ decision, with the overall aim of generalizing the results and pro- viding useful guidelines for improving safety and operation of signalized intersections.
REFERENCES
Bar-Gera, H., Oron-Gilad, T., and Musicant, O. (2013), “In-Vehicle Stopping Decision Advisory System for Drivers Approaching a Traffic Signal.” Transportation Research Record, 2365, 22–30.
Calvi, A. (2018), “Investigating the Effectiveness of Perceptual Treatments on a Crest Vertical Curve: A Driving Simulator Study.” Transportation Research Part F: Traffic Psychology and Behaviour, 58, 1074–1086. Calvi, A., Bella, F., and D’Amico, F. (2015), “Diverging Driver Performance Along
Deceleration Lanes: Driving Simulator Study.” Transportation Research Record: Journal of the Transportation Research Board, 2518, 95–103. Calvi, A., Bella, F., and D’Amico, F. (2018), “Evaluating the effects of the number of exit lanes on the diverging driver performance.” Journal of Transportation Safety & Security, 10(1–2), 105–123. Calvi, A., D’Amico, F., Ferrante, C., and Bianchini Ciampoli, L. (2020), “A Dri-
ving Simulator Validation Study for Evaluating the Driving Performance on Deceleration and Acceleration Lanes.” Advances in Transportation Studies, 50, 67–80. Chang, J., Cohen, D., Blincoe, L., Subramanian, R., and Lombardo, L. (2007). CICAS-v research on comprehensive costs of intersection crashes. Paper Presented at the 20th International Technical Conference on the Enhanced Safety of Vehicles (ESV). Lyon, France, Location. http://www- nrd.nhtsa.dot.gov/departments/esv/20th/. Chiou, Y.-C., and Chang, C.-H. (2010), “Driver Responses to Green and Red Vehicular Signal Countdown Displays: Safety and Efficiency Aspects.” Accident Analysis & Prevention, 42, 1057–1065. Elmitiny, N., Radwan, E., Yan, X., and Jardaneh, M. (2010), “Field Testing of a Pro-
posed Pavement Marking as a Red Light Running Countermeasure.” The Open Transportation Journal, 4, 79–86. Gazis, D., Herman, R., and Maradudint, A. (1960), “The Problem of the Amber Signal Light in Traffic Flow.” Operations Research, 8(1), 112–132. Huang, H., Wang, D., Zheng, L., and Li, X. (2014), “Evaluating time-reminder
strategies before amber: common signal, green flashing and green countdown.” Accident Analysis & Prevention, 71, 248–260. Hussain, Q., Alhajyaseen, W.K.M., Brijs, K., Pirdavani, A., and Brijs, T. (2020), “Innovative countermeasures for red light running prevention at signalized inter- sections: A driving simulator study.” Accident Analysis & Prevention, 134, 105349. Islam, M.R., Wyman, A.A., and Hurwitz, D.S. (2017), “Safer Driver Responses at
Intersections with Green Signal Countdown Timers.” Transportation Research Part F: Psychology and Behavior, 51, 1–13. Ma, W., Liu, Y., and Yang, X. (2010), “Investigating the Impacts of Green Signal Countdown Devices: Empirical Approach and Case Study in China.” Journal of Transportation Engineering, 136, 1049–1055. Ministero delle Infrastrutture e dei Trasporti (MIT), 2001. Norme funzionali e
geometriche per la costruzione delle strade. In G.U. n 3, 4-1-2002 (in Italian). van Haperen, W., Pirdavani, A., Brijs, T., and Bellemans, T. (2016), “Evaluating Traffic Safety and Performance Effects of Countdown Timers on Signalized Inter- sections: A Driving Simulator Study.” Advances in Transportation Studies, an international Journal, 2016 Special Issue Vol. 1, 7–22. Wang, X., and Abdel-Aty, M. (2006), “Temporal and spatial analyses of rear-
end crashes at signalized intersections.” Accident Analysis & Prevention, 38, 1137–1150. Yan, X., Radwan, E., and Guo, D. (2007), “Effect of a Pavement Marking Countermeasure on Improving Signalized Intersection Safety.” Institute of Transportation Engineers. ITE Journal, 77(8), 30–32, 37-39.
To Stop, or Not to Stop, that it the Dilemma: Evaluating the Effects 485
Yan, X., Radwan, E., Guo, D., and Richards, S. (2009), “Impact of “Signal Ahead” Pavement Marking on Driver Behavior at Signalized Intersections.” Transporta- tion Research Part F: Psychology and Behavior, 12, 50–67. Yan, X., Liu, Y., and Xu, Y. (2015), “Effect of audio in-vehicle red light-running
warning message on driving behavior based on a driving simulator experiment.” Traffic Injury Prevention, 16(1), 48–54. Zegeer, C.V. (1977), “Effectiveness of Green-Extension Systems at High-Speed Intersections.” Research Report 472, Kentucky Department of Transportation.
LISTED IN THE AHFE DIGITAL BOOKSTORE CATALOGUE
Explore the complete digital volume
Human Factors in Transportation
Read this individual research paper free through the original publisher, or explore the full digital proceedings book.
ISBN 978-1-958651-36-0
Explore this ISBN in the AHFE Bookstore ↗Listed in the July 2026 bookstore catalogue; search by ISBN to confirm current availability · Digital book purchase optional