Alessandro Calvi, Fabrizio D'Amico, Chiara Ferrante, Gaia Calcaterra (2022). Driving simulator study for the effects of autonomous vehicles on drivers behaviour under car-following conditions. In: Human Factors in Transportation. AHFE Open Access, vol. 60, pp. 60–68. https://doi.org/10.54941/ahfe1002434
Research on autonomous vehicles has shown their high potential for reducing traffic congestion and emissions, as well as improving road accessibility and driving safety. Despite several contributions in the field, few studies have examined the impact that the presence of autonomous vehicles might have on conventional vehicle drivers in the mixed traffic flows that will characterize the transition from conventional vehicles to autonomous vehicles. The overall goal of this study is to provide new insights into the impact of autonomous vehicles on the behavior of following human drivers under car-following conditions. To achieve this goal, a driving simulator study was conducted, and the behavioral changes of forty drivers were examined by comparing their driving performance under three different car-following configurations, where the lead vehicle was: i) a recognizable (Marked) Autonomous Vehicle (AVM); ii) an unrecognizable Autonomous Vehicle (AV); iii) a Conventional Vehicle (CV). Finally, for each car-following configuration, different conditions were examined: ordinary conditions (constant speeds of the leading vehicle) and braking conditions. The results indicated that, under ordinary conditions, poorer safety performance was observed in the CV configuration. Conversely, under braking conditions, the safest performances were demonstrated in the CV configuration, while shorter response times were recorded in the AVM configuration. The study's findings contribute significantly to our understanding of human driving behavior in the car-following state in a mixed traffic flow.
The topic of autonomous driving has been approached by several research- ers from different perspectives. In fact, some studies have highlighted the major benefits of autonomous vehicles (AVS) in terms of improving road safety and operations (e.g., Aria et al., 2016; Talebpour and Mahmassani, 2016), while others have focused on the control transitions from manual to automated driving and take-over request (Roche et al., 2019), examining both the design of signals and warnings (Bazilinskyy et al., 2018) and the
A Driving Simulator Study on the Effects of Autonomous Vehicles 61
subjective psychological state of the driver (de Winter et al., 2014; Calvi et al., 2020b, 2020c). While there is a wealth of previous research examining factors related to autonomous driving in general, there are limited studies that specifically focus on the impact that autonomous vehicles might have on human drivers of conventional vehicles (CVS). It is an important research topic, especially considering that autonomous vehicles have very cautious and permissive driving behaviors compared to other vehicles. An autono- mous vehicle is trained to respect speed limits and safety distances, and, if safety conditions fail, it immediately works to restore them. This behavior could be overly cautious for human drivers, and it is not yet clear whether it could positively or negatively affect their driving performance, particularly during AVS-CVS interactions under car-following conditions. The actions of the following drivers are generally influenced by the behavior of the leading vehicle (Brackstone and McDonald, 2000), especially when the Time Hea- dway (TH) between them is less than 5 seconds (Bella et al., 2014). Rahmati et al. (2019) examined car-following conditions by comparing an event with only CVS and an event where the leading vehicle was an AV. A large dif- ference in driving behavior was observed, with human drivers feeling more comfortable when following the AV. In fact, they took smaller gaps and drove smoothly, avoiding sudden acceleration and braking. Another driving simu- lator study (Fuest et al., 2020) showed that the marking of the leading AV did not unduly affect the following human drivers, whose driving performa- nces were mainly dependent on the driving behavior of the leading vehicle. Participants also stated that it would be better to uniquely identify AVS as it would make them feel safer. Because of its importance for road safety, the interaction between AVS and CVS must be investigated.
Previous studies in this area are scarce and have reported conflicting results. Therefore, it is necessary to study the interactions between CVS and AVS under car-following conditions, and a tool established over the years to appropriately study driver behavior is the driving simulator. In fact, it has several advantages, including its versatility of use, the ability to test drivers in a controlled environment and at a low cost, and the ability to perform easily reproducible tests in a safe and very realistic environment. Accordingly, the present research used a driving simulator to improve knowledge by clarif- ying how much and to what extent the introduction of autonomous vehicles on roads could affect human driver behavior. In particular, it is not yet clear whether drivers may behave differently depending on whether they are dri- ving in the presence of autonomous or conventional vehicles. The goal of this research is to examine the behavioral changes that occur when human drivers follow autonomous cars and the influence these changes have on road safety.
METHOD
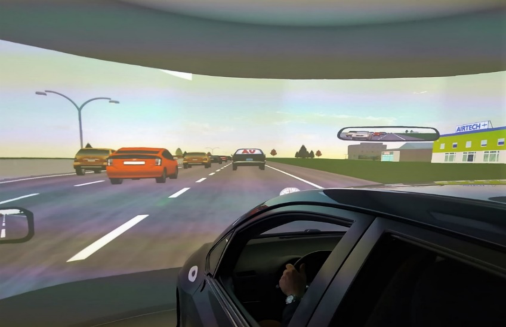
Equipment The driving tests were carried out in the Road Safety Laboratory of the Department of Engineering at Roma Tre University using a driving simu- lator consisting of a Toyota Auris with a full cab and force feedback steering
Figure 1: Roma Tre driving simulator.
wheel, brake and accelerator pedals (Figure 1). The simulated scenario is pro- jected onto a 180° wide curved screen using three high-resolution projectors. The system allows collecting multiple driving parameters at a frequency of 20 Hz. Previous studies (Calvi, 2018; Calvi et al., 2020a) validated the tool’s application to assess driving performance in terms of speed, acceleration, and trajectory under various driving conditions and road environments (Calvi et al., 2018; Calvi et al., 2015), and more specifically during car-following events (Bella et al., 2014; Calvi et al., 2020b).
Scenario A motorway scenario was implemented in the driving simulation. The cross- section of the motorway consisted of a two-lane carriageway with three lanes in each direction (each lane was 3.75 m wide), a hard shoulder of 3.00 m wide and a median of 4.00 m wide. Various elements, such as vertical signs and markings, vegetation, buildings, barriers, other vehicles, and intersecti- ons, have been included to make driving more realistic. Except in certain situations, there was a speed limit of 130 km/h. The same scenario was replicated using three different traffic configurations. In the first (namely, marked autonomous vehicle, AVM), the driver follows an autonomous veh- icle, recognizable by a sign (see Figure 1) in the rear window of the vehicle. In the second, namely AV, the leading vehicle was an unrecognizable autono- mous vehicle that adopted the same behavior as the first, being very cautious and permissive towards the other vehicles. Finally, a conventional leading vehicle (CV) with typical human driver behavior was deployed in the third car-following configuration.
Car-Following Events For each configuration, three car-following events were implemented under different driving conditions: two ordinary conditions, where the leading veh- icle assumes a constant speed, and one braking condition, with the leading vehicle braking heavily. In this first event, the driver had to follow a vehicle
A Driving Simulator Study on the Effects of Autonomous Vehicles 63
in front at a constant speed of 90 km/h in the right lane, while in the middle lane, a platoon of vehicles with a higher speed and a short headway was fine to prompt the driver to avoid overtaking the vehicle in front. During the event, a vehicle from the platoon pulled into the right lane directly in front of the leading vehicle, leaving an unsafe distance between them. In the autonomous vehicle (AV and AVM) configurations, the leading vehicle bra- ked slightly to restore the safe distance from the vehicle in front, while in the conventional vehicle (CV) configuration, the leading vehicle did not brake because the human driver saw the faster vehicle being driven in the middle lane and moved away from it. The second car-following event took place on a single-lane exit ramp at a motorway junction. The driver again had to follow a leading vehicle, which assumed a constant speed of 50 km/h in the cases of an autonomous vehicle and a typical speed profile of a human driver of around 50 km/h in the case of a conventional vehicle. Finally, the third car- following event took place at a motorway work zone where the road section was reduced from three lanes to one and the speed limit was 60 km/h. Due to the presence of personnel at work in the AV and AVM configurations, and a speed camera in the CV configuration, the leading vehicle abruptly braked during the event with a deceleration of 5.5 m/s2.
Participants A sample of drivers consisting of 40 participants (25 men and 15 women; ages ranging between 22 and 33 years; mean age of 27.2 years) took part in the dri- ving tests. No participants reported symptoms of simulation sickness during and after the tests. Two drivers caused accidents due to speeding and were excluded from the analysis as they were considered outliers according to the Chauvenet criterion (Taylor, 1997). Thus, the final sample consisted of 38 dri- vers (24 males and 14 females) with a mean age of 27.1 years (SD = 3.0 years) and an age range of 22–33 years. Furthermore, for each car-following event, those drivers who assumed a Time Headway (TH) greater than 5 seconds were excluded from the single event analysis since it was not possible to con- sider them involved in a car-following event (e.g., Fitzpatrick et al., 1997; Bella et al., 2014).
Procedure The same standard protocol was applied to each driver to avoid results being biased by attitudes, driving experience, age, stress level, emotional state, neurocognitive state, or other factors. Two different driving sessions were scheduled for two non-consecutive days. During the first session, each driver, after completing a pre-driving questionnaire with general information about the driver, was invited to participate in a training scenario to help the par- ticipant become familiar with the tool and one of the three configurations of test (AV, AVM, or CV). In the second session, each participant drove the remaining two configurations. After each driving test, the participants filled out a follow-up questionnaire about the type and severity of any complaints
(nausea, dizziness, tiredness, etc.) that they might have experienced while dri- ving. To eliminate any interference from repeating the same order under the experimental conditions, the order of the drives was set at random.
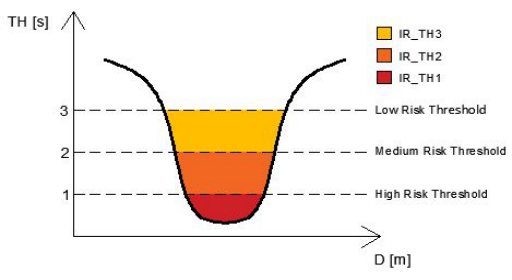
Data Collection To study driver behavior under car-following conditions, several researchers (e.g. Brackstone and McDonald, 2000; Bella et al., 2014; Calvi et al., 2020b) have shown that the main factor involved in most rear-end collisions is han- ging related to the way you drive, especially following too closely a vehicle in front. Accordingly, Time-To-Collision (TTC) and Time Headway (TH) are typical safety indicators related to car-following conditions and were colle- cted for the purpose of this analysis. Hayward (1972) defines TTC as the time remaining until a collision between two vehicles if they continue along their predicted path at the same speed and trajectory; TH is the time difference between the front of the leading vehicle passing a point on the lane and the front of the following vehicle passing the same point. Previous studies (Vogel, 2003; Bella et al., 2014) showed that TH and TTC in car-following events are independent and worth studying separately. In addition, according to the literature (Bella et al., 2014), three risk thresholds for TH and TTC, respe- ctively, have been defined: a high-risk condition corresponds to TH below 1 s or TTC below 2 s; a medium-risk condition corresponds to TH less than 2 s or TTC less than 3 s; and finally, a low-risk condition corresponds to a TH less than 3 s or a TTC less than 4 s. To account for the distance traveled below each risk threshold, risk indicators (IRs) specific to both TH and TTC were proposed in this study. After plotting the profile of TH or TTC along with the distance traveled by each driver under ordinary conditions, the risk indicators were calculated as the area between the TH/TTC profile and the horizontal line representing each risk threshold, as shown in Figure 2 (as only IRs for TH are shown as an example). Differently, in the braking condition other parameters were recorded: the minimum Time Headway (THmin) and Time-To-Collision (TTCmin); the Time Headway recorded when the leading vehicle began braking (TH1), when the follower vehicle began braking (TH2), and when the follower vehicle stopped braking (TH3); the Time-To-Collision recorded when the follower vehicle began braking (TTC2); the driver’s rea- ction time (RT) which is the time gap between the leading vehicle’s braking and the point when the driver begins to brake.
RESULTS
Ordinary Condition Each configuration (AV, AVM, CV) and each car-following event (ordinary and braking condition) received a detailed analysis of the data collected.
In ordinary events, the values of each Risk Indicator (IR) in terms of TH and TTC were collected and compared between the different types of lea- ding vehicles. Subsequently, the analysis of variance (one-way ANOVA 3x1) was performed: the different types of the leading vehicle (AV, AVM, and CV) were considered as independent variables and their impact on each dependent
A Driving Simulator Study on the Effects of Autonomous Vehicles 65
Figure 2: Risk indicators (IRs) related to TH.
variable, namely the Risk Indicators, was assessed. All acquired data were subjected to the Kolmogorov-Smirnov test prior to completing the ANOVA to ensure that the assumption of normality required by the ANOVA was met. Also, a sphericity test was performed to test whether the sphericity was vio- lated; Bonferroni’s correction was used for multiple comparisons. Finally, a significance level of 0.05 was assumed for the significance test (p-value).
Under ordinary conditions, with the leading vehicle moving at 90 km/h, the statistical tests showed that the drivers adopted higher IRs in the CV configuration for both the TH and TTC parameters. The overall results are summarized in Table 1, where it is quite evident that all IRs related to both TH and TTC are higher in the CV configuration than in AV and AVM; in addition, IRs corresponding to low- and medium-risk states associated with TH were found to be statistically significant. In such circumstances, pairw- ise analyses revealed a substantial difference between the CV configuration and both the AV and AVM configurations, whereas there were no significant differences between the AV and AVM configurations.
Under ordinary conditions, with the leading vehicle moving at 50 km/h, similar results were obtained; the IRs were found to be greater in the CV configuration, and the differences in the low and medium risk thresholds for TH were significant once again.
Accordingly, the results showed that in car-following events under ordi- nary conditions, namely when the leading vehicle is moving at a constant speed, the following driver adopted safer behaviors when the leading vehicle was an autonomous one. At car-following events, the interaction between the vehicles seems to be able to benefit from the market introduction of autono- mous vehicles even in the transition period with mixed traffic flows (CVS and AVS). Furthermore, most IRs are lower in AVM than in AV configura- tion, despite the fact that this is not statistically significant, implying that labelling the autonomous vehicle to make it recognizable to human drivers has an additional favorable effect.
Braking Condition During braking condition, it was observed that the proportion of trailing drivers reacting to the leading vehicle’s braking maneuver with emergency
AV AVM CV TH IR Low risk TH < 3s 201.37 191.34 253.47 0.016 IR Medium risk TH < 2s 51.49 30.72 81.14 0.001 IR High risk TH < 1s 0.41 0.20 3.91 0.209 TTC IR Low risk TTC < 4s 0.30 0.39 1.35 0.839 IR Medium risk TTC < 3s 0.11 0.08 0.46 0.673 IR High risk TTC < 2s 0.05 0.00 0.05 0.445
Ordinary condition at 50km/h Mean p-value
AV AVM CV TH IR Low risk TH < 3s 42.38 33.52 62.87 0.017 IR Medium risk TH < 2s 10.11 7.53 23.15 0.014 IR High risk TH < 1s 0.04 0.00 1.41 0.228 TTC IR Low risk TTC < 4s 0.73 0.14 0.85 0.302 IR Medium risk TTC < 3s 0.04 0.00 0.14 0.529 IR High risk TTC < 2s 0.00 0.00 0.00 0.255
braking was significantly higher in both the AV and AVM configurations (45% and 58%, respectively). Only 8% of the drivers barely braked when the leading vehicle was a conventional vehicle (CV), probably due to the larger spatial/temporal distances between the two vehicles in such a configuration as shown in Table 2, which allowed the following driver to have one inte- rvene to brake less in order to avoid a collision with the braking vehicle in front. An analysis of variance (one-way ANOVA 3x1) was performed using the different types of leading vehicles (AV, AVM, and CV) as the independent variables and each of those recorded at the braking event and included in the “Data Collection” section as the dependent variables. Table 2 shows the mean (in seconds) of each variable for the three configurations along with the statistical ANOVA results (p-value). Most TH variables (TH1, TH2, and THmin) were statistically higher in the CV configuration, confirming the lar- ger distances from the leading vehicle that the following driver maintained in such a configuration during braking. Most striking are the results of the analysis developed for TTC variables (TTC2 and TTCmin), which confirm the results of the TH analysis with larger differences between CV and AV configu- rations. Furthermore, it should be emphasized that no significant differences were found for TH and TTC variables between the AV and AVM configu- rations. In summary, the results indicated that in the braking condition, the trailing driver adopted safer and more conservative behavior towards the leading vehicle if it was a conventional vehicle, which probably indicates to some extent greater reliance on an autonomous vehicle, which may not be positive in terms of safety status. However, it should be noted that the auto- nomous vehicle marking could provide additional safety benefits because the following driver’s reaction time (RT) was significantly shorter in the AVM configuration, indicating a faster reaction time of the following human driver to the detectable autonomous vehicle’s braking action.
A Driving Simulator Study on the Effects of Autonomous Vehicles 67
CONCLUSION AND FURTHER RESEARCH This study examined driver behavior under car-following conditions with different types of leading vehicles, namely conventional vehicles or detecta- ble and undetectable autonomous vehicles. The effects of AVS on the driving behavior of followers in a mixed traffic flow were observed, and the data collected and analyzed showed that the introduction of autonomous vehi- cles onto roads could induce some differences in the driving performance of human drivers during car-following manoeuvres. In fact, the results show that driver behavior when following an AV differs from that when following a conventional vehicle, with corresponding safety implications. In particu- lar, it was found that, under ordinary conditions, drivers accepted higher risk indicators (IRs) in the CV configuration, both at low and high spe- eds. In other words, under these conditions, the cautious behavior of the preceding autonomous vehicle positively influences the other drivers, who mimic the AV’s actions. Under braking conditions, larger TH and TTC were observed between the driver and the conventional vehicle than in the case of an autonomous vehicle as the leading vehicle. This result, recorded in both the AV and AVM configurations, could be due to the overly cauti- ous driving behavior of the autonomous vehicles, whose hard braking is not expected by the other drivers. A possible explanation is that after the autonomous vehicle, the discomfort of the other drivers increased with the resulting acceptance of higher risk behavior. When braking, however, the AVM configuration resulted in faster reaction times of the following driver. It is possible that the introduction of the marking, which is truly innova- tive, may boost drivers’ attention. It would be fascinating to see if this result would hold up over time or if the drivers would grow accustomed to the marker.
It would also be interesting to study other types of maneuvers, such as lane-changing and gap acceptance, in the presence of autonomous vehicles. Because the advantages of platooning autonomous vehicles are well-known, such as reduced congestion, fuel consumption, and emissions, it may be wor- thwhile to investigate human driver behavior in the presence of platoons of autonomous vehicles and trucks, as well as their interactions in terms of safety and operating conditions.
REFERENCES Aria, E., Olstam, J., and Schwietering, C. (2016), “Investigation of automated vehicle effects on driver’s behavior and traffic performance.” Transportation Research Procedia, 15, 761–770. Bazilinskyy, P., Petermeijer, S.M., Petrovych, V., Dodou, D., and de Winter, J.F.C.
(2018), “Take-over requests in highly automated driving: A crowdsourcing survey on auditory, vibrotactile, and visual displays.” Transportation Research Part F, Traffic Psychology and Behaviour, 56, 82–98. Bella, F., Calvi, A., and D’Amico, F. (2014), “An empirical study on traffic safety indicators for the analysis of car-following conditions.” Advances in transportation studies, Special Issue 2014, Vol. 1, 5–16. Brackstone, M., and McDonald, M. (2000), “Car following: A historical review.”
Transportation Research Part F: Psychology and Behaviour, 2(4), 181–196. Calvi, A., Bella, F., and D’Amico, F. (2015), “Diverging Driver Performance Along Deceleration Lanes: Driving Simulator Study.” Transportation Research Record: Journal of the Transportation Research Board, 2518, 95–103. Calvi, A. (2018), “Investigating the Effectiveness of Perceptual Treatments on a
Crest Vertical Curve: A Driving Simulator Study.” Transportation Research Part F: Traffic Psychology and Behaviour, 58, 1074–1086. Calvi, A., Bella, F., and D’Amico, F. (2018), “Evaluating the effects of the number of exit lanes on the diverging driver performance.” Journal of Transportation Safety & Security, 10(1–2), 105–123. Calvi, A., D’Amico, F., Ferrante, C., and Bianchini Ciampoli, L. (2020a), “A
Driving Simulator Validation Study for Evaluating the Driving Performance on Deceleration and Acceleration Lanes.” Advances in Transportation Studies, 50, 67–80. Calvi, A., D’Amico, F., Ferrante, C., and Bianchini Ciampoli, L. (2020b), “A driving simulator study to assess driver performance during a car-following maneu- ver after switching from automated control to manual control.” Transportation Research Part F: Psychology and Behaviour, 70, 58–67. Calvi, A., D’Amico, F., Ferrante, C., and Bianchini Ciampoli, L. (2020c), “Evaluation
of driving performance after a transition from automated to manual control: a driving simulator study.” Transportation Research Procedia, 45, 755–762. de Winter, J.C.F., Happee, R., Martens, M.H., and Stanton, N.A. (2014), “Effects of adaptive cruise control and highly automated driving on workload and situation awareness: A review of the empirical evidence.” Transportation Research Part F, Traffic Psychology and Behaviour, 27, 196–217. Fitzpatrick, K., Shamburger, C., Krammes, R., and Fambro, D. (1997), “Operating
Speeds on Suburban Arterial Curves.” Transportation Research Record, 1579, 89–96. Fuest, T., Feierle, A., Schmidt, E., and Bengler, K. (2020), “Effects of marking automated vehicles on human drivers on highways.” Information, 11(6), 286. Hayward, J.C. (1972), “Near Miss Determination Through Use of a Scale of Danger.”
Highway Research Record, 384, 24–34. Rahmati, Y., Khajeh Hosseini, M., Talebpour, A., Swain, B., and Nelson, C. (2019), “Influence of autonomous vehicles on car-following behavior of Human drivers.” Transportation Research Record, 2673(12), 367–379. Roche, F., Somieski, A., and Brandenburg, S. (2019), “Behavioral changes to repeated
takeovers in highly automated driving: effects of the takeover-request design and the nondriving-related task modality.” Human Factors, 61(5), 839–849. Talebpour, A., and Mahmassani, H.S. (2016), “Influence of connected and autonomous vehicles on traffic flow stability and throughput.” Transportation Research Part C: Emerging Technologies, 71, 143–163. Taylor, J.R. (1997), “An Introduction to Error Analysis”, 2nd ed. University Science
Books 166–168, Sausalito, CA. Vogel, K. (2003), “A comparison of headway and time to collision as safety indicators.” Accident Analysis & Prevention, 35, 427–433.
LISTED IN THE AHFE DIGITAL BOOKSTORE CATALOGUE
Explore the complete digital volume
Human Factors in Transportation
Read this individual research paper free through the original publisher, or explore the full digital proceedings book.
ISBN 978-1-958651-36-0
Explore this ISBN in the AHFE Bookstore ↗Listed in the July 2026 bookstore catalogue; search by ISBN to confirm current availability · Digital book purchase optional