Marcel Saager, Jan Patrick Osterloh, Yvonne Brück (2022). KONECT: Implementation and Extension of a Method for the Development of Safety-Critical Human-Machine Interaction Interfaces. In: Human Factors in Software and Systems Engineering. AHFE Open Access, vol. 61, pp. 1–8. https://doi.org/10.54941/ahfe1002515
In safety-critical systems, monitoring can be risky, because overlooking or misinterpreting important information can lead to serious consequences. For this purpose, the KONECT method was developed. The method is capable of systematically deriving information visualizations for monitoring tasks in safety-critical systems. We have studied this method and describe planned extensions and implementations of the steps of the KONECT method. In this way, the method offers more possibilities and can be applied more easily by the user.
The current trend towards automation and application of AI in all transpor- tation modes (air, street, rail, water) require steadily increasing monitoring by the human operator. Especially the implementation of highly automated or autonomously driven vehicles (e.g. cars, vessels, air-taxis) require the establi- shment of mission control centers. In such control centers, human operators monitor each individual vehicle in order to detect faulty systems or stuck vehicles. In this monitoring process, changes in safety-critical system states should be noticed as quickly as possible, so that actions can be taken. Additio- nally, the amount of information that remote operators must process in these monitoring activities continues to increase. It is important to design user inter- faces that allow fast reaction times as well as mitigate possible human error to improve the performance in monitoring. We propose a methodical approach, allowing system developers and designers to systematically develop designs, which are optimized for human performance. The KONECT method offers a way to design such human-machine interfaces. A very engineering driven approach allows designers to create a user interface that, according to the basic principles of design, results in a solution that has the shortest possi- ble response time of the operator to critical system states. Up to now, the method is limited to fast recognition of quantitative and qualitative values (Harre 2018).
In this paper, we will describe the shortcomings of the current KONECT method and its tool support, and will make proposals for future develo- pments and research questions. The method is divided into four steps. As a first step, a task analysis is performed followed by the second step and most important part the idea box creation. After a creative design step is per- formed, the method provides a design adjustment step, in which the design will be proved against composing guidelines. Afterwards, we will describe the shortcomings of each of these four steps and discuss enhancements from a scientific perspective as well as for the implementation of the method. In addition, we will describe a web application to guide designers through the methodical procedure as well as the idea box creation.
STATE OF THE ART In practice, user interfaces are often developed without a systematic method, so that the design of displays and user actions is often ad-hoc, without comprehensible decision criteria. In science, model-based methods such as Hierarchical Task Analysis (HTA), and the Ecological Interface Design (EID) methods have been developed. In the hierarchical task analysis, the user’s tasks are systematically collected (through user interviews, empirical obse- rvations of the users and literature research) and recorded in the form of a hierarchical model. At first, tasks with a high degree of abstraction are defined, which can then be successively broken down into smaller subtasks (Harre 2018).
With the help of this analysis, an overview of the user’s tasks is created and the information that needs to be displayed can be systematically derived, as well as an efficient structure of the display. For example, information that is needed in a task should be spatially close together on the display and opera- ting concept so that a visual search and thus a higher workload as well as a higher expenditure of time to complete the task is avoided. It must be consi- dered that the task analysis only maps conscious tasks of the users, especially routine tasks (Diaper & Stanton 2003).
To provide optimal support for rare unforeseen situations, the Ecologi- cal Interface Design (EID, work domain analysis) method was developed. To make this possible, the EID method performs a change of perspective: instead of placing the user and his or her tasks at the center of the analysis, the EID method has the focus on the working environment and the contexts that exist in this environment. On the basis of this environmental analysis, a hierarch- ical model (the so-called abstraction hierarchy) is created, which, starting from the user’s highest goal, views the system in different degrees of abstra- ction. In this way, a display and operating concept can be derived that allows a systematic zooming into more detailed information of the system and thus optimally supports the problem-solving and decision-making process with reduced workload (Vincente & Rasmussen 1992) (Harre 2018).
With both methods, it must be considered that although they offer indi- cations of the information to be displayed, its structure on the display and operating concept, they do not yet allow systematic derivation of
KONECT: Implementation and Extension of a Method 3
efficient visualizations. Therefore, Harre developed in her doctoral thesis the KONECT method (Harre 2018).
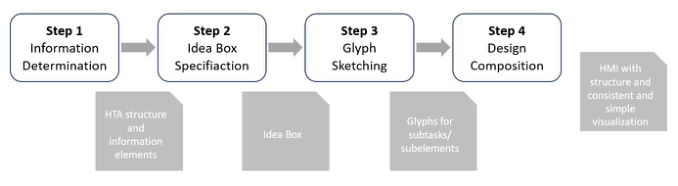
KONECT METHOD The KONECT method extends the HTA and EID analyses and combines them with the state of the art on perception research. It defines the most efficient type of visualization (e.g. color, shape, length) on the basis of a clas- sification of the information to be presented. Efficient in this context means that the information is displayed such that the user can perceive the infor- mation quickly and correctly. By using the KONECT method, a systematic derivation of a display and operating concept for e.g. control rooms can be made, which includes optimal support for the quick recognition and cor- rect detection of events. Lastly Harre invented the KONECT value K. With this numeric value the interface can be measured. The application of the KONECT method is organized in four steps, whereby step 2 is divided again. These steps can be derived from Figure 1 and are explained below.
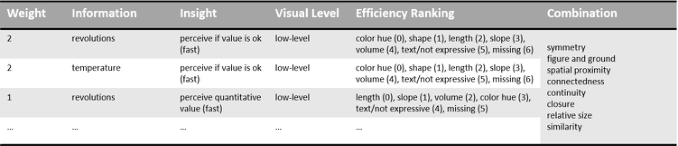
In Step 1 (Information derivation), all important information is derived from a target system. This can be done through research, interviews or other methodological procedures, like HTA or EID). Through the visual structure of the HTA, the necessary information to solve individual tasks in the overall system can be derived. This information is the basis for Step 2, the specifica- tion of the idea box, which is the core of the KONECT method. As shown in Figure 2, the information is entered into the idea box in descending order of importance. Next, the insights for the information are determined. This determines why the user of the system needs this information. For example, he wants to see whether a temperature value is still in the range or not. For this purpose, there is a predefined list of insights that has been compiled from findings in the psychology of perception. Each insight is assigned to a visual efficiency ranking that contains visual attributes (color, shape, length, etc.). In addition, all insights have a time factor that determines whether the informa- tion should be recognized pre-attentively or not. The visual level describes how the insights should be recognized. Low-level means that an attribute such as length or color is sufficient to detect the information. High-Level would be a comparison or an interpretation of several attributes to capture the information. Efficiency ranking is based on findings from human perce- ption. (Harre 2018) (Kosslyn et al., 1990), (Rensink, 2000), (Rensink, 2002) It is designed to give the user of the KONECT method a suggestion of how the information can be presented. Examples of this can be seen in Figure 2.
In Step 3, Glyph Sketching, the user of the KONECT method should com- bine the individual pieces of information with their proposed insights and combinations. For example, the rotation should be represented by a length element. In addition, a critical area should be highlighted in color. So, it would be possible to take a bar that changes in length as a length element and a color change of the bar as an indicator for reaching critical values. After this, all glyphs are combined together. These combinations follow established design laws, such as symmetry or elements that should be close together (Ware, 2004) (Harre 2018). Step 4 design composition, is the design adjustment
Figure 1: Steps of the KONECT method (Harre 2018).Figure 2: Idea box - Example extract for engine monitoring (modified from: Harre 2018).
step, in which the design will be proved against composing guidelines. This is done to prevent any interference between the glyphs used. Harre identified three rules that have an impact on perceptual performance and accuracy.
1. Consistency: The user of the tool should use similar visual representati- ons for the same important information elements. 2. Simplicity in shapes: the forms should be as simple as possible. They should not be complex or randomly appear anywhere on the GUI. 3. Simplicity in colors: Colors should be reduced to transmit only relevant information.
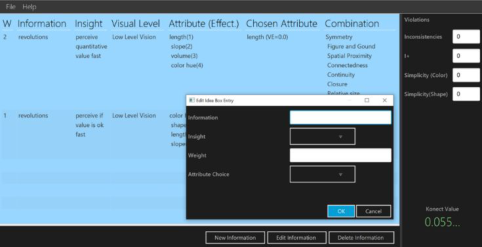
The KONECT method offers a quantitative method to estimate the rela- tive perceptual accuracy and reaction time – the KONECT value K. Based on the selected Attribute for each information element and the amount of dif- ferent violations to the design guidelines specified for synthesizing the HMI (inconsistencies, additional information, simplicity in color, and simplicity in shapes) the KONECT value K is calculated. The KONECT value K can lie between 0 and 1. It reveals shortcomings of a design solution and could be used to compare HMI design alternatives in early design phases. (Harre & Feuerstack, 2018), (Harre, 2019) To support the use of the KONECT method, a basic tool has been developed, which supports the completion of the idea box and the calculation of the KONECT value K. A screenshot of the current tool can be found in Figure 3. The tool has been implemented in Java FX.
ENHANCEMENT OF THE KONECT METHOD In this section we will discuss shortcomings in the KONECT method. First, we will outline some possible extensions of the method. After that, we will
KONECT: Implementation and Extension of a Method 5
Figure 3: KONECT basic tool (Harre 2018).
propose improvements for each step of the method as well as implementa- tion of a new web-based tool, which implements the KONECT method. In general, we want to follow the reimplemented KONECT tool very closely to the 4 steps we have described and develop it in such a way that the user is guided through this application.
General Extensions: The KONECT method is optimized for creating visual components based on focal vision for fast and correct detection of critical system states to increase safety in monitoring tasks. To create a more holistic HMI, the method can be extended in several ways. There are other optimiza- tion aspects that might be interesting to achieve a better user experience (e.g. usability, intuitive understanding, learnability or graphical appeal). More- over, the method is extensible to integrate other human senses to create a multimodal interface. Thus, other media like sound and haptic could be included in the overall design to support better multi-tasking or to reduce the amount of visual information. In addition to detecting critical system states, it is important to respond fast and correctly. Therefore, it is neces- sary to include knowledge about interaction. (Harre, 2019) In order to ensure an appropriate cognitive workload of the user, it should further be investigated whether different user states (e.g. under- or overload) have an impact on the representation of critical system states and how this can be considered in the KONECT method (e.g. development of adaptive and/or multimodal HMIs).
Step 1 (Information Determination) What is the Problem? In this step all information that should be displayed to the user is collected by HTA and/or EID. In the current version of KONECT, this is a manual process without any tool-support. Any task analysis performed in another tool has to be manually entered into the system. Furthermore, since KONECTs only input is the information element itself, the association with the corresponding tasks are not available in the tool.
What is Planned? Step 1 is to be extended on the software side in such a way that the HTA can be performed directly in the new software. As a first step we plan loading pre-created HTAs into the application. The HTA loaded in this way is made available directly as a pre-filled idea box, so that the user can theoretically work on the idea box in Step 2 without further adaptation. Furthermore, the idea box is then to allow creation and editing of HTA directly in the tool. To extend the KONECT method with multimodal perception and interaction elements, it is necessary to analyze the interaction with the system, the user and the environment. Therefore, we want to extend the information determi- nation by suitable methods to further optimize the developed systems with the KONECT method.
What are the Benefits? With this extension, the user would have two solutions at once. Firstly, the creation of the HTA would be embedded in the software for the KONECT method. Secondly, the user would not have to laboriously enter information from the HTA into the idea box, since this would happen automatically. The task model can then also be used in the following stages to better guide the user in e.g. the grouping of the elements, as well as for allowing consiste- ncy checks. The further analysis can help to better understand the user and the environment in which the system is used and thus create a customized holistic HMI.
Step 2 (Idea Box) What is the Problem? At present, there is not enough help in selecting insights. Also, the insights are only used for perception and do not include any processing of information or interactions. Furthermore, there is no support for sorting the elements, i.e. how they are weighted or what order they have.
What is Planned? The method will be extended with multimodal perception (haptic, audio), as well as with interaction elements to support basic GUI elements. Follow- ing the approach of (Harre, 2019), these elements will be based on existing knowledge found in scientific literature. For the weighting and sorting of the individual interface elements, a function is to be developed which allows the user to switch between two views. The first view is the familiar idea box, which is structured like a table. The second view is a card-based view in which each interface element represents a card. These cards can be sorted by dragging and dropping them. In addition, stacks can be created to prepare the interface elements for step 3 by presorting them for glyph sketching.
What are the Benefits? With these enhancements, the user has more freedom to develop the human- machine interfaces. The overload of information that a table usually contains
KONECT: Implementation and Extension of a Method 7
is avoided by the possibility of a card-based view. In addition, the deve- lopment process of the glyphs is supported and simplified by the map view.
Step 3 (Glyph Sketching) and Step 4 (Design Composition) What is the Problem? In the existing KONECT application there is no possibility to create the gly- phs with the tool. The user has to create the glyphs manually after completing the idea box. Furthermore, there is no support to develop an HMI (design composition in step 4) with the created glyphs. It is not clear which inter- face elements should belong together and how they are then combined into a glyph. This is the basis for the combination and the design composition.
What is Planned? For Step 3 and 4, there should be tool support in the form of an editor. The glyphs for Step 3 should be sketched in this editor. The editor should also address the design composition in step 4. The task model should serve as the basis for grouping the elements, as well as for automatic checks of the design.
What are the Benefits? The user could continue to work with the described editors within the method, so there would be no tool break. The previous implementation ended with the idea box from Step 2, except the calculation of the KONECT value K. By taking up the task model, the user would also be able to see why the HMI is ultimately designed as it is. This is not only providing documenta- tion, but also the necessary traceability of requirements and design decisions according to the current knowledge about KONECT.
CONCLUSION
In this paper we have described how we want to systematically extend and implement the KONECT method to make it easier to use. To do this, we have described the KONECT method and its scientific basis in detail. Furthermore, the 4 steps of the KONECT method were discussed. We described for every step where we see problems in the usage of the tool, which extensions are therefore planned and which benefits the extension would have for the user. Also, we described some general enhancements to create a more holistic HMI with the method.
We begin to implement a new web-based tool. A connection to a task editor has already been made. On the basis of this paper, there are therefore three major follow-ups that need to be investigated.
1. The exploration of interaction elements and the associated connection with the information elements to the interface elements. 2. The further software implementation, including the exploration of the user journey through the application. 3. Development of an editor for glyph sketching and design composition.
REFERENCES
Diaper, D. & Stanton, N. (2003). The Handbook of Task Analysis for Human- Computer Interaction. CRC Press. Harre, M. C. (2019). Supporting supervisory control of safety-critical systems with
rationally justified information visualizations (Doctoral dissertation, Universität Oldenburg). Harre, M.-C., Feuerstack, S. (2018). The Konect Value – A Quantitative Method for Estimating Perception Time and Accuracy for HMI Designs. Behaviour & Information Technology. Harre, M.-C., Feuerstack, S., Wortelen, B. (2018). A Method for Optimizing Com-
plex Graphical Interfaces for Fast and Correct Perception of System States. In Proceedings of the 7th International Working Conference on Human-Centered Software Engineering. Kosslyn, S. M., Flynn, R. A., Amsterdam, J. B., & Wang, G. (1990). Components of high-level vision: A cognitive neuroscience analysis and accounts of neurological syndromes. Cognition, 34, 203–277. Rensink, R. A. (2000). The dynamic representation of scenes. Visual cognition, 7,
17–42. Rensink, R. A. (2002). Change detection. Annual review of psychology, 53, 245–277. Vicente, K. & Rasmussen, J. (1992). Ecological interface design: theoretical foundations. IEEE Transactions on Systems, Man and Cybernetics, 22, 589–606. Ware, C. (2004). Information Visualization: Perception for Design. Interactive
Technologies. Elsevier Science.
LISTED IN THE AHFE DIGITAL BOOKSTORE CATALOGUE
Explore the complete digital volume
Human Factors in Software and Systems Engineering
Read this individual research paper free through the original publisher, or explore the full digital proceedings book.
ISBN 978-1-958651-37-7
Explore this ISBN in the AHFE Bookstore ↗Listed in the July 2026 bookstore catalogue; search by ISBN to confirm current availability · Digital book purchase optional