Omar Paul Páez Almeida, Ana Alvarez Sanchez, Alexis Suarez Del Villar Labastida (2022). Projection of the Future of the Green Savings Account Product in a Financial Institution. In: Human Interaction & Emerging Technologies (IHIET 2022): Artificial Intelligence & Future Applications. AHFE Open Access, vol. 68, pp. 730–736. https://doi.org/10.54941/ahfe1002799
The new financial product that enters the Ecuadorian market, this product is called Green Savings Account belonging to a bank. Due to the fact that at present there is no history of projections for the following years due to the short life of this product, it is essential to know what its behavior will be in the future using scientific and statistical methods, which is why the forecast of the green account until 2024 will help in the annual planning of the financial institution, by providing relevant information that allows improving the profitability of the company, not only in the short term but also in the long term. The proposal began with an analysis of short-term forecasts using time series models, and it was found that the method of weighted moving averages using the Microsoft Excel SOLVER tool is ideal for this work, with a mean absolute deviation of 173 counts. . This previous study allowed the real demand data to be statistically modeled and easy to handle to determine long-term projections, this will be done using the Minitab and SPSS software, simulating here different linear and non-linear regression models. Finally, it was found that the exponential regression model is the ideal one to carry out the forecast of the product, since it has the highest level of confidence of all the analyzed models of 73.8%, thus projecting a growth of 470.79% for the month of January of year 2024 comparing with the real demand of the month of January of the year 2021.
It is essential to have prediction models (Pérez-Fargallo, 2022) (Ahmed, 2022), based on intelligent data analysis, with the identification of models, methods for future prediction are developed (Bakhtadze, 2019) (Sinhababu, 2022), comparison with other models and optimization algorithms show that some have better prediction accuracy, stability and robustness. (Duan, 2019) (Verma, 2022). Machine learning methods are compared on three aspects: highest single prediction accuracy, average prediction accuracy, and prediction stability (Wang, 2022). The models used are a combination of statistical methods, namely weighted mobile average, smoothed exponential
Projection of the Future of the Green Digital Savings Account Product 731
Table 1. Compilation of the four-time series methods results analyzed with their respective forecast error actions.
Table available in the original PDF paper.
Method MAD MSE MAPE (%)
185 67525.86 18.24
Simple moving average 200 81963.79 19.45 Weighted moving average with arbitrary weights
179 62665.79 17.93
Weighted moving average with weights obtained from SOLVER Exponential smoothing 181 59242.07 18.97
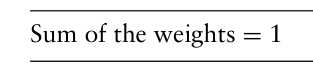
Table 2. Weights obtained from the solver tool for the fourmonth weighted moving average method.
Table available in the original PDF paper.
Weighting proposed by solver Period 0.544 Last month 0.1804 Two months ago 0.2256 Three months ago 0.05 Four months ago
Equation reproduced from the original PDF.
(ETS), trend and seasonal components (BATS) (Said, 2022), numerical resea- rch evaluates the effects of autocorrelation of demand and the variability of the delivery time in the accuracy of each strategy and the conditions in which one outperforms the others (Pimentel KBA, 2022) (Babai, 2022).
APPLICATION RESULTS OF THE TIME SERIES PROJECTION METHODS Four time series models used in Statistics were applied to study short-term forecasts as detailed in (Masini, 2017). It began with moving averages for projections and, in addition, the three most popular measures of forecast errors were analyzed in each of the methods that were developed, obtai- ning the results shown in Table 1, with the average method. simple mobile, a mean absolute deviation of 200 counts is obtained; 4 periods of time series were considered, that is, 4 reference months (December 2018, January 2019, February 2019 and March 2019) for the weighted moving average method, the arbitrary weights obtained from the SOLVER tool shown in Table 2.
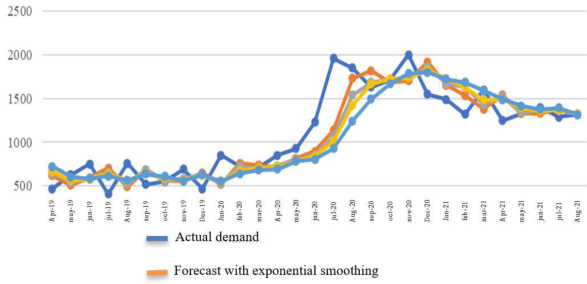
The weighted moving average method with weights obtained from SOLVER is the one that gives us the greatest precision in its results, obtai- ning a lower bias value in its derivations of the mean absolute deviation (MAD) with 179 counts, of the mean square error (MSE) with 62,665.79 accounts and the percentage of error of the absolute average (MAPE) 17.93 percent, making the comparisons of the values that can be seen in Table 1 and Figure 1.
The Green Digital Savings Account is a product that is worth betting on in the future, because in addition to entering the market with very good acce- ptance, the real demand data that can be seen increasing in Figure 1 reaffirm
Figure 1: Real demand against arbitrary weighted moving average, obtained from solver for four months and exponential smoothing.
that digital media and conservation of the environment are two key aspects in which people want to invest and contribute.
ANALYSIS OF THE ASSOCIATIVE LINEAR REGRESSION MODEL The first thing that was done was to transform the months of study into a quantitative variable that will have the role of time as the independent variable, while the number of green savings accounts predicted with the SOLVER weighted moving average method will represent the dependent variable, observe in Table 3.
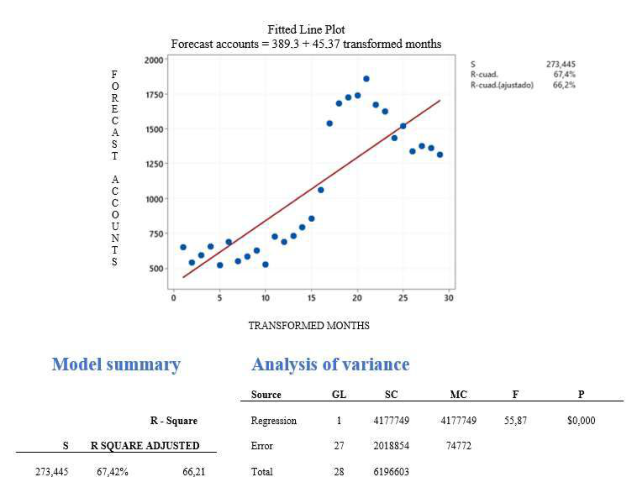
In the linear regression analysis using the statistical packages Minitab and IBM SPSS Statistics, with the first, these were the results that are shown in Figure 2.
This statistical package generated a fitted line graph to obtain a linear equation that describes the problem with a coefficient of determination of 67.42%% and a complete ANOVA analysis. According to (Levin, 2018) when a statistical study is carried out and the level of significance p is less than 0.05, the results obtained are significant. As shown in Figure 2, the p-value is 0.000, which shows that the linear regression analysis generated by Minitab is statistically significant, however, this program offers us other regression models that could better interpret the results. study data, these models are: linear, quadratic, composite, growth, logarithmic, cubic, S-curve, exponential, inverse, power and logistic (IBM, 2021).
Table 4 shows a comparison of the actual data of Green Digital Savings Accounts opened during the year 2020-2021 and those projected for 2024, calculating the respective monthly growth within this period, considering the most recent data the study has projected a growth average within three years of this type of savings accounts of 618.01%. Therefore, it is recommended that the financial entity continue investing in the maintenance and impro- vement of this product, since with a confidence percentage of 73.8%, an exponential growth has been estimated that will bring great benefits to the company, both economic and institutional.
Projection of the Future of the Green Digital Savings Account Product 733
The results of all the models with their respective coefficients of determi- nation, standard error of the estimate and the significance of the regression so that it is easier to make a decision, they are observed in Table 5.
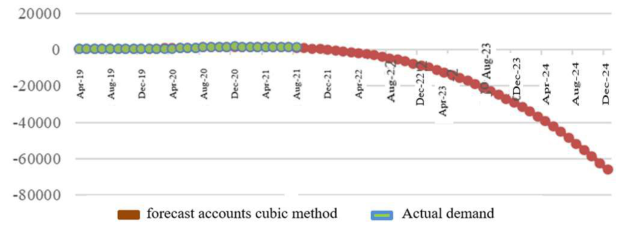
We can see in Table 5 that, compared to the linear model, the models with the highest coefficient of determination are the quadratic, cubic, compound, growth, exponential and logistic methods. Of these, it is observed that the cubic model is the one with the highest value of R squared and the one that in theory best interprets the problem of the project, however, despite having zero significance, this model has a high standard error of estimation, that is, it does not adequately interpret the analyzed data. This can be evidenced in Figure 3, where it is observed that as of December 2021, negative values of savings accounts begin to be generated, which increase on a large scale as time progresses.
Figure 2: Results obtained from the linear regression analysis with Minitab.Table 4. Calculation of growth by months of the number of green savings accounts opened in the period of 3 years.
Table available in the original PDF paper.
Actual demand Forecast accounts Increase Months 2020 2021 2024 (%)
January - 1490 7015 470,79 February - 1320 7345 556,45 March - 1600 7691 480,69 Abril - 1250 8053 644,26 May - 1330 8433 634,02 June - 1400 8830 630,69 July - 1290 9246 716,71 August - 1320 9681 733,41 September 1630 - 10137 621,90 October 1710 - 10614 620,72 November 2000 - 11114 555,71 December 1550 - 11638 750,82 Anual average 618,01
CONCLUSION
The financial entity in its catalog of accounts has different types suitable for each client’s need: Mini Account, Ideal Account, Savings Account, Current Account and Green Digital Savings Account. The latter, being an original innovation, has had a positive impact on both the company and its customers, motivating them to use digital means to carry out their banking operations
Projection of the Future of the Green Digital Savings Account Product 735
Table 5. Comparison of measures between all the regression models analyzed.
Figure 3: Graph of the cubic regression model elaborated with data obtained from SPSS.
and, at the same time, contribute to the conservation of the environment. For this reason, it is important to know what its behavior will be in the future, so that relevant strategic measures can be taken in order to improve demand and the bank’s institutional image.
In the development of the investigation, the methods of simple moving average (MAD = 200), weighted moving average with arbitrary weigh- tings (MAD = 185), weighted moving average with weights obtained from the SOLVER tool (MAD = 179) and exponential smoothing were applied. (MAD = 181). So, the weighted moving average model with SOLVER weights was selected as the most suitable for short-term forecasting, since comparing the forecast error measures, this model is the one that best fits the behavior of the historical data of the real demand for green savings accounts, with a mean absolute deviation of 179 accounts nationwide.
Through the application of the associative model, making a study of the behavior of green savings accounts opened over time and comparing the results of the Minitab and SPSS software, it was possible to show that in the month of January 2021 there were 1490 accounts, and using the exponential regression model, 7015 open accounts are forecast for the month of January 2024 for a growth in this period of 470.79% with a confidence percentage of 73.8%.
ACKNOWLEDGEMENT
To the authorities of the Indoamerica Technological University who open spa- ces for joint work between students and teachers so that teaching can move from a passive presentation of knowledge to research with transcendence in time, with the aim of developing the generic capacities of students, with a social benefit and the scientific community.
REFERENCES
Ahmed, N., (2022). Gráficas de control para monitorear la media de distribución exponencial generalizada con censura tipo I. Ingeniería de Calidad y Confiabilidad Internacional, 592–614. Babai, M., (2022). Pronóstico de la variación de la demanda en el tiempo de entrega:
implicaciones para los cálculos de existencias de seguridad. Revista europea de investigación operativa, 846–861. Bakhtadze, N. M. (2019). Innovación y gestión del conocimiento en agricultura de precisión. Conferencia Internacional IADIS Sistemas de Información, 12, 265–270. Duan, R. P. (2019). Investigación sobre la predicción del flujo de pasajeros de las
estaciones de tren basada en el modelo SARIMA. Matemáticas. Practica Saber, 9, 1–10. IBM. (2021). Modelos del procedimiento Estimación curvilínea. Obtenido de https://www.ibm.com/docs/es/spss-statistics/28.0.0?topic=SSLVMB_28.0.0/ statistics_mainhelp_ddita/spss/base/curve_estimation_models.html Levin, R. R. (2018). Estadística para administración y economía. México: Pearson
Educación. Masini, J. V. (2017). Compendio de Modelos Cuantitativos de Pronósticos: El primer paso en las decisiones tácticas, es predecir la demanda. Ciudad de México: AVG. Pérez-Fargallo, A., -H.-E.-R. (2022). Modelos de predicción de consumo de agua
caliente sanitaria adecuados para viviendas en la zona centro-sur de Chile. Revista de Ingeniería de la Construcción. Pimentel KBA, O. R. (2022). Predicción de la incidencia de leishmaniasisPredicción de la incidencia de leishmaniasisPredicción de la incidencia de leishmanvisceral utilizando el modelo de Promedio Móvil Integrado Autorregresivo Estacional (SARIMA) en el estado de Maranhão, Brasil. Revista Brasileña de Biología. Said, W. (2022). Modelo de predicción por conjuntos basado en la frecuencia para
la predicción de series temporales. Matemática Computacional y Aplicada. Sinhababu, A., (2022). Un método de campo de fase preciso basado en una cuadrícula fija para la solidificación dendrítica en geometrías complejas. Ciencia Computacional de Materiales. Verma, S., (2022). Un modelo de pronóstico inteligente para la predicción de enfer-
medades mediante el enfoque de ensamblaje de pilas. Informática, Materiales y Continua, 6041–6055. Wang, Y., (2022). Un estudio comparativo de diferentes métodos de aprendizaje automático para la predicción del desplazamiento de deslizamientos de embalses. Ingeniería Geológica.
Read this individual research paper free through the original publisher, or explore the full digital proceedings book.
ISBN 978-1-958651-44-5
Explore this ISBN in the AHFE Bookstore ↗Listed in the July 2026 bookstore catalogue; search by ISBN to confirm current availability · Digital book purchase optional