Şeniz Harputlu Aksu, Erman Çakıt, Metin Dağdeviren (2023). Investigating the relationship between EEG features and N-back task difficulty levels with NASA-TLX scores among undergraduate students. In: Intelligent Human Systems Integration (IHSI 2023): Integrating People and Intelligent Systems. AHFE Open Access, vol. 69, pp. 115–123. https://doi.org/10.54941/ahfe1002828
For safe and efficient human-machine interactions, the amount of mental resources required by the task should not exceed available capacity of the person. Therefore, determination of mental workload has critical importance in the fields of human factors and ergonomics. Because of its temporal dependability, EEG data has become widely used in assessing and measuring mental workload in recent years. Accordingly, motivation of the study was to examine the role of brain-related data in discriminating mental workload levels. The current paper presented a statistically analysis of whether pre-determined task difficulty levels led to the intended mental workload manipulation. It was aimed to investigate the relationship between EEG features, task difficulty levels, subjective self-assessment (NASA-TLX) scores and performance measures (accuracy rate and latency). N-back tasks have been commonly used in the literature. In this study, n-back memory tests were performed at four different difficulty levels. As the number of n increases, so does the difficulty of the task. Tests were conducted on 25 (13 male, 12 female) healthy undergraduate students. The statistical analysis was performed for two sets of data. The first dataset, which included 300 session-based samples, was conducted in order to examine the possible relationship between task difficulty levels, performance criteria, and subjective assessments of mental workload. The second dataset, on the other hand, was analyzed on the basis of stimulus and consisted of seventy EEG features (5 frequency band power for 14 channels) corresponding to recording samples. The categorical variable reflecting the difficulty level of n-back memory was selected as dependent variable. It was demonstrated how the band power varies in various regions of the brain depending on the degree of task difficulty. Significant differences between the genders were noted in terms of all variables considered. As the task difficulty level increased, both the workload perceived by the participants (rho > 0.7, p < 0.01) and the latency in response time (rho > 0.6, p < 0.01) significantly increased. Otherwise, the correct answer rate decreased as the task became more difficult (rho > 0.6, p < 0.01). The number of hits (correct answers by detecting the match) was found to be more correlated with the task difficulty level compared to number of correct rejects (correct answers by detecting the non-match). The workload and its sub-dimensions perceived by the participants and performance variables are also related to each other. In tests with longer response times, participants reported that they felt more workload (rho > 0.6, p < 0.01). Conversely, the number of correct answers decreased (rho > 0.6, p < 0.01). It was also found that there was a significant difference between all difficulty levels compared in pairs, in terms of almost all variables (p < 0.001). There was no significant difference between men and women in terms of performance measures. However, men were found to report higher NASA-TLX scores than women, especially on difficult tasks. As a result, significant relationships between data obtained through different methods encourage the use of these methods together for reliable analysis in future studies.
For safe and efficient human-machine interactions, the amount of mental resources required by the task should not exceed available capacity of the person. Therefore, determination of mental workload has critical importance in the fields of human factors and ergonomics. On the other hand, measu- ring mental workload directly and easily is a rather complex problem due to its multidimensional nature. There are various techniques used to mea- sure mental workload in the literature. These techniques can be divided into objective or subjective and experimental or analytical (Rusnock et al. 2015). Objective-experimental measures are primary/secondary performance mea- sures and physiological methods. Scales such as NASA-TLX (Hart, 1988) are shown as examples of subjective-experimental tools. Objective-analytical tools are mathematical models, while subjective-analytical tools are expert opinions.
Within the scope of this study, it was aimed to analyse the sensitivity of both objective experimental and subjective experimental measures to task difficulty. NASA-TLX was selected to evaluate mental workload subjectively because of its reliability and ease for implementation. Since its reliability has been proven, in many studies NASA-TLX was used especially in combination with physiological methods in order to show the validity and preferability of a newly proposed method (Jo et al. 2012; Heine et al. 2017; Orlandi, 2018). Among the objective techniques, performance-based techniques (accuracy rate and latency) and EEG were used. EEG, which is one of the neurophy- siological methods, has an excellent temporal resolution, and EEG indices are highly sensitive to human brain activity fluctuations (Ismail, 2020). In addition to its temporal dependability, EEG data is used by many researchers because it can be measured anywhere with a portable device. One of the most popular types of features extracted from EEG signals is power spe- ctrum. In particular, alpha and theta activity has been verified to be effective in discriminating mental workload levels and the frontal and parietal regions of the brain have been found to be sensitive to mental workload (Zammouri et al. 2018; Guan et al. 2022). Choi et al. (2018) developed a measurement method called EEG-based workload index (EWI) and obtained a high corre- lation by comparing with NASA-TLX. As the EWI increases, the workload increases, and as EWI decreases, workload decreases (EWI = (Relative Beta Power + Relative Gamma Power) / (Relative Theta Power + Relative Alpha Power)). In a study, it was observed that the theta power in frontal brain area increases while the alpha power in the parietal and occipital sites decre- ases under high mental workload condition (Holm et al. 2009). It was also reported that the task difficulty level was positively related to the frontal theta/parietal alpha ratio. Similarly, increase in theta power spectral density localized in frontal areas for higher activity was observed in another study. With increasing mental workload, a decrease in alpha activity in the occipi- tal regions and an increase in beta activity in the frontal regions were also observed (Lim et al. 2018). Some results showed that with the increment of task load, power of frontal theta and theta/alpha ratio in parietal regions increased significantly first and decreased slightly then, while the power of central-parietal alpha decreased significantly first and increased slightly then (Guan et al. 2021). Prefrontal and frontal theta, prefrontal beta-high, occi- pital, parietal and temporal gamma and occipital alpha activities were also found to be the most effective parameters to classify mental workload level (Harputlu Aksu and Çakıt, 2022). There are also studies showing that cen- tral, parietal and occipital beta power is associated with changes in mental workload (Yin and Zhang, 2017; Plechawska-Wojcik et al. 2019). Moreo- ver, power of the high-frequency beta and gamma waves in posterior cortex increases in response to changing task performance (Chuang et al. 2012).
One of the main motivations of this study was to statistically demonstrate for further studies whether the predetermined task difficulty levels lead to expected mental workload manipulation. Another motivation of the study was to examine the role of brain-related data in discriminating mental wor- kload levels. For this purpose, this study focuses on what kind of power changes occur in which parts of the brain in which frequency ranges based
Investigating the Relationship Between EEG Features 117
on the change in task difficulty levels. The results are intended to be compa- red with those previously achieved in the literature, and it is hoped that the important findings of this study will shed light on future studies.
ANALYSIS OF MENTAL WORKLOAD
Methodology
The study was approved by the Research Ethics Committee of Gazi Uni- versity, and all participants signed an informed consent in accordance with human research ethics guidelines. Tests were conducted on 25 (13 males, 12 females) healthy undergraduate students. The mean age of the people exa- mined was 21.7. EEG data were recorded with EMOTIV EPOC X device. The resolution of the device is 14 bits and the sampling rate is 128 Hz. The EPOC X device has 14 channels, and the sensor placements according to the international 10–20 system (Homan et al. 1987). During the experiment, the participants were instructed not to talk unnecessarily and not to move his head as much as possible. First, the connection quality and then the EEG qua- lity were checked, and the experiment was not started before the connection quality was 100%.
N-back memory tests were performed using Inquisit Lab 6 (trial version) at 4 different difficulty levels. As the number of “n” increases, the difficulty of the task increases. Each letter was displayed for a duration of 500 millise- conds (ms) and the total time until the next letter is displayed was 2500 ms. Participants were asked to press keypad button “M” with their right index finger in response to a “match stimulus” and press keypad button “L” with their right middle finger in response to a “non-match stimulus” as fast as possible. Letter “M” was the match in the 0-back condition. In the 1-back condition, the participant was instructed to press “M” if the letter on the screen is the same as the previous one, otherwise to press “L”. In the 2-back condition, a letter was the match if it was shown two screens back. In the 3-back condition, a letter was the match if it was shown three screens back. A total of 15 letters are displayed in the 0-back task, 16 letters in the 1-back task, 17 letters in the 2-back task, and 18 letters in the 3-back task. The expe- cted number of answers for each difficulty level is 15. A total of 20 different consonants, including English letters such as X and W, were used in the tests. The match/mismatch ratio was set to 1:2. So, five of the letters were targets.
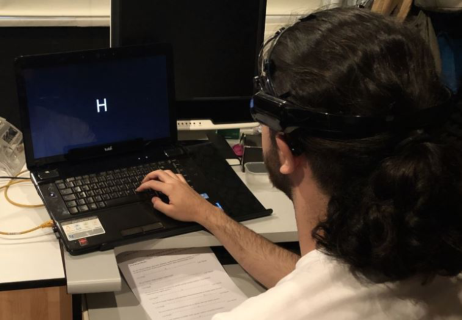
Each session included 12 n-back blocks, 3 from each condition. Each block was applied in random order in terms of difficulty level. After each block, participants were asked to subjectively evaluate the mental workload, using the NASA-TLX scale. In addition, the participants were asked to prioritize the 6 sub-dimensions of NASA-TLX through the pairwise comparison tables given to them. Weighted total NASA-TLX scores were obtained by using the weights obtained as a result of 15 pairwise comparisons. The recording time with one participant was approximately 20 minutes. A photograph taken during the implementation of the experiment is given in Figure 1.
In this work, performance data of the participants was obtained through the Inquisit Lab 6 software. The band powers of 4–8 Hz (theta), 8–12 Hz (alpha), 12–16 Hz (low beta (betaL)), 16–25 Hz (high beta (betaH)) and
Figure 1: A shot taken from the experiment.
25–45 Hz (gamma) bandwidths for each EEG channel were extracted by using EMOTIV Pro software. The raw EEG signals were also pre-processed to clean noise from data by using the EEGLAB toolbox (Delorme and Makeig, 2004). In the pre-processing step EEGLAB’s STUDY functionality was used to explore the EEG mechanisms across subjects for the different task conditions.
The band-pass was filtered from 1 to 50 Hz using a finite impulse response (FIR) filter. Line noise of 50/60 Hz was removed by using the CleanLine plugin. Independent Component Analysis (ICA) was implemented as ano- ther step of noise removal. Attributes of the components were observed by the ICLabel function, and components that were estimated to be ocu- lar, muscular, or some other source with more than 90% probability were discarded.
Results
The statistical analysis was performed using SPSS 21.0 software for two sets of data. The first dataset, which included 300 session-based samples, was conducted in order to examine the possible relationship between task difficulty levels, performance criteria, and subjective assessments of mental workload. The second dataset, on the other hand, was analysed on the basis of stimulus and consisted of 84 EEG features (5 frequency band power and theta/alpha ratios for 14 channels) corresponding to recording samples. Due to the quality of the EEG recording only 15 participants (8 males, 7 females) were selected for further analysis on the second data set to obtain more relia- ble results. Therefore the second dataset consists of 2700 samples (15 subjects x 12 sessions x 15 stimuli).
The analysis of correlation was implemented to examine the relationship between the task difficulty, NASA-TLX scores and performance measures. The results indicate that different complexity levels of n-back task have a significant effect on both participants’ performance and perceived workload by them (see Table 1). A significant positive correlation with a coeffici- ent of 0.759 was found between the task difficulty level and the weighted
Investigating the Relationship Between EEG Features 119
Table 1. Correlation values for NASA-TLX and performance features with difficulty level.
Table available in the original PDF paper.
Features Spearman Correlation Coefficient (p < 0.01)
0.759
Weighted Total NASA-TLX Score
−0.440
Mental Demand 0.788 Physical Demand 0.153 Temporal Demand 0.636 Own Performance 0.614 Effort 0.706 Frustration 0.408 Number of Hits −0.491 Number of Correct Rejects Mean Latency 0.636 Accuracy Rate −0.562
total NASA-TLX score at 99% confidence level. It was seen that the sub- dimensions most correlated with the “Weighted Total NASA-TLX Score” were “Effort”, “Mental Demand” and “Temporal Demand” and “Own Per- formance”, respectively (rho > 0.8, p < 0.01). It was also revealed that there was a significant relationship between task difficulty level and performance measures. Especially, the latency in response time increases dramatically as the task difficulty level increases. As expected, the rate of correct answers decreases as the task gets more difficult. The number of hits (correct answ- ers by detecting the match) was found to be more correlated with the task difficulty level compared to number of correct rejects (correct answers by detecting the non-match). This result shows that the harder the task, the har- der to detect especially the target. As another result of the correlation tests, the workload and its sub-dimensions are also related to performance varia- bles. As the weighted total NASA-TLX score increases, the accuracy in the tests decreases and the latency in response time increases. In tests with longer response times, participants reported that they felt more workload (rho > 0.6, p < 0.01). Conversely, the number of correct answers decreased (rho > 0.6, p < 0.01). It is notable that the scores given by the participants to the “Own Performance”, sub-dimension of NASA-TLX, are consistent with the actual performance results. It was also found that there was a significant difference between all difficulty levels compared in pairs, in terms of almost all variables (p < 0.001). There was no significant difference between men and women in terms of performance measures. However, men were found to report higher NASA-TLX scores than women, especially on difficult tasks.
Correlation tests also demonstrated that the EEG variables showing the highest correlation with the task difficulty level were theta power in the AF3, AF4, F7, F8 and FC5 regions. Only significant correlations with rho > 0.3 are included in this paper (see Table 2).
These results show that theta power in the prefrontal, frontal and central regions increases as the task difficulty increases. The correlation coefficients
Table 2. Correlation values for EEG features with task difficulty level.
Table available in the original PDF paper.
EEG Features Spearman Correlation Coefficient (p < 0.01)
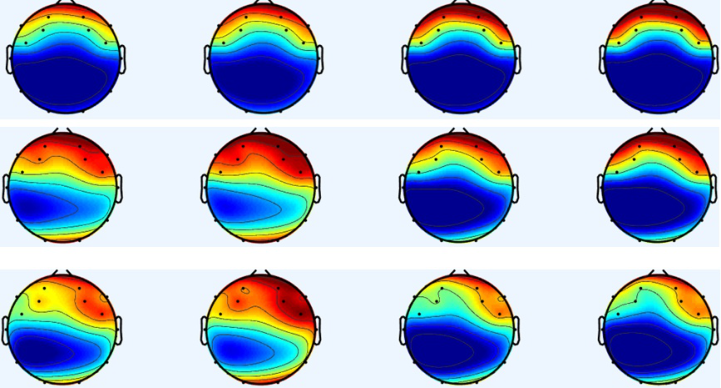
of the variables related to theta/alpha power ratios in the same brain regions were found to be slightly higher. Although the correlation coefficient was lower, it was revealed that the task difficulty level was negatively correlated with alpha power in O1, O2, T7 and P7 channels, positively correlated with alpha power in F7 and F8 channels. While the alpha power in the frontal regions increases, that in the temporal, parietal and occipital regions decrea- ses with increased task difficulty level. It was observed that low beta power decreased significantly in almost all brain regions as the task became more difficult. It was also determined that the EEG variables showing the highest correlation with the weighted NASA-TLX total score were the theta waves received from AF4 and F8 and theta/alpha ratios from AF3, AF4 and F8 (rho > 0.3, p < 0.01). In other words, as the perceived mental workload increases, prefrontal and frontal theta also increases. However, with increased percei- ved workload, low beta power in the prefrontal, frontal, parietal and occipital brain areas decreases (rho > 0.2, p < 0.01). With Kruskal Wallis test, it was investigated whether there was a significant difference between task difficulty levels in terms of EEG variables. For 49 EEG features, statistically significant difference was determined in at least one group distribution with the signifi- cance level of 1%. When the rank values of the variables were examined, it was noted that 34 of the 49 variables showed a smooth increase or decrease according to the task difficulty changes. In more challenging task conditions (2-back and 3-back), the theta power was higher in the prefrontal, frontal and central regions, the alpha power was lower in the temporal, parietal and occipital regions, and beta power in almost all brain regions was also lower. Scalp topographies showing the change of power in theta, alpha and low beta frequencies based on task difficulty levels are shown in the Figure 2.
Regions with high power are shown in red and regions with low power are shown in blue. The colour change from red to blue indicates a decrease in power. Four difficulty levels are given in order from left to right (0-back on the left, 3-back on the right). When the topography of theta frequency given at the top is examined, it can be seen that the prefrontal and frontal regions turn dark red towards difficult tasks. For the alpha frequency, areas
Investigating the Relationship Between EEG Features 121
Figure 2: Scalp topography for different frequency bands (from top to bottom respe- ctively for theta, alpha and low beta frequency bands).
that turn blue in topography towards difficult tasks indicate that the power in the alpha frequency especially in temporal, parietal and occipital areas decreases. In the bottom topography, which corresponds to the low beta fre- quency, as the task difficulty level increases lightening of the red colour and increase in the intensity of the blue colour across the map is remarkable. This change confirms that there is a decrease in beta power in EEG signals received from different parts of the brain as the task becomes more difficult. Since the results of the variation of high beta and gamma power according to the task difficulty were not significant, scalp topographies related to those frequency bands were not given.
CONCLUSION
The current paper presented a statistical analysis of whether pre-determined task difficulty levels led to the intended mental workload manipulation. The change in difficulty levels caused significant changes in both subjective and objective mental workload measures. As expected, both NASA-TLX and performance variables were found to be significantly correlated with task difficulty levels. As the task difficulty level increases, the perceived workload and latency in response time also increase. In addition to correlation analy- sis, variance analysis indicated that there was a significant difference between task difficulty levels in terms of all performance and NASA-TLX features and most of the EEG features. This study also confirms that EEG signals play an important role in analysis of mental workload. Especially alpha, theta and beta activities in the brain can be used as indicators for distinguishing mental workload levels.
The results of the study verify the rationality of the tasks and support the use of the pre-determined task difficulty levels as an output variable in the mental workload level classification model to be studied hereafter. Significant
relationships between data collected through different techniques encourage the use of these techniques together for reliable analysis in future studies.
ACKNOWLEDGMENT
This work was funded by Gazi University Scientific Research Projects Unit under Grant No. 6483. We thank to this institution and all volunteers who participated in this study.
REFERENCES
Choi, M. K., Lee, S. M., Ha, J. S., & Seong, P. H. (2018), “Development of an EEG-based workload measurement method in nuclear power plants”, Annals of Nuclear Energy, vol. 111, pp. 595–607. Chuang, S.W., Ko, L.W., Lin, Y.P., Huang, R.S., Jung, T.P., & Lin, C.T. (2012), “Co-
modulatory spectral changes in independent brain processes are correlated with task performance”, Neuroimage, vol. 62, no. 3, pp. 1469–77. Delorme, A., & Makeig, S. (2004), “EEGLAB: an open source toolbox for analysis of single-trial EEG dynamics including independent component analysis”, Journal of neuroscience methods, vol. 134, no. 1, pp. 9–21. Guan, K., Wang, S., Zhang, Z., Liu, T., & Niu, H. (2021), “Evaluation of Men-
tal Workload in Working Memory Tasks with Different Information Types Based on EEG”, 43rd Annual International Conference of the IEEE Engineering in Medicine & Biology Society (EMBC), pp. 5682–5685. Guan, K., Zhang, Z., Chai, X., Tian, Z., Liu, T., & Haijun, N. (2022), “EEG Based Dynamic Functional Connectivity Analysis in Mental Workload Tasks With Different Types of Information”, IEEE Transactions on Neural Systems and Rehabilitation Engineering. pp. 1–1, doi: 10.1109/TNSRE.2022.3156546. Harputlu Aksu, ¸S. & Çakıt, E. (2022), “Classifying mental workload using EEG data:
A machine learning approach”In: Hasan Ayaz (eds) Neuroergonomics and Cogni- tive Engineering. AHFE (2022) International Conference, AHFE Open Access, vol 42. AHFE International, USA. http://doi.org/10.54941/ahfe1001820. Hart, S. G., & Staveland, L. E. (1988), Development of NASA-TLX (Task Load Index): Results of Empirical and Theoretical Research. Retrieved from http:// wayback.archive-it.org/1792/20100206083836/http://ntrs.nasa.gov/archive/ nasa/casi.ntrs.nasa.gov/20000004342_1999205624.pdf, viewed 15 November 2022. Heine, T., Lenis, G., Reichensperger, P., Beran, T., Doessel, O., & Deml, B. (2017),
“Electrocardiographic features for the measurement of drivers’ mental workload”, Applied Ergonomics, vol. 61, pp. 31–43. Holm, A., Lukander, K., Korpela, J., Sallinen, M., & Müller, K.M.I. (2009), “Estimating brain load from the EEG”, The Scientific World Journal, vol. 9, pp. 639–651. Ismail, L., & Karwowski, W. (2020), “Applications of EEG indices for the quanti-
fication of human cognitive performance: A systematic review and bibliometric analysis”, PLoS One, vol. 15, no.12. Jo, S., Myung, R., & Yoon, D. (2012), “Quantitative prediction of mental workload with the ACT-R cognitive architecture”, International Journal of Industrial Ergonomics, vol. 42, no. 4, pp. 359–370. Lim, W. L., Sourina, O., & Wang, L. P. (2018), “STEW: Simultaneous Task EEG Wor-
kload Data Set,” IEEE Transactions on Neural Systems and Rehabilitation Engi- neering, vol. 26, no. 11, pp. 2106–2114, doi: 10.1109/TNSRE.2018.2872924.
Investigating the Relationship Between EEG Features 123
Orlandi, L., & Brooks, B. (2018), “Measuring mental workload and physiological reactions in marine pilots: Building bridges towards redlines of performance”, Applied Ergonomics, vol. 69, pp. 74–92. Plechawska-Wojcik, M., Tokovarov, M., Kaczorowska, M., & Zapała, D. (2019), “A
Three-Class Classification of Cognitive Workload Based on EEG Spectral Data”, Applied Sciences, vol. 9, doi: 5340. 10.3390/app9245340. Rusnock C., Borghetti B., & McQuaid I. (2015), “Objective-Analytical Measures of Workload – the Third Pillar of Workload Triangulation?” In: Sch- morrow D.D., Fidopiastis C.M. (eds) Foundations of Augmented Cognition. AC 2015. Lecture Notes in Computer Science, vol. 9183. Springer, Cham. https://doi.org/10.1007/978-3-319-20816-9_13 Yin, Z., & Zhang, J. (2017), “Cross-session classification of mental workload levels
using EEG and an adaptive deep learning model”, Biomedical Signal Processing and Control, vol. 33, pp. 30–47. Zammouri, A., Abdelaziz, A.M., & Mebrouk, Y. (2018), “Brain-computer interface for workload estimation: Assessment of mental efforts in learning processes”, Expert Systems with Applications, vol. 112.
LISTED IN THE AHFE DIGITAL BOOKSTORE CATALOGUE
Explore the complete digital volume
Intelligent Human Systems Integration (IHSI 2023): Integrating People and Intelligent Systems
Read this individual research paper free through the original publisher, or explore the full digital proceedings book.
ISBN 978-1-958651-45-2
Explore this ISBN in the AHFE Bookstore ↗Listed in the July 2026 bookstore catalogue; search by ISBN to confirm current availability · Digital book purchase optional