Işık Doğru, Erman Çakıt (2024). Prediction of Noise-Induced Hearing Loss in the Forest Sector Using Machine Learning Techniques. In: Physical Ergonomics and Human Factors. AHFE Open Access, vol. 147, pp. 12–20. https://doi.org/10.54941/ahfe1005172
In this study, the effects of gender, age, total working time (years), working time in the sector (years), working time in a noisy environment (months), smoking, having a noisy hobby and inadequate use of ear protection equipment on noise-induced hearing loss (NIHL) were evaluated in the forest sector. The study included 1477 workers, consisting of 1247 (84.4%) males and 230 (15.6%) females. The population was aged between 18 and 60. The initial phase of the study focused on comparing regression algorithms to determine if eight independent variables contribute to NIHL in workers. The multiple linear regression algorithm was deemed the most effective in this category, yielding an R2 value of 0.3079 when tested with a data size of 25%. The second phase of the study aimed to compare classification algorithms, exploring the degree of hearing loss, measured in dB, attributed to the same eight independent variables. The dependent variable for these algorithms was categorized as “NIHL present” or “NIHL absent”. The random forest algorithm emerged as the most effective classification method, yielding an accuracy of 75% when tested with a data size of 20%. The findings of this study can guide the implementation of engineering controls to reduce noise levels, administrative controls such as limiting exposure time, and the use of personal protective equipment like hearing protection devices.
Noise is defined as an unwanted sound that can have various negative effects on our physical and mental well-being. Excessive noise exposure can lead to hearing damage and can also cause stress, anxiety, and sleep disturbances. It is important to minimize exposure to excessive noise to protect our health. The sensitivity to noise and the level of hearing loss can vary from person to person, even when exposed to the same noise intensity and duration. Per- sonal characteristics such as age, genetics, overall health, and previous noise exposure can influence an individual’s susceptibility to noise-induced hear- ing loss. Noise-induced hearing loss (NIHL) is a type of hearing loss that is caused by exposure to loud sounds over an extended period of time. Many machines and tools used in the forest sector, which is one of the noisiest sec- tors, cause noise. Noise has a variety of mental and physical impacts that are related to health issues, such as hearing loss, sleeplessness, and psychological
Prediction of Noise-Induced Hearing Loss in the Forest Sector 13
degradation (Çakıt, 2019). NIHL cannot be attributed only to the noise level in the environment. Since noise is a subjective concept, not only the noise level of the environment but also personal characteristics affect the degree of hearing loss.
Machine learning (ML) has revolutionized the way we analyze data by enabling us to automatically uncover complex correlations, patterns, and insights that may not be readily apparent through manual analysis. This has made it possible to extract valuable information from large and diverse datasets, ultimately leading to more informed decision-making in various fields (McKearney and MacKinnon, 2019). ML has indeed shown promise in the field of Audiology. By leveraging sophisticated algorithms, ML can effec- tively model and analyze the nonlinear relationships between various risk factors and patients’ hearing thresholds. This enables audiology professionals to make more accurate predictions and informed decisions when assess- ing and managing patients’ hearing health (Chang et al., 2019). Abdollahi et al. (2018) built eight ML models to predict sensorineural hearing loss (SNHL) after chemoradiotherapy, five of which had over 70% accuracy and precision. Other studies found similarly high accuracy with ML mod- els predicting sudden sensorineural hearing loss (SSNHL) and hearing loss induced by ototoxicity. Different studies using various ML algorithms and inputs to predict risk factors for NIHL reported accuracies ranging from 64% to 99% (Aliabadi et al., 2015; Farhadian et al., 2015; Kim et al., 2011; Mohd Nawi et al., 2011; Yin et al., 2019; Zhao et al., 2019; Fan et al., 2022). The main purpose of this study is to apply machine learning algo- rithms for estimating NIHL. The initial phase of the study aimed to compare regression algorithms, exploring the degree of hearing loss, mea- sured in dB, attributed to the same eight independent variables. The second phase of the study focused on comparing classification algo- rithms to determine if eight independent variables contribute to NIHL in workers.
MATERIALS AND METHODOLOGY Study Variables
The study included 1477 workers, consisting of 1247 (84.4%) males and 230 (15.6%) females. The population was aged between 18 and 60. The study was conducted in accordance with the Declaration of Helsinki and approved by the Institutional Ethics Committee of Gazi University (June 5, 2023) for studies involving humans. Table 1 displays the description and cat- egories of variables that are part of the data collection that was utilized for the investigation. In this study, the effects of gender, age, total working time (years), working time in the sector (years), working time in a noisy environ- ment (months), smoking, having a noisy hobby and inadequate use of ear protection equipment on noise-induced hearing loss (NIHL) were evaluated in the forest sector.
14 Do ˘gru and Çakıt
Table 1. Variables in the data set.
Table available in the original PDF paper.
Variable Name Definition Variable Type
Nominal
Gender Gender of the employee (Female/Male) Categorical Age Employee’s age Nominal Total working time (years)
The employee’s total working hours until the date of hearing test Nominal
Working time in the sector (years)
The employee’s total working hours in the sector until the date of the hearing test.
Nominal
Working time in a noisy environment (months)
The total number of months the employee has worked in a noisy workplace.
Categorical
Smoking Whether the employee smokes or not Categorical Noisy hobbies If the employee possesses a hobby beyond their professional life that can be characterized as producing a significant amount of noise.
Categorical
Personal protective equipment use
Does the employee utilize ear protection equipment during their work?
The employee’s audiometry test result in dB Nominal
Noise – induced hearing loss (NIHL) (dB)
Noise-Induced Hearing Loss (NIHL) and Audiogram Test The audiometry test involves transmitting sounds at frequencies of 500, 1000, 3000, 4000, 6000, and 8000 Hz to both ears of the employee in a quiet cabin. The sounds are sent sequentially with increasing intensity. The employee is instructed to press a button whenever they hear a sound. The intensity of the sound that the employee cannot hear is recorded in the evaluation of the audiogram (Ozdemir, 2016). This evaluation provides information about the degrees of hearing loss, which can be seen in Table 2. Hearing loss is considered to be present when values exceed 20 dB.
Table 2. Hearing loss degrees (adapted from ANSI, 2018).
Table available in the original PDF paper.
Hearing Threshold Level Degree of Hearing Loss −10 to 20 dB Normal hearing 20 to 40 dB Mild hearing loss 40 to 70 dB Moderate hearing loss 70 to 90 dB Severe hearing loss 90 dB or more Profound loss
For classification algorithms, such as decision trees, support vector machines, or neural networks, it is indeed common to categorize the depen- dent variable (NIHL status) into two classes: “NIHL present” for values above 20 dB and “NIHL absent” for values of 20 dB and below. These algo- rithms can then be used to identify the factors that contribute to the presence or absence of NIHL among employees, and to develop predictive models for early detection and prevention.
On the other hand, regression algorithms, such as linear regression or random forest regression, can be applied to analyze the quantitative rela- tionship between independent variables and the degree of hearing loss in decibels (dB) at specific frequencies, such as 4000 Hz. This approach helps in understanding the impact of workplace factors on the severity of hearing
Prediction of Noise-Induced Hearing Loss in the Forest Sector 15
loss and can inform targeted interventions and control measures to mitigate NIHL risk.
RESULTS AND DISCUSSION
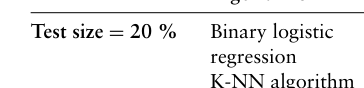
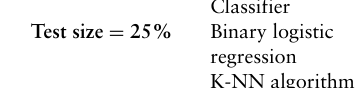
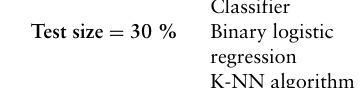
A total of twenty-four models were performed using eight distinct regression algorithms from the Python/Jupyter Notebook Scikit-Learn library. These models were trained with three different test data sizes (20%, 25%, and 30%) and underwent 10-fold cross-validation. Similarly, twenty-four models were established using eight different classification algorithms from the same library, following the same test data sizes and cross-validation process.
Performance Comparison of Regression Models By utilizing a variety of performance measures, the model accurately deter- mined the disparity between the actual and estimated values (Çakıt and Karwowski, 2015; Çakıt and Karwowski, 2017; Çakıt et al., 2020; Çakıt and Da˘gdeviren, 2022; Çakıt and Da˘gdeviren, 2023). The evaluation of regres- sion models involves comparing various metrics such as root mean square error (RMSE), mean square error (MSE), mean absolute error (MAE), mean absolute percentage error (MAPE), and r-squared (R2) values. The regres- sion algorithm that exhibits the lowest RMSE, MSE, and MAE values, along with the highest R2 score, is considered to be the best performed model. The performance analysis of these regression models is tabulated in Table 3.
Table 3. Performance comparison of machine learning algorithms for prediction.
The regression analysis of this study yielded the most favorable outcomes in terms of RMSE, MSE, MAE, and R2 values when employing multiple linear regression with a test size of 25%, as indicated in Table 3.
Performance Comparison of Classification Models Classification models using various performance metrics derived from a con- fusion matrix, such as accuracy, recall, precision, F-1 score and ROC score. The ROC score is particularly important for assessing a model’s ability to dis- tinguish between positive and negative classes, with higher values indicating better performance in this regard. Performance comparisons of classification models are shown in Table 4.
Table 4. Performance comparison of machine learning algorithms for classification.
Table available in the original PDF paper.
Algorithms Accuracy Recall Precision F1 score ROC Score
As shown in Table 4, the random forest algorithm provided the best results when tested with a data size of 20%, considering these metrics, suggests that it achieved a good balance between correctly identifying positive instances,
Prediction of Noise-Induced Hearing Loss in the Forest Sector 17
minimizing false positives, and achieving high overall accuracy. Addition- ally, the cross-validation with 10 folds helps ensure that the results are more robust and less prone to overfitting or random variability. Corresponding confusion matrix is tabulated in Table 5.
Table 5. Confusion matrix of the random forest algorithm.
Table available in the original PDF paper.
Predicted negative Predicted positive Actual negative 167 (True negative) 25 (False positive) Actual positive 49 (False negative) 55 (True positive)
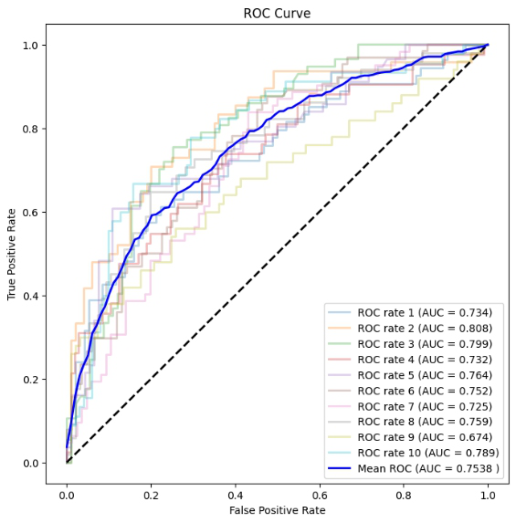
Based on the ROC curve plot in Figure 1, it was determined that there was a “acceptable distinction” between individuals with NIHL and those without, as indicated by the ROC score of 75 % obtained using the random forest algorithm.
This score suggests that the algorithm is effectively identifying the presence of NIHL in the data with a reasonable level of accuracy. An ROC score of 75% is generally considered to be a good performance, as it demonstrates that the algorithm can differentiate between the two groups with a balance of true positive and false positive results.
Figure 1: ROC curve graph of the random forest algorithm.
The random forest algorithm emerged as the most effective classification method, yielding an accuracy of 75% when tested with a data size of 20%.
18 Do ˘gru and Çakıt
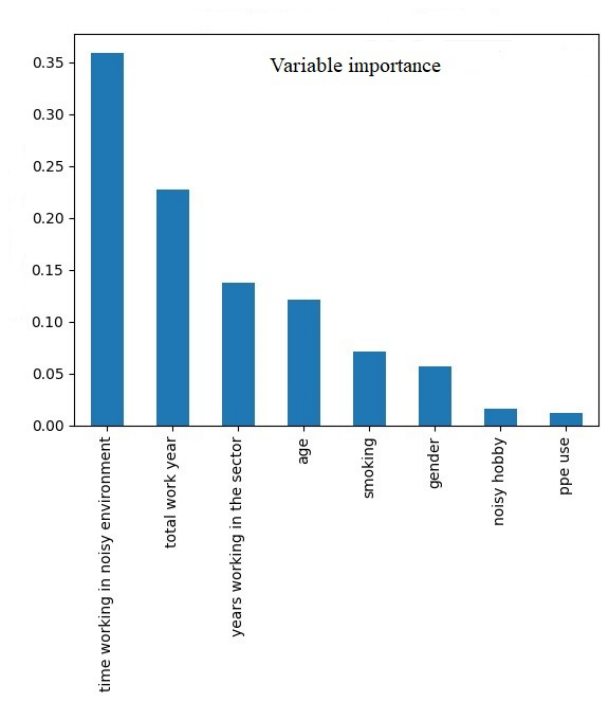
Sensitivity analysis of the random forest algorithm revealed that the “working time in a noisy environment” was the most influential parameter, affecting outcomes at a rate of 35 % (Figure 2). This finding could be valuable for organizations and businesses to understand the importance of providing suit- able working conditions for their employees, as it may significantly affect the accuracy of their classifications.
Figure 2: Sensitivity of input variables versus output variable for random forest algorithm.
CONCLUSION
Regression and classification algorithms are therefore useful methods for assessing NIHL in forest sector workers who are subjected to noise. The findings of this study can guide the implementation of engineering controls to reduce noise levels, administrative controls such as limiting exposure time, and the use of personal protective equipment like hearing protection devices. It also helps in monitoring and evaluating the effectiveness of the hearing conservation program over time. By leveraging machine learning techniques,
Prediction of Noise-Induced Hearing Loss in the Forest Sector 19
researchers and occupational health professionals can gain valuable insights to improve workplace conditions and protect employees from the adverse effects of noise exposure. Additional research is anticipated to enlist a greater number of participants and incorporate additional predictors that are per- tinent to noise-induced hearing loss. This will allow for a comprehensive exploration of the underlying causes of noise-induced hearing loss or related issues, including hidden hearing loss, noise-induced tinnitus, and hyperacusis. In conclusion, by sharing the collected data among researchers and increas- ing the sample sizes, the field of NIHL research and occupational health can benefit from the development and implementation of more advanced and robust machine learning techniques, such as deep learning. This collaborative approach will likely result in improved models for identifying and preventing NIHL, ultimately benefiting the affected individuals and society as a whole.
REFERENCES
ASA/ANSI S3.6–2018 (R2023): Specification For Audiometers. https://blog.ansi.or g/asa-ansi-s3-6-2018-r2023-audiometers-specification/ Accessed 15 Jan 2024. Aliabadi, M., Farhadian, M., & Darvishi, E. (2015). Prediction of hearing loss
among the noise-exposed workers in a steel factory using artificial intelligence approach. International archives of occupational and environmental health, 88, 779–787. Abdollahi, H., Mostafaei, S., Cheraghi, S., Shiri, I., Mahdavi, S. R., & Kazemnejad, A. (2018). Cochlea CT radiomics predicts chemoradiotherapy induced sensorineural hearing loss in head and neck cancer patients: a machine learning and multi-variable modelling study. Physica Medica, 45, 192–197. Chang, Y. S., Park, H., Hong, S. H., Chung, W. H., Cho, Y. S., & Moon, I. J. (2019).
Predicting cochlear dead regions in patients with hearing loss through a machine learning-based approach: A preliminary study. PLoS One, 14(6), e0217790. Çakıt, E. (2019). Analysis of Noise Level in a Campus Area: Case Study for Gazi University Maltepe Campus. Ergonomics International Journal, 3(4), 1–8. Çakıt, E., & Karwowski, W. (2015). Fuzzy inference modeling with the help of fuzzy
clustering for predicting the occurrence of adverse events in an active theater of war. Applied Artificial Intelligence, 29(10), 945–961. Çakıt, E., & Karwowski, W. (2017). Predicting the occurrence of adverse events using an adaptive neuro-fuzzy inference system (ANFIS) approach with the help of ANFIS input selection. Artificial Intelligence Review, 48(2), 139–155. Çakıt, E., Karwowski, W., & Servi, L. (2020). Application of soft computing
techniques for estimating emotional states expressed in Twitter® time series data. Neural Computing and Applications, 32, 3535–3548. Çakıt, E., & Da˘gdeviren, M. (2023). Comparative analysis of machine learning algorithms for predicting standard time in a manufacturing environment. AI EDAM, 37, e2. Çakıt, E., & Da˘gdeviren, M. (2022). Predicting the percentage of student placement:
A comparative study of machine learning algorithms. Education and Information Technologies, 27(1), 997–1022. Fan, B., Wang, G., Han, H., Li, B., Wang, L., Qu, C., Zhang, X., Liu, H., Sun, Z., Zhou, Y., Zhang, Y. and Wu, W. (2022). Machine Learning Model Identifies Genomic Variation in Noise-Induced Hearing Loss via Wholeexome Sequenc- ing. Research Square, Vol. 2. Website: https://www.researchsquare.com/article/r s-1829497/v2.
20 Do ˘gru and Çakıt
Farhadian, M., Aliabadi, M., & Darvishi, E. (2015). Empirical estimation of the grades of hearing impairment among industrial workers based on new artificial neural networks and classical regression methods. Indian journal of occupational and environmental medicine, 19(2), 84. Kim, Y. S., Cho, Y. H., Kwon, O. J., Choi, S. W., & Rhee, K. Y. (2011). The risk rating
system for noise-induced hearing loss in Korean manufacturing sites based on the 2009 survey on work environments. Safety and health at work, 2(4), 336–347. McKearney, R. M., & MacKinnon, R. C. (2019). Objective auditory brainstem response classification using machine learning. International journal of audiol- ogy, 58(4), 224–230. Nawi, N. M., Rehman, M. Z., & Ghazali, M. I. (2011). Noise-induced hearing loss
prediction in Malaysian industrial workers using gradient descent with adaptive momentum algorithm. International Review on Computers and Software, 6(5), 740–748. Ozdemir, M. (2016). “Investigation of Noise-Induced Hearing Loss in Employees in Small-Scale Body Works”, Occupational Health and Safety Specialization Thesis, The Republic of Türkiye Ministry of Labor and Social Security, Ankara. Yin S., Wang H., Jiang Z. and Huang S. (2019). Noise-Induced Hearing Loss and It’s
Individual Susceptibility Laryngo-Rhino-Otologie 2019; 98(S02): p. 159. Zhao, Y., Li, J., Zhang, M., Lou, Y., Xie, H., Tian, Y. and Qui, W. (2019). Machine Learning Models for the Hearing Impairment Prediction in Workers Exposed to Complex Industrial Noise: A Pilot Study. Ear and Hearing, 40(3). pp. 690–699.
LISTED IN THE AHFE DIGITAL BOOKSTORE CATALOGUE
Explore the complete digital volume
Physical Ergonomics and Human Factors
Read this individual research paper free through the original publisher, or explore the full digital proceedings book.
ISBN 978-1-964867-23-6
Explore this ISBN in the AHFE Bookstore ↗Listed in the July 2026 bookstore catalogue; search by ISBN to confirm current availability · Digital book purchase optional