Zhimao Hu (2023). Lane Changing Behavior Recognition of Other Vehicles Considering Driving Tendency. In: Ergonomics In Design. AHFE Open Access, vol. 77, pp. 624–635. https://doi.org/10.54941/ahfe1003422
Autonomous driving technology includes four links: perception, cognition, decision-making, and behaviour. The cognition plays a vital role as a bridge between perception and decision-making. In the cognition link, accurate identification of the intention and behaviour of surrounding vehicles is a necessary prerequisite for autonomous vehicles to make correct behaviour decisions, and it is conducive to reducing the driving risk of own vehicle. Different from driving style, driving tendency has the characteristics of dynamic and behavioural decision-making preference. Being able to identify the driving tendency of surrounding vehicles in real time will be more conducive to making reasonable behavioural decisions for own vehicle. Therefore, this paper takes the lane change trajectory data of passenger cars in the NGSIM open-source database as the research sample. Firstly, the problem of data imbalance is considered, and the imbalanced samples are sampled using the method of uniformly dividing the data set. Secondly, from the perspective of own vehicle, the characteristic indicators that can represent the tendency of the surrounding vehicles to change lanes are mined. Finally, the GRU deep learning algorithm is used to establish a real-time identification model for aggressive lane change behaviour. Compared with the traditional method, the method proposed in this paper can effectively identify the tendency of lane change behaviour of surrounding vehicles in the early stage of lane-changing behaviour and has higher recognition accuracy. The research results show that the real-time identification of the tendency of the lane change behaviour of the surrounding vehicles is beneficial to the assessment and quantification of the driving risk of own vehicle, and also provides a theoretical basis for the decision-making of own vehicle, which is of great significance to the safe driving of own vehicle.
Some studies have shown that in the human-vehicle-road-environment, human is the most important factor causing traffic accidents, accounting for more than 90%. In order to make up for the deficiency of human in dri- ving, intelligent driving as well as driverless driving came into being in order to replace human driving, thus improving the efficiency of traffic, reducing traffic accidents and ensuring driving safety.
Lane Changing Behaviour Recognition of Other Vehicles Considering Driving Tendency 625
Among all driving behaviours, lane changing is one of the most common but relatively complicated driving behaviours in the daily driving of vehi- cles. Improper lane changing behaviours can easily lead to traffic accidents (Wang Z et al. 2017). Studies have shown that lane changing scenes are the main scene of traffic accidents. According to the National Highway Traffic Safety Administration, 75% of traffic accidents occur during lane changes (Woo H et al. 2017).
The influence of the physiological-psychological characteristics of car dri- vers on traffic safety is largely expressed as driving propensity, i.e., the experience of the car driver’s attitude toward the real traffic situation under the influence of various dynamic factors, and the preference of the decision or behavioural value that corresponds to it, reflecting the psycho-emotional state exhibited by the driver in the process of vehicle operation and move- ment (Feng Xueqin et al. 2007). And the driving propensity studied in this paper refers only to whether the vehicle is aggressive when changing lanes.
In the study of driving behaviour recognition, the selection of indicators that can correctly characterize the lane change behaviour has an important impact on the recognition effect of the recognition model. The essence of driving behaviour recognition is a problem of time series classification. Liu et al analyzed the steering distance control model and obtained the relation- ship between steering wheel angle and driver’s lane-changing behaviour, and constructed a lane-changing behaviour recognition model based on parallel Bayesian network algorithm, where the final state of driving behaviour was determined by the maximum probability of each state during lane-changing (2010). Peng et al. analyzed driving behaviour, vehicle state, and environmen- tal information based on natural driving experiments, screened the indicators characterizing lane-changing behaviour, and constructed a lane-changing behaviour prediction model based on BP neural network (2015).
In the study of driving behaviours, especially when classifying lane chan- ging behaviours by whether they are aggressive or not, the data is usually unbalanced. Using unbalanced data in the training of machine learning algorithms may lead to biased results, which may result in a degrada- tion of the model’s performance in recognizing behaviours. Therefore, this paper performs sample balancing of imbalanced samples before using the classification algorithm. In addition, there is little research on the identifi- cation of aggressive lane-changing behaviour in China and there is no clear definition and quantitative evaluation criteria for aggressive lane-changing behaviour.
This paper intends to screen out feature indicators that can characte- rize the propensity of other vehicle lane changing behaviour, so as to identify the aggressive lane changing behaviour. The imbalanced samples are sampled by using uniformly divided data set method to reduce the degree of sample imbalance. Finally, a GRU deep learning algorithm is used to build an aggressive lane-changing behaviour recognition model. The method provides a new idea for identifying aggressive lane-changing beh- aviours, from which timely risk warning and preventive measures can be proposed, and also provides a theoretical basis for subsequent behavioural decisions.
626 Hu
LANE CHANGE BEHAVIOUR EXTRACTION AND CLUSTERING Data Pre-Processing
In this paper, we use US-101 data in NGSIM dataset, and use two algorithms of smoothing and wavelet filtering to realize the denoising of the data.
The dataset was collected by the Next Generation Traffic Simulation Pro- gram, which was jointly opened by the U.S. government transportation department in conjunction with Virginia Tech and other organizations. The precise location of each vehicle in the study area is provided at 0.1-second intervals, resulting in detailed lanes where each vehicle is located and its position relative to other vehicles.
Smoothing is a data pre-processing technique used to reduce random noise or irregular fluctuations in data, making it smoother and more reliable. Smo- othing improves the readability and reliability of the data and reduces errors and outliers in the data, thereby improving the quality and accuracy of the data. Wavelet denoising is a signal processing technique that uses the wavelet transform to remove noise from a signal. The principle is based on the wave- let transform’s perfect balance of time and frequency to separate the signal from the noise. Using wavelet decomposition enables the signal to be decom- posed into individual frequency bands and selectively filter or eliminate the noise bands to retain useful information.
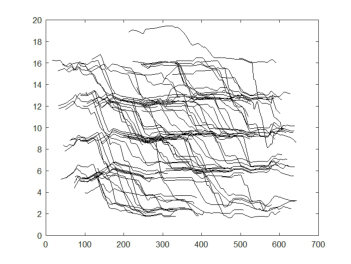
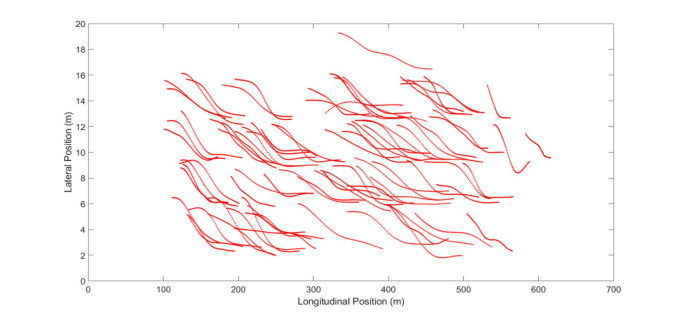
Convert the feet into meters, decompose the position of the vehicle, and get the trajectory of the longitudinal and lateral motion of the vehicle. The trajectory diagrams before and after filtering are shown in Figure 1.
Lane Change Behaviour Extraction According to the research purpose of this paper, only the left lane change data in the US-101 dataset is extracted as the research object. When extra- cting the lane change data, the moment t0 when the lane change vehicle runs over the lane line is firstly identified, and the data within the range of [t0−10, t0+10] is extracted as the initial lane change data. It is also neces- sary to extract the driving data of the vehicle behind the corresponding target lane. The schematic diagram of vehicle sample selection is shown in Figure 2.
Figure 1: Trajectory diagram before and after filtering.
Lane Changing Behaviour Recognition of Other Vehicles Considering Driving Tendency 627
Figure 2: Schematic diagram of vehicle sample selection.Figure 3: Initial trajectory diagram and lane change trajectory diagram.
The two-dimensional vector composed of the vehicle’s lateral position information and longitudinal position information is used as the input of the K-means (K = 3) clustering algorithm. The time point of the starting point of the lane change is t1, and the time point of the end point of the lane change is t2. The trajectory of the lane-changing sample vehicle [t0−10, t0+10] time period is divided into the following three sections. [t0−10, t1] the straight-going stage before changing lanes; [t1, t2] the lane-changing stage; [t2, t0+10] the straight-going stage after changing lanes. The lane- changing stage is obtained by clustering, so as to obtain the start and end points of all lane-changing samples, and finally 290 left-hand lane-changing samples and 290 car-following samples are intercepted. The initial trajectory diagram and the lane change trajectory diagram are shown in Figure 3.
628 Hu
Lane Change Behaviour Feature Selection and Sample Clustering When the driver of the lane change vehicle affects the normal driving of the car behind the target lane due to the lack of observation or poor timing con- trol as well as his own subjective will, which objectively causes substantial infringement to the car behind, the lane change behaviour is called aggressive lane change. The aggressive and normal lane change behaviours are obtained by clustering the 290 lane change samples extracted. Before clustering, the required clustering features need to be constructed and selected.
The aggressiveness referred to in the aggressive lane change is the sub- stantial impact and harm caused to the vehicle behind the target lane, and the macroscopic aggressive lane change will affect the normal driving of the vehicle behind the target lane. The speed, acceleration, space headway and time headway of the vehicle behind the target lane (rear vehicle), the speed, acceleration, lane change duration, lane change longitudinal displacement, lane change lateral displacement and lane change heading angle of the lane change vehicle (front vehicle) are selected as the initial parameters, as shown in Table 1.
In addition to the lane change vehicle change duration, lane change lon- gitudinal displacement, and lane change transverse displacement, the mean, plural, maximum, minimum, 25% quantile, median, 75% quantile, standard deviation, and variance were solved for the other 11 parameters, and a total of 102 statistical features were constructed using the above 14 parameters.
The Laplacian Score method of unsupervised feature sorting was used to sort the feature importance of 102 statistical features, and the first 14 features with a normalized score less than 0.5 were selected as the optimal feature subset for clustering. The ranking results of the features are shown in Table 2.
Take the above 14 features as clustering features, and use K-means (K = 2) algorithm to cluster 290 lane change samples. The clustering results show that the number of samples in one category is 13, and the number of samples in the other category is 277.
Table 1. Initial parameters.
Table available in the original PDF paper.
No. Parameters Explanation 1 Vfy Longitudinal velocity of front vehicle, m/s 2 Vfx Lateral velocity of front vehicle, m/s 3 Afy Longitudinal acceleration of front vehicle, m/s2
4 Afx Lateral acceleration of front vehicle, m/s2 5 Tcl Lane change duration, s 6 Dfy Longitudinal displacement of lane change, m 7 Dfx Lateral displacement of lane change, m 8 Phi Heading angle, rad 9 Vby Longitudinal velocity of rear vehicle, m/s 10 Vbx Lateral velocity of rear vehicle, m/s 11 Aby Longitudinal acceleration of rear vehicle, m/s2
12 Abx Lateral acceleration of rear vehicle, m/s2
13 Hs Space headway of rear vehicle, m 14 Ht Time headway of rear vehicle, s
Lane Changing Behaviour Recognition of Other Vehicles Considering Driving Tendency 629
DATA SET BALANCE PROCESSING From the results of lane change clustering, the number of invasive lane change samples is far less than the number of normal lane change samples. Most classification algorithms prefer to learn the normal lane change samples with high proportion of samples, while ignoring the more important few invasive lane change samples. The use of unbalanced data in the training of machine learning algorithms may lead to a decline in the identification performance of the model for lane change behaviour types. Therefore, this paper samples the unbalanced samples before using the classification algorithm.
In this paper, the balancing method of dividing the dataset evenly is used in the process of balancing the dataset. Since the differences existing between similar samples should be small, this paper can try to directly divide the majo- rity class samples in the dataset evenly so that the number of majority class samples in each group after division is closer to the number of minority class samples in the dataset, and after that each group of normal channel change data and aggressive channel change data after grouping are combined into a dataset with relatively balanced class distribution respectively.
According to the ratio of the number of normal lane-changing sam- ples to the number of aggressive lane-changing samples, the normal lane-changing samples are divided into 22 groups, and the number of nor- mal lane-changing samples in the last 4 groups is 14, and the number of normal lane-changing samples in the other 18 groups is 13. These 22 groups of normal lane-changing samples are combined with aggressive lane-changing samples to form a relatively balanced data set. The numbers of the 22 sets of data sets are respectively E1, E2,..., E22. At this point, the sample balance processing is completed, and the 22 sets of normal lane change data sets and aggressive lane change data sets after sampling are planned to be used as the input of the subsequent classification model.
630 Hu
PREDICTING THE TRAJECTORY OF OTHER CARS CHANGING LANES AND DETERMINING THE TYPE OF LANE CHANGE GRU Network-Based Trajectory Prediction Model for Vehicle Lane Change
According to the historical trajectory data of the vehicle, the future position of the vehicle is obtained through Gate Recurrent Unit (GRU) neural network, and the vehicle trajectory in the future period is obtained through the rolling input of fixed-length data, and then it can be judged that the vehicle’s lane change in the future period is a normal lane change or an aggressive lane change.
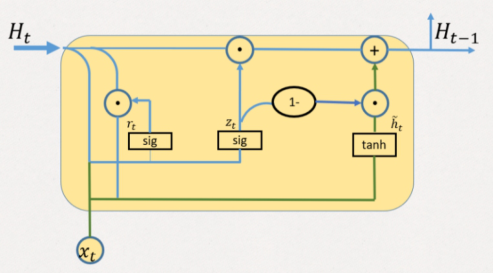
GRU is a modified Recurrent Neural Network (RNN) with a hidden layer unit in which the forgetting gate and the input gate are combined to form an update gate. GRU can solve the problem of gradient disappearance and gradi- ent explosion when traditional RNNs learn long-term dependencies in data. Some studies have shown that compared with LSTM, the calculation and implementation of GRU is simpler(Cho K et al. 2014), and has better conver- gence and generalization(Chung J et al. 2014). The structure of GRU unit is shown in Figure 4, where sig denotes the sigmoid activation function, tanh denotes the tanh activation function, the rt denotes the reset gate, zt denotes the update gate, Ht−1 denotes the hidden state at the previous moment, xt is the input at the current moment, and Ht denotes the hidden state at the current moment.
The hidden unit of GRU deletes or retains the input xt at the current moment and the hidden state Ht−1 at the previous moment through the reset gate rt and the update gate zt, so as to realize the capture of short-term time dependencies and long-term time dependencies. The definitions of the reset gate and the update gate are shown in Formula 1 and Formula 2.
Equations and mathematical formulas are available in the original paper PDF.
Figure 4: The structure of GRU unit.
Lane Changing Behaviour Recognition of Other Vehicles Considering Driving Tendency 631
where wr1, wr2, br, wz1, wz2, and bz are parameters, and the hidden state Ht at the current moment is defined as shown in Equation 3 and Equation 4.
Ht = zt J Ht−1 + (1 −zt) Jeht (3) eht=tanh(rtwh1Ht −1 + wh2xt + bh) (4) where J denotes the product of the corresponding position elements of two matrices, wh1, wh2, and bh are parameters. rt, zt, and eht are reset gate, update gate, and candidate hidden layer, respectively. The reset gate helps to capture short-term dependencies and the update gate helps to capture long-term dependencies.
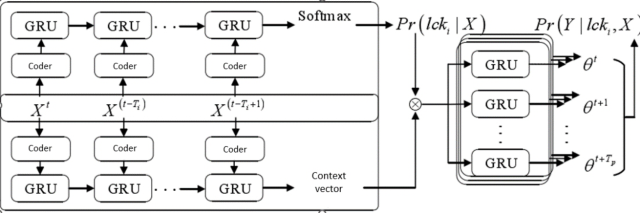
The car behind the target lane is selected as the interaction object, and an interactive driving behaviour recognition model based on the car behind the target lane is established. The historical trajectory information of the lane changing car is used as the input of the deep learning algorithm GRU, and the trajectory prediction model is shown in Figure 5.
As shown in Figure 5, the input information is expressed as: h
Where S(t) represents the lane change vehicle trajectory information, and LR(t) represents the vehicle trajectory information of the vehicle behind the target lane. Specifically described, based on the 14 feature indicators obtained above, and after screening multiple information combinations, it is determi- ned that the lane change vehicle St includes the lateral position, longitudinal position, longitudinal velocity, longitudinal acceleration, lateral velocity and lateral acceleration of the vehicle, described as (x(t), y(t), v(t), a(t), hv(t), ha(t)).
For the vehicle behind the target lane, this includes its lateral relative dista- nce and longitudinal relative distance from the lane change vehicle, as well as its own vehicle’s longitudinal velocity, longitudinal acceleration, lateral velo- city and lateral acceleration, described as (1x(t), 1y(t), v(t), a(t), hv(t), ha(t)).
Figure 5: Trajectory prediction model.
632 Hu
The output message is expressed as h
where Y(t) is the position of the lane change vehicle at t moment.
Through the chain rule, the input to output is represented as
where θ = [θt + 1, . . . , θt + tf ] represents the parameters of the binary Gaus- sian distribution, i.e., the mean and variance of the predicted positions at each time step. Pr(lcki|X) represents the output of the vehicle lane change type pre- diction module, which can only be one of aggressive lane change (QC) and normal lane change (NC). The input to the model is a feature X extracted from the historical trajectory of the vehicle. By adding the predicted vehicle position to X and removing the earliest moment of the vehicle record in X through a rolling method, the trajectory of the vehicle can be continuously predicted.
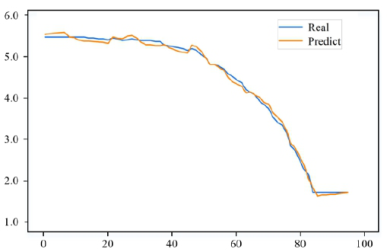
Take a lane change sample and compare the predicted track with the actual lane change track of the vehicle. The results are shown in Figure 6. The predicted trajectory can better reflect the real trajectory.
Recognition Results of Vehicle Lane Change Types Taking 290 groups of lane-changing samples as input data, set the model that directly uses the GRU neural network classifier without sample equalization processing as the control group, and uses the model of the GRU neural netw- ork classifier after sample equalization processing as the experimental group. The identification results of the two groups of classifiers are shown in Table 3 and Table 4.
Figure 6: Comparison of actual and predicted lane change trajectories.
Lane Changing Behaviour Recognition of Other Vehicles Considering Driving Tendency 633
Table 3. Control group identification results.
Table available in the original PDF paper.
Aggressive Normal number of validation samples 13 277 number of accurate predictions 10 235 accuracy 76.9% 84.8%
Table 4. Experimental group identification results.
Table available in the original PDF paper.
Aggressive Normal number of validation samples 13 277 number of accurate predictions 12 246 accuracy 92.3% 88.8%
Model Validity Verification The performance of the algorithm relies on its ability to identify aggressive lane changes using vehicle trajectory data. This paper uses four important per- formance indicators: Precision (P), Recall (R), F1 score (F1) and Area Under Precision-Recall Curve (AUPRC). The relevant formula is as follows.
(10)
(11)
In the formula, N1 is the number of aggressive lane changes that are cor- rectly identified; N2 is the number of normal lane changes that are wrongly identified as aggressive lane changes; N3 is the number of aggressive lane changes that are wrongly identified as normal lane changes.
The precision-recall curve is a curve of precision and recall for different classification thresholds between 0 and 1. The precision-recall curves should be used when there is an imbalance in the data, because the ROC curves for imbalanced data can be deceptive and lead to misinterpretation of the model performance (SAITO T et al. 2015), Therefore, in this paper, we use the area under the precision-recall curves to compare the performance of the algorithms.
In this paper, the validity of the models of the control and experimental groups was verified using the above four performance metrics, and the Pre- cision, Recall, F1 score and AUPRC of the experimental models of the two groups after cross-validation and Bayesian tuning are shown in Table 5.
Table 5 shows that the experimental group has a large improvement in model performance compared with the control group, which indicates that the equilibrium treatment of the samples is beneficial to improve the discrimi- nation performance of the model. And it can be seen that the GRU algorithm used in this paper has a good discrimination effect.
634 Hu
Table 5. Performance evaluation of models.
Table available in the original PDF paper.
Precision Recall F1 score AUPRC control group 83.3 76.9 80.0 86.9 experimental group 85.7 92.3 88.9 92.5
CONCLUSION
In this paper, the passenger car lane change trajectory data in the NGSIM open- source database is used as the research sample. Firstly, the class imba- lance problem appeared in the sample is considered, and the imbalanced samples are sampled using the method of uniformly dividing the dataset. Secondly, feature indicators that can characterize the tendency of surrounding vehicles’ lane-changing behaviour are mined. Finally, the GRU deep learning algorithm is used to establish the aggressive lane changing behaviour recogni- tion model. Compared with the traditional methods, the proposed method can accurately identify the lane change type and has higher recognition accu- racy. The method provides a new idea for identifying aggressive lane changing behaviour, which can propose timely risk warning and preventive measures, as well as provide a theoretical basis for subsequent behavioural decisions.
In view of the deficiencies of this paper, future research can start from the following aspects:
In this paper, the identification of aggressive lane-changing behaviour is achieved only based on the motion parameters of the car, while the environment, road, and human factors are not taken into account. The identification of aggressive lane-changing behaviour by fusing existing parameters and with other relevant parameters is the focus of subsequent research.
Building models with high real-time and accuracy and deploying them in the upper computer to realize real-time recognition of driver aggres- sive lane changing behaviour terminals and to signal early warning to drivers or execute interventions are the focus of further research. Fur- ther, it is expected that driving risk assessment and decision advice can be established to improve driving safety.
REFERENCES
Cho K., Van Merriënboer B., Gulcehre C. (2014). Learning phrase representations using RNN encoder-decoder for statistical machine translation. arXiv preprint arXiv, pp. 1406–1078. Chung J., Gulcehre C., Cho K H. (2014). Empirical evaluation of gated recurrent
neural networks on sequence modeling. arXiv preprint arXiv, pp. 1412–3555. Feng Xueqin., Fang Chunquan. (2007). Cluster analysis of driver characteristics evaluating indicator. Communications Science and Technology Heilongjiang, 28(11), pp. 161–163. Liu L., Xu G Q., Song Z. (2010). Sixth International Conference on Natural
Computation, Yantai, China, pp. 1232–1237. Peng J., Guo Y., Fu R. (2015). Multi-parameter prediction of drivers’ lane-changing behaviour with neural network model. Applied Ergonomics, pp. 207–217.
Lane Changing Behaviour Recognition of Other Vehicles Considering Driving Tendency 635
SAITO T., REHMSMEIER M. (2015). The precision-recall plot is more informative than the roc plot when evaluating binary classifiers on imbalanced datasets. PloS ONE, 10(3), pp. 1–21. Wang, Z., Ramyar, S., Salaken, S. M., Homaifar, A. Nahavandi, S. and Karimoddini, A. (2017). A collision avoidance system with fuzzy danger level detection. IEEE Intelligent Vehicles Symposium. Woo, H., Yonghoon, J I., Kono, H. (2017). Lane-Change Detection Based
on Vehicle-Trajectory Prediction. IEEE Robotics & Automation Letters, 2(2), pp. 1109–1116.
LISTED IN THE AHFE DIGITAL BOOKSTORE CATALOGUE
Explore the complete digital volume
Ergonomics In Design
Read this individual research paper free through the original publisher, or explore the full digital proceedings book.
ISBN 978-1-958651-53-7
Explore this ISBN in the AHFE Bookstore ↗Listed in the July 2026 bookstore catalogue; search by ISBN to confirm current availability · Digital book purchase optional