Wei Cao, Peiwei Zhang, Peifei Xu (2023). Feasibility study on damage detection of composite materials based on millimeter wave. In: Human-Centered Aerospace Systems and Sustainability Applications. AHFE Open Access, vol. 98, pp. 44–54. https://doi.org/10.54941/ahfe1003918
Internal damage detection technology of composite materials is one of the hot topics in the field of materials research. Millimeter wave has the advantages of high resolution, penetration and high safety, and has great potential for nondestructive testing of composite materials. This paper studies the feasibility of millimeter-wave detection of composite material damage. The mechanical scanning method of horn antenna is selected. A motion control module for mechanical scanning and a 35GHz radar imaging technology based on wave-number domain algorithm are introduced. The motion control module uses the data acquisition card to transmit the control signal and realizes the step motion control and direction control of the mechanical scanning guide rail. Based on wave-number domain radar imaging technology, a point target simulation program of two dimensional coronal plane and cross section is written. The target scattering point model is established by simulation, and the target position can be reconstructed clearly after processing by wave-number domain radar imaging algorithm. The imaging resolution is quite high, which verifies the feasibility of damage detection of composite materials based on millimeter wave and lays a foundation for the further development of composite material nondestructive testing equipment.
Non-destructive testing of composite materials is a non-destructive testing method that uses sound, light, electricity and other technologies to identify the internal microstructure, defects and damage of composite materials with- out affecting the future performance of composite materials. According to the detection type, it can be divided into ultrasonic detection, X-ray dete- ction, infrared microwave detection, eddy current detection (Ibrahim, 2014). The application of microwave detection technology in composite materials can be traced back to the 1930s. The American military firstly used micro- wave technology to detect the porosity defects of solid propellers in large missile rockets, the dis-adhesion of nozzle liner and the quality of insulating
Feasibility Study on Damage Detection of Composite Materials Based on Millimeter Wave 45
ceramics of space shuttle (Ren et al., 2012). With the development of micro- wave detection, millimeter wave detection technology also appears in the public view.
Millimeter wave refers to electromagnetic wave with a frequency of 30GHz ∼300GHz. Compared with microwave, millimeter wave has shor- ter wavelength and stronger penetration, and it is easy to achieve large signal bandwidth and extremely narrow antenna beam, so as to obtain clear target imaging (Jinshan Ding et al., 2013). At present, millimeter wave technology has become one of the hot researches in various institutions. Pacific Northwest National Laboratory of the United States (PNNL) deve- loped a close-range fixed-frequency plane scanning system, and developed a three-dimensional holographic imaging system based on cylindrical scan- ning in order to improve the resolution, which combined SAR technology and microwave holographic technology, and the imaging time is very short (Huguenin 1994). The impact damage of carbon fiber reinforced composi- tes was detected by millimeter wave imaging with frequency range of 65–67 GHz (Seung-Hwan Yang et al., 2013). A sawtooth linear frequency modu- lated continuous millimeter wave with a central frequency of 195GHz and a bandwidth of 42GHz was used to detect the embedded internal defects of polymer materials. The classical reflection distance migration algorithm based on free space Green function was improved to effectively characterize the internal defects of materials (Zhang Xiaoxuan et al., 2020).
The manufacturing defect and damage of composite materials will reduce the residual strength and shorten the service life of the structural parts due to the continuous expansion of stress in the service process. Therefore, timely monitoring of material defects, damage and evolution without damaging the structural integrity of composite materials is a necessary and effective measure to ensure its service performance. Millimeter wave has strong pene- tration ability to non-metallic materials, and has good detection effect for facial defects such as debonding. With high imaging accuracy and fast ima- ging speed, the detection of internal defects of composite materials can be realized quickly, continuously and in real time. In this paper, the feasibi- lity of millimeter wave technology applied to the internal damage detection of composite materials is studied. The mechanical scanning mode of horn antenna is selected. A motion control module for mechanical scanning and a 35GHz radar imaging technology based on wave-number domain algori- thm are introduced, which lays a foundation for the further development of non-destructive testing equipment for composite materials.
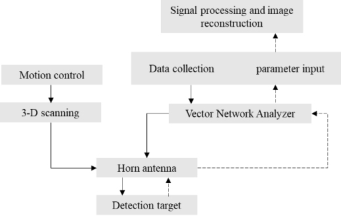
SYSTEM STRUCTURE DESIGN The damage state detection system of composite materials based on milli- meter wave is mainly composed of two parts: the motion control module for mechanical scanning and the radar imaging algorithm for image recon- struction. The motion control module mainly aims to realize the mechanical scanning of the measured target point by point by the horn antenna of one-dimensional linear array in a two-dimensional plane. Radar imaging algorithm is based on 35GHz millimeter wave radar wave number domain imaging algorithm. The system structure is shown in Figure 1.
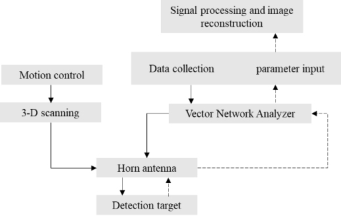
Figure 1: Block diagram of composite damage state detection system based on millimeter wave.Figure 2: Flow of motion control module.
The detection system moves the horn antenna to the detection position through the motion control module. At this time, the vector network analy- ser (VNA) outputs the millimeter wave signal with specific frequency and waveform, and radiates the measured composite material through the horn antenna. The horn antenna then receives the composite’s echo signal, which is stored in a computer through the VNA. After signal processing and image reconstruction in the related software, the internal damage state image of the composite material is finally obtained.
IMPLEMENTATION OF MOTION CONTROL The motion control module realizes the horn antenna of one-dimensional linear array to scan the target point by point in a two-dimensional plane. The main process is as follows: a software called LabVIEW uses the built-in function DAQmx to write an algorithm to control the data acquisition card USB-6251 to generate pulse control signals, and the pulse signals are tran- smitted to the stepper motor driver DM542S, finally driving stepper motor 57BYG250C-8 for movement. In the motion control module, LabVIEW software controls the data acqui- sition card USB-6251 to output pulse signals to the stepper motor driver DM542S, which drives the stepper motor to control the stepper movement of the guide rail. The system adopts X-direction array antenna and Y-direction step-by-step movement, so as to achieve the effect of two-dimensional scan- ning. In the application scenario, round-trip scanning is required. Therefore, in addition to the Y-direction stepping motion, round-trip motion in the Y-direction must also be implemented, that is, the guide rail movement direction must be controlled.
Step Motion Control Step motion control is to realize the array antenna move a fixed distance on Y-axis. The pulse signal output by the data acquisition card is used to
Feasibility Study on Damage Detection of Composite Materials Based on Millimeter Wave 47
Figure 3: Step motion control block diagram.
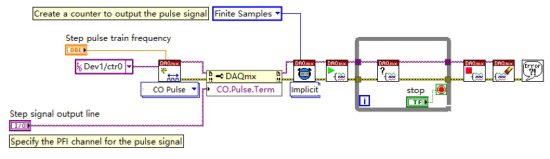
control the rotation of the stepper motor, and then the guide rail moves in the direction of the Y-axis. The moving distance of the guide rail in the Y-axis direction is determined by the speed of the stepper motor. The moving speed of the slide rail is proportional to the frequency of the pulse signal. Therefore, the control of the moving distance of the slide rail is equivalent to the control of the pulse frequency and number of the output of the data acquisition card. The pulse signal terminal of the data acquisition card is connected to the pulse signal interface of the motor driver. The output pulse signal control block diagram in LabVIEW is shown in Figure 3.
A variety of VI functions are built into the DAQmx driver of LabVIEW, which can be used to write a control program for the step movement of guide rail: First, create a virtual channel to set the generated pulse signal frequency, and specify the PFI channel to output the pulse signal on the data acquisition card. Then, the implicit timing VI in DAQmx is used to set the generation mode of pulse signals, and a finite number of pulse signals are generated by a finite sampling method to achieve the specified moving distance. After starting the task, use the task completion VI with the loop instruction to ensure the completion of the step motion. After the task is complete, run the Stop and Clear task VI command to end the task and release the task memory.
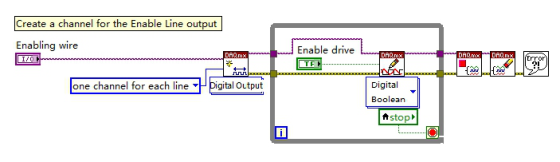
Motion Direction Control In the actual application scenario, the guide rail needs to reciprocate motion, so the motion direction of the guide rail needs to be controlled. The direction control of guide rail is mainly reflected in the processing of digital signal IO output by data acquisition card. Connect the digital signal output terminal of the data acquisition card to the direction control interface of the motor driver. Figure 4 shows the digital signal control block diagram of the output in LabVIEW.
Figure 4: Motion direction control block diagram.
In the above motion direction control program, DAQmx creates a DO digi- tal output virtual channel for digital signal transmission, with a line command specifying single-channel single-wire mode for digital signal transmission. The generated digital signal is transmitted to the body of the while loop, which contains the Boolean variable controlling the direction and the digital Boolean written point by point to VI. The motor steering is controlled by wri- ting different Boolean values to control the running and termination of the cycle. After the program terminates, stop task VI and clear task VI are added to clear resources occupied by the program to avoid the memory waste cau- sed by repeated running of write commands. Through the step motion control program and motion direction control program, the motion control module can realize the step motion and motion direction control of the guide rail in the Y-direction.
RADAR IMAGING ALGORITHM Near field millimeter wave holographic imaging algorithms mainly include matching filter imaging algorithm, compressed sensing imaging algorithm and regular imaging algorithm. This chapter focuses on the traditional wave-number domain based matching filter imaging algorithm, introduces the principle of two-dimensional cross-section and two-dimensional coronal plane imaging, and conducts corresponding simulation analysis to verify the rationality and effectiveness of the algorithm.
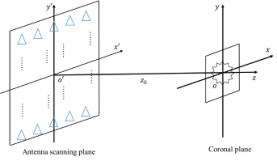
Two-Dimensional Coronal Plane Imaging Algorithm Two-dimensional coronal plane imaging is based on receiving the echo signal of the target scanned by two-dimensional planar array antenna. The coronal plane describes the scattered signal distribution on the transverse and verti- cal combined plane of the target. In the scenario of near-field scanning, the distance between the measured target and the antenna is very close, and the time of mechanical movement of the antenna is much longer than the time of sending and receiving signals. Therefore, the antenna is relatively stationary when sending and receiving signals, and transmits millimeter-wave single- frequency signals “step by step” on the scanning plane. The two-dimensional coronal plane imaging model is shown in Figure 5.
In the two-dimensional coronal imaging model, the coordinate of the scan- ning antenna point is set as (x′, y; z = z0), which will change constantly with the scanning process, the coordinate of the target point is (x, y; z = 0),
Feasibility Study on Damage Detection of Composite Materials Based on Millimeter Wave 49
the frequency of transmitting millimeter-wave single-frequency point signal is f, and the image function reconstructed by the target point is g(x, y; z = 0). Then the target point echo signal received by the antenna scanning point is expressed as
Equations and mathematical formulas are available in the original paper PDF.
Where r is the distance between the target point and the scanning point. k = 4πf/c is the constant multiple of the wave number vector of millimeter wave signal transmitted at the scanning point position. The coronal imaging algorithm based on wave number domain analyses and processes the echo signal of the target point in the spatial domain, and uses the echo signal E(x′, y′; z = z0) of the target point as the two-dimensional space Fourier transform FT2. The spatial spectral echo signal of the target point in the wavenumber domain is as follows.
(2)
gf(kx, ky; z = 0) = Ef(kx, ky; z = z0) · exp(−jkzz0) (3) Use the two-dimensional Fourier transform, and the image function g(x, y; z = 0) is expressed as
n
o
FT2
· exp(−j q
k2 −k2x −k2y · z0) (4)
Therefore, the calculation steps of coronal imaging algorithm of matched filtering based on wave number domain are shown as follows.
Firstly, the target echo signal received by the transceiver antenna is tran- sformed into a two-dimensional Fourier transform in the space domain, and the space domain is transformed into the wave number domain to obtain the spatial spectrum signal of the target in the wave number domain. Finally, the two-dimensional inverse Fourier transform of the spatial spectral signal of the target is carried out to obtain the two-dimensional coronal target image.
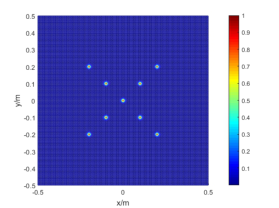
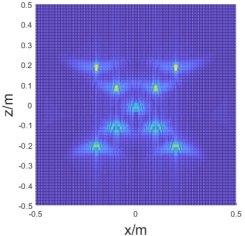
Two-Dimensional Coronal Plane Imaging Simulation Section 4.1.2 analyses and deduces the two-dimensional coronal imaging algorithm based on wave number domain, and this section will analyse the imaging simulation experiment of this algorithm. In the simulation analy- sis, a single frequency millimeter wave signal with a frequency of 35GHz is adopted, and the target coordinates of each scattering point are (0.2, 0.2), (−0.2, −0.2), (−0.2, 0.2), (0.1, 0.1), (−0.1, −0.1), (0.1, −0.1), (0.1, −0.1), (0.1, −0.1), (0.1, −0.1), (−0.1,), (−0.1,), (−0.1, 0.1), (0,0). Parameters in the simulation program are shown in Table 1.
The imaging results of simulation experiment are shown in Figure 6 and Figure 7.
Table 1. Parameter settings of coronal imaging simulation experiment.
Table available in the original PDF paper.
Parameter Value
0.5m
Signal frequency 35GHz Antenna sweep area 1m*1m Imaging region 0.4m*0.4m Sampling number 478*478 Sampling interval 2mm Distance between the scanning plane and the central of the measured target
a) Initial data wavenumber distribution
b) Compression wavenumber distribution
c) Windowed wave number distribution
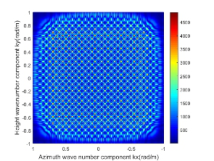
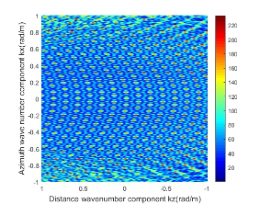
Figure 6: Simulated wave number distribution in the coronal plane.Figure 7: Simulation imaging of point target in the coronal plane.
As can be seen from the coronal simulation wave-number distribution in Figure 6, wave-number component distributions in the wave-number domain are identical and uniformly distributed after matching filtering. Pulse com- pression will not affect the wave-number distribution of the signal. After the smooth window is introduced, the bright spots in the figure become signifi- cantly brighter, the discontinuity at the edge of the spatial spectrum weakens, the energy leakage from the main lobe to the side lobe decreases, and the energy of the main lobe reaches its maximum. Figure 7 shows the point target image obtained from the two-dimensional inverse Fourier transform in the wave number domain in Figure 6. As can be seen from the figure, for point targets, the coronal imaging algorithm based on matched filtering based on wave number domain is very effective, and each target has obvious bright spots, which can clearly distinguish the position. In the image, the problem of energy broadening between the sidelobe and the main lobe is small, and
Feasibility Study on Damage Detection of Composite Materials Based on Millimeter Wave 51
most of the energy is concentrated in the coordinate of the point target. It can be seen that the matching filter imaging algorithm based on wave number domain is suitable for coronal plane imaging of the measured target.
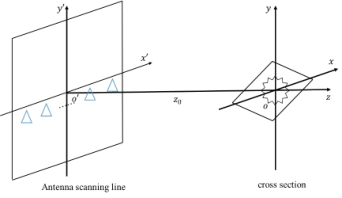
Two-Dimensional Cross Section Imaging Algorithm Two-dimensional cross section imaging is realized based on the echo signal of the target scanned by one-dimensional linear array antenna. The cross section describes the scattered signal distribution on the transverse and longitudinal combined planes of the measured target. Cross-sectional imaging requires one dimensional linear array antennas to transmit and receive signals one by one. The antenna scanning adopts the “one-step, one-stop” model, and the transmitted millimeter wave signal is the step frequency pulse signal with bandwidth. The imaging model is shown in Figure 8.
In the above two-dimensional cross-sectional imaging model, the antenna scanning point is located on the o′x′ axis, and the coordinate is set as (x′; z = z0), which constantly changes with the scanning process. (x, z; y = 0) is the coordinate of the measured point. The initial frequency of the transmit- ted stepping millimeter wave signal is f0, the frequency interval is 1f, and the maximum frequency is fmax. The reconstructed image function of the tar- get point is expressed as g(x, z; y = 0), and the echo signal received by the antenna scanning point is expressed as E(x′, k).
Where r is the distance between the target point and the scanning point. k = 4πfn/cis the constant multiple of the wave number vector of millimeter wave signal transmitted at the scanning point position. The cross-sectional imaging algorithm based on wave number domain analyses and processes the echo signal of the target point in the spatial domain, and converts the echo signal a of the target point into a one-dimensional spatial Fourier transform FT. The spatial spectral echo signal of the target point in the wave number domain is shown as follows.
E(x′, k)
Use orthogonal decomposition and the transfer processing
gf(kx, k z; y = 0) = Ef(kx, k) · exp(−jkzz0) (7) Use the two-dimensional Fourier transform and interpolation, and the image function g(x, y; z = 0) is expressed as
FT
E(x′k)
· exp(−jkzz0)
Stoltk→kz
The calculation steps of matched filter cross section imaging algorithm based on wave number domain are shown as follows Firstly, the target echo signal received by the transceiver antenna is tran- sformed into a two-dimensional Fourier transform in the spatial domain to obtain the spatial spectral signal of the target in the wave number domain. Then, the spatial spectral signal is compressed by matching the filter factor to obtain the spatial spectral signal of the target in the wave number domain. After interpolation, the data is transformed into uniformly distributed data. Finally, the two-dimensional inverse Fourier transform of the spatial spectral signal of the target is carried out to obtain the two-dimensional cross-section of the target image.
Two-Dimensional Cross Section Imaging Simulation Section 4.1.2 analyses and deduces the two-dimensional cross sectional algo- rithm based on wave number domain, and this section will analyse the imaging simulation experiment based on this algorithm. In the simulation experiment, millimeter wave stepping-frequency modulation signals with a central frequency of 35GHz and a bandwidth of 10GHz are adopted. The coordinates of each target point are (0.2, 0.2) (−0.2, −0.2) (0.2, −0.2), (−0.2, 0.2), (0.1, 0.1), (−0.1, −0.1), (0.1, −0.1), (0.1, −0.1), (0.1, −0.1), (0.1, −0.1), (0.1, −0.1), (−0.1, 0.1), (0,0). Parameters in the simulation program are shown in Table 2.
The imaging results of simulation experiment are shown in Figure 9 and Figure 10.
It can be seen from Figure 9 that the wave-number distribution before interpolation is uneven and presents a linear fan-shaped distribution, which is consistent with the theoretical results. When the window effect is introduced, the edge discontinuity is weakened and the energy intensity of the main lobe is increased. Figure 9 shows the comparison of simulation effects of point targets after interpolation. Before interpolation, the target points blur and
Table 2. Parameter settings of cross imaging simulation experiment.
Table available in the original PDF paper.
Parameter Value
0.5m
Signal central frequency 35GHz Signal bandwidth 10GHz Step frequency interval 10MHz Antenna sweep area 2m Imaging region 0.4m*0.4m Sampling number 501*1024 Sampling interval 4mm Distance between the scanning plane and the central of the measured target
Feasibility Study on Damage Detection of Composite Materials Based on Millimeter Wave 53
a) Initial data wavenumber distribution
b) Windowed wave number distribution
Figure 9: Wave number distribution in cross section.
a) Pre-interpolation imaging
b) Post-interpolation imaging
Figure 10: Target imaging comparison.
diverge, the energy of the main lobe is low, the energy of the main board is widened and the sidelobe drags seriously, and the position of each point can- not be clearly distinguished in the simulation image. After interpolation, the imaging effect becomes better and each target point becomes obviously clear. Although there are some problems of main lobe energy leakage and sidelobe shadow, the energy is mainly concentrated near the target point. It can be seen that the matching filter imaging algorithm based on wave number domain is also suitable for cross-sectional imaging of the measured target.
CONCLUSION
In this paper, the damage state detection system of composite materials based on millimeter wave is firstly proposed, including motion control module for mechanical scanning and radar imaging algorithm for image reconstruction. By controlling horn antenna and vector network analyser, the system radia- tes millimeter wave signals of specific frequency and waveform to composite materials. The vector network analyser stores the composite echo signal recei- ved by the horn antenna to the computer and carries out signal processing and image reconstruction.
Then, the motion control module is realized by using LabVIEW develo- pment software, data acquisition card, stepper motor driver and guide rail. The system can control the step motion and direction of the guide rail.
Finally, the radar imaging algorithm based on wave number domain is introduced, and the imaging simulation program of two-dimensional coro- nal plane and two-dimensional cross-section is written. The results show that the radar imaging algorithm based on wave number domain has a very good imaging effect on both coronal plane and cross section. In the simulation, the point target image has obvious bright spots, the main lobe energy is concen- trated, and the location of the target point can be clearly distinguished. The feasibility of damage detection of composite materials based on millimeter wave is effectively analysed and verified, which lays a foundation for the fur- ther development of millimeter wave non-destructive testing equipment for composite materials
REFERENCES
Huguenin G. Richard. (1994). Millimeter wave focal plane array imager. 2211 pp. 300–301. Ibrahim, M. E. (2014). Nondestructive evaluation of thick-section composites
and sandwich structures: A review. Composites Part A: Applied Science and Manufacturing, 64, 36–48. Jinshan Ding et al. (2013). THz 3-D Image Formation Using SAR Techniques: Simulation, Processing and Experimental Results. IEEE Transactions on Terahertz Science and Technology, 3(5), pp. 606–616. Ren, B., Li, S., Sun, H. J., Hu, W., & Lv, X. (2012). Modified cylindrical holo-
graphic algorithm for three-dimensional millimeter-wave imaging. Progress In Electromagnetics Research, 128, 519–537. Seung-Hwan Yang et al. (2013). Non-contact detection of impact damage in CFRP composites using millimeter-wave reflection and considering carbon fiber direction. NDT and E International, 57 pp. 45–51. Zhang Xiaoxuan et al. (2020). Broadband Millimeter-Wave Imaging Radar-Based
3-D Holographic Reconstruction for Nondestructive Testing. IEEE Transactions on Microwave Theory and Techniques, 68(3), pp. 1074-1085.
LISTED IN THE AHFE DIGITAL BOOKSTORE CATALOGUE
Explore the complete digital volume
Human-Centered Aerospace Systems and Sustainability Applications
Read this individual research paper free through the original publisher, or explore the full digital proceedings book.
ISBN 978-1-958651-74-2
Explore this ISBN in the AHFE Bookstore ↗Listed in the July 2026 bookstore catalogue; search by ISBN to confirm current availability · Digital book purchase optional