Carolina Díaz Piedra, Giulia De Cet, Alban Kuqi, M Jesus Caurcel, Rocio Fernandez- Mendez, Riccardo Rossi, Leandro Luigi Di Stasi (2023). Assessment of fitness to drive in elderly and cognitively impaired drivers: Adaptation of the Driving Observation Schedule to simulated environments. In: Application of Emerging Technologies. AHFE Open Access, vol. 115, pp. 449–459. https://doi.org/10.54941/ahfe1004343
We created a standardized assessment of fitness-to-drive in driving simulation environments through the adaptation of the Driving Observation Schedule (DOS; Vlahodimitrakou et al., 2013), which is a widely used instrument to assess “natural driving”. The Sim-DOS is an observational instrument that intends to overcome some of the practical limitations of the on-road assessment with dual control cars, in terms of safety, costs, and unpleasantness. Via expert consensus, the following was undertaken: (1) DOS behaviors were adapted to a simulated-based environment (signaling, observation of the environment, speed regulation, slow or unsafe reaction, distance interpretation, vehicle/lane positioning); (2) the Sim-DOS scores calculation, which is based on errors, was adapted from DOS to include hazard situations (HS) and free driving scores. The instrument was then piloted with a sample of 34 elderly drivers (70.9 ± 4.1 years old, 60% male, 46.1 ± 6.7 years of driving experience, 74% of them were regular drivers), along with the collection of simulator-produced data on number of harsh events and driving speed. Psychomotor skills of the majority were compromised, with only one participant being above the 80th percentile in the Reaction Times Test score of the Spanish mandatory driving assessment. Participants undertook two consecutive 20-minute long driving scenarios, with low and high traffic density (LTD, HTD). In each scenario, there were periods with and without potentially HS. Assessments were performed by two independent trained observers (intra-class correlation coefficients > 0.94). When exposed to HS, most participants (94.1%) did not perform well (more than nine minor errors), independent of traffic density, with average Sim-DOS HS scores of 12.70 ± 9.3. Compared to LTD scenarios, in HTD scenarios participants drove less smoothly, although slower (p-values<.05). The latter improved their ability to manage hazard situations, thus producing better than expected Sim-DOS scores. During free driving, participants drove more smoothly but performed worse under LTD conditions, driving at higher speed (p-values<.05). Our study provides a validated driving assessment tool for use in driving simulators that will allow for a safer, more ecologic, holistic and informative evaluation of the fitness-to-drive of older adults and patients with neurologic conditions.
Cognitive, motor, and sensory deficits, associated with aging, and with some neurological conditions such as acquired brain injury, may lead to severe impairment in driving performance (Bellagamba et al., 2020; Samuelsson et al., 2022). Moreover, aging and brain health are both risk factors for risky attitudes while driving (Leon-Dominguez et al., 2020), which is an important cause of road traffic accidents. A driver losing their ability to perform safe and competent maneuvers means that restrictions will likely be placed on their license, or their license could even be revoked. This can have a great impact on many communities and professionals, in whom a personal vehicle is essential to connect people and places. While rehabilitation and driver assistance tech- nologies may improve driving performance (Classen et al., 2019; Unsworth and Baker 2014), the assessment of the actual fitness-to-drive of these people is challenging. Office-based neuropsychological and physical tests are con- sidered insufficient to understand a person’s ability to drive (Toups et al., 2019). The current gold standard to assess the full range of abilities needed for safe driving is the on-road assessment with dual control cars (Dickerson et al., 2014). To date, several on-road assessment tools have been developed, the Driving Observation Schedule (DOS; Vlahodimitrakou et al., 2013) being one of the most widely used tools. It was designed to measure potential violations of road safety rules among elderly drivers. The DOS allows the observation of ‘natural’ driving, without the intervention of an examiner, in familiar routes, as chosen by the evaluated person. The assessment can be completed in about 25–30 minutes, and it rates specific behaviors related to driving safety. Previous studies, assessing driving behavior in elderly drivers (Mazer et al., 2021) and in special populations such as adults with traumatic brain injury (Stolwyk et al., 2019), have demonstrated appropriate ecolog- ical validity, and both inter-rater and absolute reliability. While on-road assessments tools are superior in ecological validity, they may be expensive, stressful, and potentially unsafe (Bellagamba et al., 2020). Valid, safe, more accurate, and more cost-effective solutions for standardized assessment of fitness-to-drive are currently needed.
Modern driving simulators are an alternative solution that offer key advan- tages over previous options, such as the possibility of exposing drivers to several relevant driving scenarios, including hazard situations, and being able to assess their driving performance without being physically at risk, in a con- trolled and standardized manner (Campos et al., 2017). They also allow the acquisition of driving data that is impossible to record through mere obser- vation, such as elevated gravitational force events (EGFE), which is one of the main indicators of risky driving and of a higher probability of getting a road accident (Rossi et al., 2021). Among its main shortcomings are the poten- tial need for specialized data processing skills or simulation expertise for the extraction and direct interpretation of simulator-produced data. To over- come this, we have developed an easy-to-use, pencil-and-paper instrument that is an adaptation of the DOS to simulated-based environments (here- inafter Sim-DOS to differentiate it from the on-road DOS). The goal of the
Assessment of Fitness-to-Drive in Elderly and Cognitively Impaired Drivers 451
work reported here was to introduce the new instrument and to characterize simulated driving performance in elderly drivers using the Sim-DOS.
METHODS
Experimental Design A within-subjects design was implemented were all participants were exposed to the same type of experimental session. The session consisted of two consec- utive driving scenarios, with two different traffic densities (Traffic densities [TD]: Low [L] vs. High [H]), each having a duration of 20 minutes. In each scenario, some periods involved potentially hazard situations, and some were hazard-free. The sequential order of the scenarios followed a counterbalanced between-subjects basis. The main dependent variables were the Sim-DOS scores, the overall number of harsh events experienced, and average cruising speed (Km/h).
Participants Thirty-four participants took part in the experiment (mean age = 70.9 years; standard deviation [SD] = 4.1, age range: 66–82 years; 60% male). All par- ticipants held a valid driving license, having had it for more than 45.0 years on average (range: 25–62 years), and all of them had normal or corrected to normal vision. Participants reported a mean annual car driving mileage of ∼6,885.3 kilometers [km]; SD = 7,466.4 (range: ∼0.0 – 33169 km/year). Psychomotor skills of the majority were compromised, with only one par- ticipant being above the 80th percentile score of the Reaction Times Test of the Spanish national mandatory driving assessment. All participants were refunded for their time.
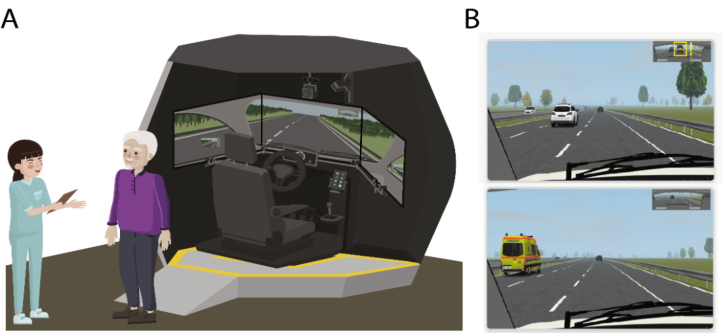
Instruments and Materials Driving Simulator and Scenarios We used a semi-dynamic driving simulator (Nervtech™, Ljubljana, Slove- nia) running SCANeR studio software (AVSimulation, Boulogne-Billancourt, France; v. DT 2.5, see Figure 1). For further information on the features of the simulator, see Gianfranchi and Di Stasi, 2021. We developed two virtual highway scenarios of ∼20 minutes (min) each, with different traffic densities (low vs. high: 32 vs. 63 vehicles, in addition to the participant). Each of the two scenarios included (overall) a series of 5–7 designated potentially risky situations (hereinafter, designated hazard situations [HS]; e.g., vehicles that entered the scene from different sides). The situations were all time-locked and followed a predetermined, scenario-specific order. The time intervals between designated HS were without potential hazards and therefore defined as hazard-free situations. After each scenario, to avoid any potential fatigue effect due to the time on task (Di Stasi et al., 2012; Morales et al., 2017), the vehicle was set in automated driving for ∼10 min so that participants could rest from the driving task.
We considered two driving performance metrics: elevated gravitational- force events (EGFE or harsh events) and the average driving speed. We
defined “EGFE” as rapid ac/decelerations events consisting of a time-frame 1 second over or below the acceleration or deceleration thresholds of 3g or - 4g, respectively (Rossi et al., 2021). We considered driving speed as it is often taken as a measure of a driver’s willingness to expose themselves to the risk of an accident (Wasielewski, 1984).
Figure 1: Left) Cartoon depicting the driving simulator used for the study. It is located inside a dedicated octagonal dome with an integrated rotating and reclining seat, an HD triple-screen set up, and surround-sound speakers. The whole set-up is placed on a customized four degree-of-freedom motion platform. To record driver’s behav- iors inside the simulator, we used a dedicated video camera located above the central screen. Right) Screenshots showing examples of one of the potentially risky situations a driver could face. In the examples, the driver hears a siren and can see an ambulance approaching them on the central rearview mirror (top image). Subsequently, the driver sees the ambulance overtaking them (bottom image). Note: The yellow box around the ambulance (in the rearview mirror) is displayed only for graphic purposes.
Adapted Driving Observation Schedule (Sim-DOS) Experts in occupational therapy, driving simulation, neuropsychology, and clinical and traffic psychology were invited, over several sessions, to define and evaluate possible adaptations of the on-road DOS observable behaviors, to a simulated-based environment. Via expert consensus, relevant maneuvers and behaviors that would be required in each designated potentially risky situations were selected: signaling, observation of environment, speed reg- ulation, distance interpretation, and vehicle/lane positioning. Based on the review of other on-road assessment tools (e.g., Ott et al., 2012), and con- sidering the idiosyncrasies of our driving scenarios (i.e., highway), slowness or unsafe reactions when changing lanes or during potentially risky situa- tions were added. For the designated HS situations, each error was classified as either minor (i.e., maneuver inappropriately performed but without seri- ous consequences, 1 point) or critical (i.e., inappropriate behavior close to or causing a traffic accident, 2 points). We computed the observed driving performance score by adapting the original on-road DOS rating formula, as shown in the equation below:
Assessment of Fitness-to-Drive in Elderly and Cognitively Impaired Drivers 453
That is, from an overall score of 100, we subtracted the following: the number of appropriate behaviors (out of the number [#] of the assessed behaviors) minus the sum of weighted minor and critical errors, all of which was divided by the number of assessed behaviors (a series of pre-defined maneuvers/actions needed to safely engaged the situation) and multiplied by 100. Note, if the driver underwent the designated situations without errors, appropriate behaviors and assessed behaviors values (i.e., number [#]) coin- cided, and then the obtained total error score was 0. Consequently, higher scores indicate worse performance.
For the time intervals with hazard-free situations (i.e., no risky situations presented), we followed the same scoring criteria (minor errors, 1 point; criti- cal errors, 2 points) and we computed the sum of errors (see formula 2 below). Higher scores indicate worse performance.
Procedure We conducted the study following the guidelines of the Andalusian Biomedical Research Ethics Committee (approval #1422-N-21). Participants attended two different evaluation sessions (∼1 hour each), both in the morn- ing. During the first session, participants signed the study consent form, filled in the sociodemographic and driving habits questionnaires, completed a psycho-technical driver assessment (Asde Driver test N-845®, General ASDE SA, Valencia, Spain; data not shown) and had an individual training ses- sion on the driving simulator. During the second session, after receiving a summary of the training, participants undertook the two driving scenar- ios (with low and high traffic densities). They were instructed to drive as they would if they were on real conditions, while aiming to comply with usual traffic rules (speed limit 130 km/h). The recorded driving session was divided into 5-min recordings and presented to two independent and trained judges. Judges watched the recordings through a dedicated software called HADRIAN’S Eye (Di Stasi et al., 2023). Then, they spotted and annotated any errors observed during both the designated HS and hazard-free situations using the Sim-DOS. Finally, differences between both judges’ scores, for every situation and maneuver in each participant, were calculated. A third judge resolved specific major disagreements (≥2 points of differences between over- all scores). The latter happened in 1.16% of the items, resulting in intra-class correlation coefficients above 0.94. Finally, individual Sim-DOS scores were computed using the average scores of both judges.
Data Analysis To examine the differences in the Sim-DOS scores and driving performance data (EGFE and average speed) between HTD and LTD scenarios, we per- formed paired samples t tests and Wilcoxon’s signed-ranks tests. We carried
out a single-sample t test to describe the drivers’ performance (across all experimental conditions) as evaluated by the Sim-DOS. The reference value was the ideal safety threshold necessary to pass the official driving examina- tion in Spain to get a driving license for a category B vehicle (EEA classifi- cation), allowing up to 9 minor errors (without considering the presence of major [critical] faults).
RESULTS
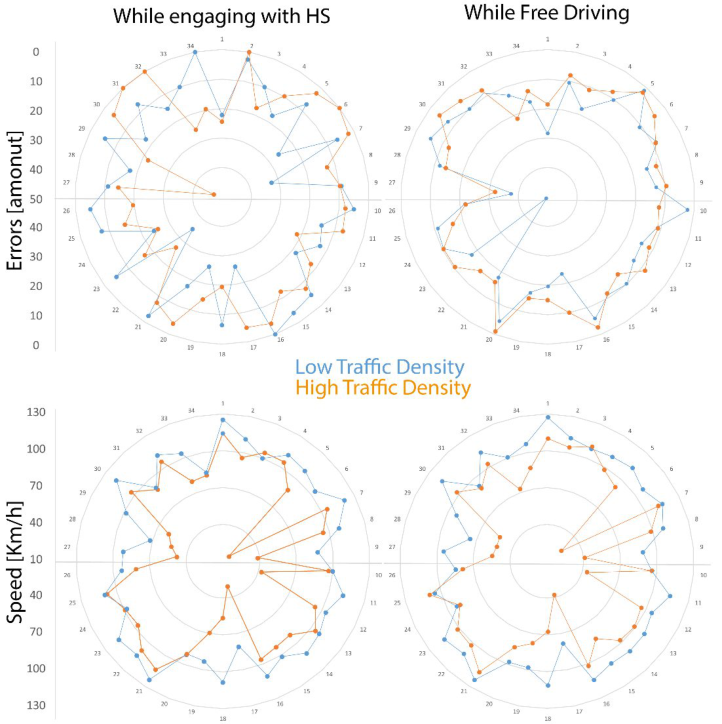
Overall driving performance was unsatisfactory in all drivers (Table 1, Figure 2). When exposed to hazard situations, most of the participants (94.1%) did not perform well, independent of traffic density. They demon- strated a poor-developed sense of vehicle control, coordination, and knowl- edge, with average ± SD Sim-DOS scores of 87.1 ± 9.7 (out of 100, t-values > 7.3, p-values <.05). Compared to LTD scenarios, in HTD scenarios par- ticipants drove less smoothly, having a higher average number of harsh events (HTD: 0.97 ± 1.24 vs. LTD: 0.33 ± 0.58 average ± SD number of harsh events, Z = 3.1, p <.05). However, they also drove slower (HTD: 82.41 ± 27.43 vs. LTD: 103.55 ± 14.61 km/h, t = 5.2, p <.05), which improved their ability to manage hazard situations, and therefore produced lower than expected Sim-DOS scores (HTD: 12.94 ± 10.28).
During hazard-free situations, participants performed worse under LTD conditions (Sim-DOS-FD scores: HTD: 11.68 ± 6.20 vs. LTD: 14.40 ± 9.58, t = 2.15, p <.05) and drove at a higher speed (HTD: 85.01 ± 24.28 vs. LTD: 104.70 ± 11.94 km/h, t = 5.8, p <.05). On the other hand, they did it more smoothly (HTD: 1.94 ± 3.74 vs. LTD: 0.45 ± 0.74 average ± SD number of harsh events, Z = 2.65, p < .05).
Table 1. Descriptive data and differences by low versus high traffic density conditions on the simulator-adapted driving observation schedule (Sim-DOS) scores and driving performance data.
Table available in the original PDF paper.
Variables Low traffic High traffic 12.72, 10.00, (9.32) 12.94, 12.20, (10.28) M, Median, (SD) Sim-DOS Scores (0-100) (designated HS)
14.39, 12.00, (9.59) 11.68, 11.25, (6.20)
Errors* (hazard-free situations)
0.33, 0.00, (0.89) 0.97, 1.00, (1.24)
Driving performance
Overall number of EGFE* (designated HS)
0.45, 0.00, (0.74) 1.94, 0.50, (3.74)
Overall number of EGFE* (hazard-free situations)
103.56, 102.74, (14.61) 82.42, 82.27, (27.44)
Overall average speed** (km/h, designated HS)
104.71, 107.93, (11.94) 85.02, 93.37, (24.29)
Overall average speed** (hazard-free situations) Note. EGFE = elevated gravitational-force events; HS = hazard situations; M = mean; SD = standard deviation.
Assessment of Fitness-to-Drive in Elderly and Cognitively Impaired Drivers 455
Figure 2: Sim-DOS and speed cruising results. Polar graphs present the scores obtained at Sim-DOS (upper row) and the average cruising speed (lower row) of each participant (n = 34) at each traffic density level (high vs low). The left polar axes rep- resent driving engaging with hazard situations. The right polar axes represent the hazard-free situations. In the average cruising speed scale (lower row), the vertical axis values range from the outer circle, 130 km/h (speed limit) to the pole, 10 km/h (lowest speed). In the Sim-DOS scale, in the vertical axis values range from the outer circle, 0 (perfect execution) to the pole, 50 (∼max score in the sample). In all graphs, in the polar axis, each participant is represented clockwise, from 1 to 34. The orange line represents scenarios with high traffic density while the blue line represents scenarios with low traffic density.
DISCUSSION
Our results show that the Sim-DOS is a valid and highly reliable comple- mentary tool for driving assessment among elderly drivers. The tool will be useful for the detection of specific errors and therefore key to plan the driving re-training or rehabilitation for a particular driver.
When exposed to hazard situations, most participants did not perform well, independent of traffic density. It is well established that driving skills deteriorate with age (e.g., Lee et al., 2003). The reasons behind that include cognitive and sensory impairments that would lead to recognition
errors (e.g., failure to recognize situations or distances) and decision errors (e.g., speed errors or inappropriate braking or accelerations). These errors are key to road safety (Ahmad et al., 2021; Khattak et al., 2021) and thoroughly assessed in the Sim-DOS.
Beyond aging, traffic density can also influence driving behavior (Michaels et al., 2017). In line with this, in our study, scenarios with a higher traffic density, participants drove less smoothly. However, they also drove at a lower speed, which made it possible for them to be able to manage hazard situations efficiently, and therefore producing better than expected driving performance. During hazard-free situations, on the other hand, par- ticipants performed worse under lower traffic density conditions because they drove at higher speed, although they did it more smoothly. It seems that drivers’ behavioral self-regulation may explain this apparently coun- terintuitive results. That is, when drivers perceive an increased presence of hazards, or a discrepancy between the demands of the environment and their own abilities, they may self-regulate their behavior to adapt to the environ- ment and decrease the likelihood of accident (Paire-Ficout et al., 2021). Such self-regulation is achieved by performing compensatory behaviors such as avoiding high-speed roads, traffic congestion, bad weather or, more likely in simulation cases, driving more carefully when they perceive more difficulties, feel insecure or uncomfortable (Dykstra et al., 2020), as occurs with high- traffic conditions (Feng et al., 2018). Thus, the displayed behaviors are likely to be those with which the elderly driver feels more confident and, conse- quently, would be related to fewer errors. A higher number of EGFE were observed while participants were driving under higher traffic density con- ditions, which could be explained by the so-called stop-and-go phenomenon (while mimicking the behavior/trajectory of the lead vehicle in front, Yeo and Skabardonis 2009). This plausible explanation is supported by the average speed differences, where a significantly lower average speed was observed in the high-traffic conditions compared to that in low-traffic conditions. These data may also reflect the tendency to queue, foregoing or decreasing over- taking behaviors, and therefore may, in part, explain the reduced chances of making driving errors in such high-traffic conditions. This could also be considered as the consequence of a self-regulatory behavior, because they avoided performing certain maneuvers in conditions they perceived as riskier (Dykstra et al., 2020).
CONCLUSION
Our results suggest that the Sim-DOS can provide a complementary, sen- sitive and non-invasive measure of fitness-to-drive among elderly drivers. The Sim-DOS is able to assess the appropriateness of driving behaviors per- formed in simulated scenarios, allowing for quantifiable scores of driving performance and change during interventions. This means that error scores in designated HS situations can help practitioners to detect specific perfor- mance deficiencies that could be targeted for driving re-training. Also, our findings indicate that older adults self-regulate their behavior in conditions they perceive as threatening or challenging, such as high-traffic environments,
Assessment of Fitness-to-Drive in Elderly and Cognitively Impaired Drivers 457
leading them to make less driving errors that could be expected. The Driving Observation Schedule for driving simulators (Sim-DOS) is a complementary driving assessment tool that will allow a low-cost, safer, more ecologic, and holistic evaluation of the fitness-to-drive of elderly drivers and patients with neurological conditions.
ACKNOWLEDGMENT
This work was supported by a FEDER/Andalusian Government-Consejería de Transformación Económica, Industria, Conocimiento y Universidades grant (Grants for research, development, and innovation activities to the public agents of the Andalusian System of Knowledge, Ref. PY20_00905) awarded to Carolina Diaz-Piedra. Authors thank Dr. E. Gianfranchi, Dr. M. Costa-Fernandez and Dr. M. Velez for their contributions to the early version of the manuscript and data pre-processing. Authors also thank F. Angioi, C. González, I. Blazquez, and A. Serrano for their help during data collection. Finally, the authors are very grateful to Dr. E. Mirabet, Spanish Society of Medicine of Traffic for his help, and CEO V. Docavo, General ASDE SA for his continued support.
REFERENCES
Ahmad, N., Wali, B., Khattak, A. J. and Dumbaugh, E., 2021. Built environment, driving errors and violations, and crashes in naturalistic driving environ- ment. Accident Analysis & Prevention, 157, p. 106158. Bellagamba, D., Vionnet, L., Margot-Cattin, I. and Vaucher, P., 2020. Standardized
on-road tests assessing fitness-to-drive in people with cognitive impairments: A systematic review. PLoS ONE, 15(5), p. e0233125. Campos, J. L., Bédard, M., Classen, S., Delparte, J. J., Hebert, D. A., Hyde, N., Law, G., Naglie, G. and Yung, S., 2017. Guiding framework for driver assessment using driving simulators. Frontiers in Psychology, 8, p. 1428. Classen, S., Jeghers, M., Morgan-Daniel, J., Winter, S., King, L. and Struckmeyer, L.,
2019. Smart in-vehicle technologies and older drivers: a scoping review. OTJR: Occupation, Participation and Health, 39(2), pp. 97–107. Di Stasi, L. L., Aloui, S., Prat, C., Costa-Fernandes, M., Angioi, F., Sodnik, J. and Diaz-Piedra C., 2023. HADRIAN’S EYE: a video analysis tool to coding drivers’ mannerisms and behaviours in simulated settings. Poster presented at Human Fac- tors and Ergonomics Society, Europe Chapter, 2023 scientific meeting. Available at: https://www.hfes-europe.org/posters-2023/ Di Stasi, L. L., Renner, R., Catena, A., Canas, J. J., Velichkovsky, B. M. and Pan-
nasch, S., 2012. Towards a driver fatigue test based on the saccadic main sequence: A partial validation by subjective report data. Transportation Research Part C: Emerging Technologies, 21(1), pp. 122–133. Dickerson, A. E., 2014. Screening and assessment tools for determining fitness to drive: a review of the literature for the pathways project. Occupational Therapy in Health Care, 28(2), pp. 82–121. Dykstra, C., Davis, J. J. and Conlon, E. G., 2020. Tactical and strategic driving
behaviour in older drivers: The importance of readiness to change. Accident Analysis & Prevention, 141, p. 105519. Feng, J., Choi, H., Craik, F. I., Levine, B., Moreno, S., Naglie, G. and Zhu, M., 2018.
Adaptive response criteria in road hazard detection among older drivers. Traffic Injury Prevention, 19(2), pp. 141–146.
Gianfranchi, E. and Di Stasi, L. L., 2021. Results and Demonstrators of WP2 studies.
Final version as of 31.05.2021 of deliverable D2.3 of the HORIZON 2020 project HADRIAN. EC Grant agreement no: 875597, ViF: Virtual Vehicle Research GmbH, Graz, Austria. https://hadrianproject.eu/wp-content/uploads/2021/09/Vi deo-D2.3-Results-and-Demonstrators-of-WP2-Studies_f.mp4 Khattak, A. J., Ahmad, N., Wali, B. and Dumbaugh, E., 2021. A taxonomy of driving errors and violations: Evidence from the naturalistic driving study. Accident Analysis & Prevention, 151, p. 105873. Lee, H. C., Cameron, D. and Lee, A. H., 2003. Assessing the driving performance
of older adult drivers: on-road versus simulated driving. Accident Analysis & Prevention, 35(5), pp. 797–803. León-Domínguez, U., Solís-Marcos, I., López-Delgado, C. A., y Martín, J. M. B.
and León-Carrión, J., 2020. A frontal neuropsychological profile in fitness to drive. Accident Analysis & Prevention, 148, p. 105807. Mazer, B., Chen, Y. T., Vrkljan, B., Marshall, S. C., Charlton, J. L., Koppel, S. and Gelinas, I., 2021. Comparison of older and middle-aged drivers’ driv- ing performance in a naturalistic setting. Accident Analysis & Prevention, 161, p. 106343. Michaels, J., Chaumillon, R., Nguyen-Tri, D., Watanabe, D., Hirsch, P., Bellavance,
F., Giraudet, G., Bernardin, D. and Faubert, J., 2017. Driving simulator scenarios and measures to faithfully evaluate risky driving behavior: A comparative study of different driver age groups. PloS ONE, 12(10), p. e0185909. Morales, J. M., Díaz-Piedra, C., Rieiro, H., Roca-González, J., Romero, S., Catena, A., Fuentes, L. J. and Di Stasi, L. L., 2017. Monitoring driver fatigue using a single-channel electroencephalographic device: A validation study by gaze-based, driving performance, and subjective data. Accident Analysis & Prevention, 109, pp. 62–69. Ott, B. R., Papandonatos, G. D., Davis, J. D. and Barco, P. P., 2012. Naturalis-
tic validation of an on-road driving test of older drivers. Human Factors, 54(4), pp. 663–674. Paire-Ficout, L., Lafont, S., Hay, M., Coquillat, A., Fabrigoule, C. and Chavoix, C., 2021. Relationships between cognitive and driving self-awareness in older drivers. The Journals of Gerontology: Series B, 76(6), pp. 1077–1085. Rossi, R., Tagliabue, M., Gastaldi, M., De Cet, G., Freuli, F., Orsini, F., Di Stasi,
L. L. and Vidotto, G., 2021. Reducing Elevated Gravitational-Force Events through visual feedback: a simulator study. Transportation Research Procedia, 52, pp. 115–122. Samuelsson, K., Lundqvist, A., Selander, H. and Wressle, E., 2022. Fitness to drive after acquired brain injury: Results from patient cognitive screening and on- road assessment compared to age-adjusted norm values. Scandinavian Journal of Psychology, 63(1), pp. 55–63. Stolwyk, R. J., Charlton, J. L., Ross, P. E., Bédard, M., Marshall, S., Gagnon, S.,
Gooden, J. R. and Ponsford, J. L., 2019. Characterizing on-road driving perfor- mance in individuals with traumatic brain injury who pass or fail an on-road driving assessment. Disability and Rehabilitation, 41(11), pp. 1313–1320. Toups, R., Chirles, T. J., Ehsani, J. P., Michael, J. P., Bernstein, J. P., Calamia, M., Parsons, T. D., Carr, D. B. and Keller, J. N., 2022. Driving performance in older adults: current measures, findings, and implications for roadway safety. Innova- tion in Aging, 6(1), p. igab051. Unsworth, C. A. and Baker, A., 2014. Driver rehabilitation: A systematic review
of the types and effectiveness of interventions used by occupational thera- pists to improve on-road fitness-to-drive. Accident Analysis & Prevention, 71, pp. 106–114.
Assessment of Fitness-to-Drive in Elderly and Cognitively Impaired Drivers 459
Vlahodimitrakou, Z., Charlton, J. L., Langford, J., Koppel, S., Di Stefano, M., Macdonald, W., Mazer, B., Gélinas, I., Vrkljan, B., Porter, M. M. and Smith, G. A., 2013. Development and evaluation of a Driving Observation Schedule (DOS) to study everyday driving performance of older drivers. Accident Analysis & Prevention, 61, pp. 253–260. Wasielewski, P., 1984. Speed as a measure of driver risk: Observed speeds ver-
sus driver and vehicle characteristics. Accident Analysis & Prevention, 16(2), pp. 89–103. Yeo, H. and Skabardonis, A., 2009. Understanding stop-and-go traffic in view of asymmetric traffic theory. In Transportation and Traffic Theory 2009: Golden Jubilee: Papers selected for presentation at ISTTT18, a peer reviewed series since 1959 (pp. 99–115). Boston, MA: Springer US.
LISTED IN THE AHFE DIGITAL BOOKSTORE CATALOGUE
Explore the complete digital volume
Application of Emerging Technologies
Read this individual research paper free through the original publisher, or explore the full digital proceedings book.
ISBN 978-1-958651-91-9
Explore this ISBN in the AHFE Bookstore ↗Listed in the July 2026 bookstore catalogue; search by ISBN to confirm current availability · Digital book purchase optional