Jason Thai, Carolina Díaz Piedra, Leandro Luigi Di Stasi, Sašo Tomažič, Kristina Stojmenova, Jaka Sodnik (2023). Can We Distinguish Driver’s Age Based on Their Eye Movements?. In: Emerging Technologies in Healthcare and Medicine. AHFE Open Access, vol. 116, pp. 394–403. https://doi.org/10.54941/ahfe1004394
In this paper we present a study aimed at distinguishing elderly (over 65 years) and young (under 25) participants in driving environment by observing solely their eye movements. Selected groups of elderly and young drivers were asked to drive 30 km on suburban, urban and regional roads in a high-fidelity motion-based driving simulator. During the drive their gaze behaviour and eye movements were recorded using the Tobii Pro Glasses 2 eye tracker, providing data on gaze position, blink rate and pupil size. The data was processed with the PyGaze library, which was adapted to be compatible with the Tobii Pro data output format. In the next step, a decision tree-based binary classification method was applied to distinguish between the two age groups based solely on their eye movements and pupillary responses. The machine learning approach showed an overall accuracy of 0.8 which means that eye tracking data can be a very good predictor of driver’s age in a driving environment.
In this research, our primary objective was to address gaps in the literature concerning the use of eye tracking data to distinguish drivers by age, specifi- cally focusing on identifying pupillometry differences between young (under 25) and elderly (over 65) drivers. We aimed to achieve this with thorough analysis of drivers gaze behaviour and pupillometric responses, as indicated by Mahanama et al. (2022). Past research results have revealed that pupillom- etry data can be used to distinguish between test subjects of different age. For example, prior studies have explored differences between elderly and younger subjects in areas like eye movement characteristics and fatigue development (Marandi et al., 2018), as well as visual attention during unconventional TV advertising formats (Carrasco, 2011). However, there is not any available lit- erature focusing on using pupilometry data in driving. This motivated us to investigate whether significant ocular disparities can be observed in drivers.
Can We Distinguish Driver’s Age Based on Their Eye Movements? 395
We collected eye-tracking data in the compact motion-based driving sim- ulator to calculate fixations, saccades and blinks using PyGaze - a specific Python library (PyGaze, 2015). Our main research question was if it possi- ble to determine whether drivers of different age groups exhibit significantly different eye movements and pupillometric responses, and whether driver age can be predicted solely by observing their ocular behavior. We applied selected comparative statistical tests and machine learning classifiers on the collected eye tracking data to assess significant differences between these two groups of drivers (Tarnowski et al., 2020).
METHODOLOGY
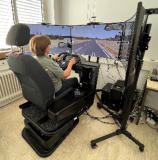
Data Collection The study was carried out in a simulated driving environment using a Nervtech compact motion-based driving simulator (Vengust et al., 2017) at University of Ljubljana, Faculty of Electrical Engineering. The simulator is equipped with real car parts such as a driver’s seat, steering wheel and pedals, and has a physical dashboard mimicking a typical manually-driven personal vehicle. The dashboard displays information such as vehicle speed, RPM, fuel level, status of gauges and different warning messages. Images of the driving environment are displayed on three 49-inch curved TVs, offering a 145
field of view (Figure 1).
Figure 1: Driving simulator set-up and participants in the study equipped with Tobii 2 Glasses eye tracker.
The driving simulation scenario includes 30 km of different roads which takes approximately 22 minutes to complete (if speed limits are respected). It begins in a suburban environment with numerous junctions and low traf- fic density. It continues on to the countryside with higher speed limits, the presence of wildlife and sometimes aggressive drivers. The final part of the journey takes place in a small-town road environment with higher traffic density including pedestrians and bikers and it ends with a simulated stop at a gas station to (virtually) refuel the vehicle. Throughout the scenario, the driver must be attentive to road signs and other road users to avoid collisions and reach the final destination safely.
The eye gaze and pupillometry data was recorded with the Tobii Pro Glasses 2 (Tobii, 2023) which measures gaze position on the driving screen and pupil diameter with a sampling frequency of 50 Hz.
Study Protocol The study protocol used in this evaluation was structured as follows:
Reading instructions: Each participant received a detailed description of the study procedure and the tasks to be carried out. Instructions were provided in written form to ensure that all participants received the same amount of information in a consistent manner;
Informed consent: Before taking part in the study, participants were asked to sign an informed consent form. This document conformed to the Uni- versity of Ljubljana’s informed consent model for studies involving human participants;
Demographic questionnaire: Participants completed a demographic questionnaire;
Simulator familiarization: Before starting the study tasks, participants were given the opportunity to familiarize themselves with the driving sim- ulator. They also performed a calibration of the biometric sensors used during the experiment, to ensure accurate measurements;
Driving tests: Participants carried out the main driving test;
User experience questionnaire: Participants completed a questionnaire evaluating their user experience.
It is important to note that participation in the study was voluntary, and participants were informed that they could stop the experiment at any time without having to provide an explanation. As a thank-you for their participation, each participant received a voucher worth €10.
Study Variables In our study the driver’s age was the main independent variable. As mentioned previously, we observed participants from two distinct groups: young drivers (under 25 years) and elderly drivers (over 65 years).
The following eye movement and pupillometry responses represented the dependent variables of our study:
Nb (Number) Fixations: Total number of eye fixations during the driving experiment. A fixation occurs when the driver’s gaze remains relatively stable on a specific point for a certain period of time;
Avg (Average) Fixation Duration: This measures how long the driver maintains his gaze on a fixed point;
Min Fixation Duration: This indicates the shortest period during which the driver maintained his gaze on a fixed point;
Max Fixation Duration: Maximum duration of fixations. This indicates the longest period during which the driver maintained his gaze on a fixed point;
Nb Saccades: Total number of eye saccades during the driving experience;
Avg Saccade Duration: This measures how long it takes the driver to make an eye movement from one point to another;
Min Saccade Duration: It indicates the shortest period of time needed to perform an eye movement from one fixation to another;
Can We Distinguish Driver’s Age Based on Their Eye Movements? 397
Max Saccade Duration: This indicates the longest period needed to perform an eye movement from one fixation to another;
Average velocity: Average speed of saccades;
Average acceleration: This measures how quickly the driver’s gaze changes speed during eye movements;
Nb Blinks: Total number of blinks during the driving experience. A blink occurs when the driver briefly closes his eyes;
Avg Blink Duration: This measures how long the driver briefly closes the eyes during the blink;
Min Blink Duration: This indicates the shortest period of time during which the driver briefly closes the eyes when blinking.
Data Processing The recorded eye-tracking data contain gaze coordinates on the simulators’ screen accompanied by corresponding timestamps. We used PyGaze library in combination with the Python version 2.7 and Jupyter Notebook (Jupyter Notebook, 2014). To adapt the library to our specific needs, we had to make some custom adjustments. This also involved developing additional code to read our data files and extract the relevant ocular information. The main tasks carried out in the above-mentioned environment were detection of fix- ations and saccades, detection of blinks and also calculation of different eye movement velocities as described in the previous section. More information on these processing techniques is available here (Thai, 2023).
ANALYSIS AND INTERPRETATION OF RESULTS Comparative Statistics
The results of our study revealed significant differences in pupillometric vari- ables (Skaramagkas, 2021) between young and elderly drivers. We used appropriate statistical tests, such as Student’s t-test for parametric data and Wilcoxon-Mann-Whitney (Data Analytics, 2022) test for non-parametric data, to assess the statistical significance of these differences and to distin- guish driver age groups.
Firstly, we observed that the average duration of saccades was significantly (p < 0.05) shorter in younger drivers (M = 0.03) compared to elderly drivers (M = 0.045). This suggests greater agility in eye movements and an increased ability to move the gaze rapidly from one point to another in young drivers.
In addition, we found that the maximum duration of saccades was signif- icantly (p < 0.05) shorter in younger drivers (M = 0.72 vs. M = 1.43). This highlights the greater speed and amplitude of eye movements in this group of drivers.
We also observed a significant (p < 0.01) difference in the minimum dura- tion of fixations between young (M = 0.03) and elderly (M = 0.093) drivers. Younger drivers tend to hold their gaze on one point for a shorter period before moving on to another point of interest. This observation suggests an enhanced ability to rapidly process visual information and make quick decisions while driving in young drivers.
Finally, we found that the average duration of eyelid blinks was signif- icantly (p < 0.1) shorter in young drivers (M = 0.34 vs M = 0.44). This indicates a higher blink frequency in this group, which may be associated with better corneal lubrication and protection against dry eye.
Machine Learning For the analysis based on the machine learning part, we selected classification decision trees, because of their interpretability, their ability to handle non- linear data and to deal with missing data. These trees enabled us to make a binary prediction of whether a subject was young or old, based on the oculo- metric metrics identified. Logistic regression methods were also considered, but later discarded due to small sample size and characteristics of our data (Decision Trees, 2023).
Creation of the Model First, we imported the data from a CSV file containing the metrics obtained using PyGaze. Next, we divided the data into two parts: features (X) and labels (y). The unnecessary columns “index” and “Age” were excluded from the features. The “Age” column contains one of the two possible labels (“YOUNG” or “OLD”) and serves as the target variable we wanted to predict using our machine learning model.
The tree learning process encompasses the segmentation of data based on eye-tracking metrics, creating distinct subgroups that correspond to spe- cific age group. At each node of the tree, features (X) are utilized to make partitioning decisions, leading to the formation of well-defined subgroups. Subsequently, the performance and efficiency of the tree in predicting driver age are evaluated using labels (y), represented by the “Age” column in our case.
In the next step we separated the data into training and test sets using the train_test_split function, where training data represented 80% of the total dataset and test data represented the remaining 20%.
To find the best hyperparameters for our model, we performed a grid search (GridSearchCV). We defined a grid of values for hyperparameters such as the maximum tree depth (max_depth), the minimum number of samples required to split a node (min_samples_split) and the minimum number of samples required in a leaf (min_samples_leaf). GridSearchCV explored all possible combinations of hyperparameters and selected the best values that gave the highest performance.
Once the best hyperparameters had been identified, we trained our Deci- sionTreeClassifier model on the training data. Using this trained model, we made predictions on the test data and calculated the accuracy of the model by comparing the predictions with the actual labels. We obtained an accuracy of 80.00%, indicating that our model succeeded in correctly predicting age type (which is either OLD or YOUNG as said earlier) in 80% of cases on the test set.
Can We Distinguish Driver’s Age Based on Their Eye Movements? 399
Evaluation of the Model Following the standardized approach for binary classifications, we evalu- ated the performance of our mode using confusion matrices. They show the number of correct and incorrect predictions made by the model.
For the learning results, the confusion matrix shows that out of a total of 20 samples, 9 were correctly predicted as young subjects and 9 were cor- rectly predicted as elderly subjects. There was one erroneous prediction for each class, where a young subject sample was incorrectly classified as elderly subject, and vice versa. The confusion matrix is shown in Table 1.
Table 1. Confusion matrix for training set in age comparison with decision tree model.
Table available in the original PDF paper.
Old prediction Young Prediction Old 9 1 Young 1 9
For the validation results, the confusion matrix indicates that out of a total of 5 samples, 2 were correctly predicted as young subjects and 2 were correctly predicted as elderly subjects. There was one erroneous prediction, where an old subject sample was incorrectly classified as young subject. The confusion matrix is shown in Table 2.
Table 2. Confusion matrix for test set in age comparison with decision tree model.
Table available in the original PDF paper.
Old prediction Young Prediction Old 2 1 Young 0 2
Classification reports provide a more detailed analysis of model perfor- mance. They include measures of precision, recall and F1 score for each class, as well as overall precision, overall recall and overall F1 score. Indeed, you can see the reports for training and validation sets in Table 3 and Table 4 respectively.
Table 3. Classification report for training set in age comparison with decision tree model.
Precision is the proportion of true positives among all positive predictions. In our case, it shows how many subjects were correctly recognized as elderly drivers of all the subjects the classifier labeled as elderly.
Recall is the proportion of true positives among all truly aged subjects. In our case, it shows how many elderly drivers the classifier correctly identified and how many did it miss.
The F1 score is a measure that combines both precision and recall. It pro- vides an overall assessment of model performance, taking into account both false positives and false negatives.
In the classification report for training, the model showed high precision, recall and F1 score for both classes, with precision, recall and f1-score of 0.90 for young subjects and elderly subjects. The overall accuracy is 0.90, meaning that the model correctly predicted 90% of the samples in the training set.
In the classification report for validation, the model showed high precision, recall and F1 score for both classes, with precision of 1.00, recall of 0.67 and f1-score of 0.80 for elderly subjects, and precision of 0.67, recall of 1.00 and f1-score of 0.80 for young subjects. Overall accuracy is 0.80, meaning that the model correctly predicted 80% of the samples in the validation set.
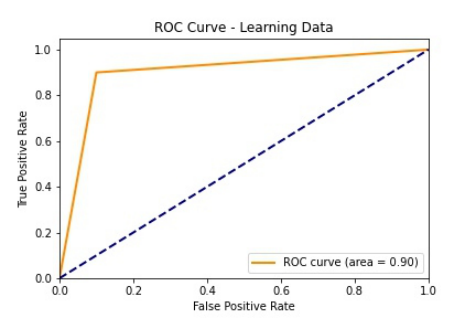
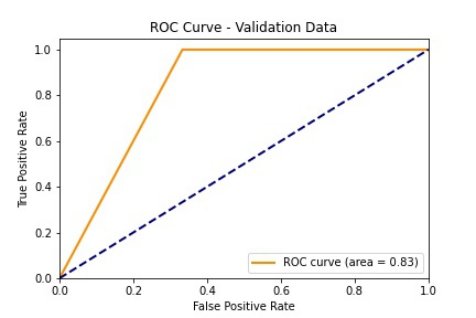
Finally, we calculated the area under the Receiver Operating Characteristic (ROC) curve (Area Under the Curve (AUC)), which is a measure of the overall performance of a classification model. For learning, the area under the ROC curve is 0.9, indicating a good ability of the model to discriminate between classes. For validation, the area under the ROC curve is 0.8333, suggesting a slightly lower performance than for learning. The ROC Curve for training set and test set are presented in Figure 2 and Figure 3, respectively.
Figure 2: ROC Curve for training set.
Can We Distinguish Driver’s Age Based on Their Eye Movements? 401
Figure 3: ROC curve for test set.
It’s important to note that the interpretation of these measures depends on the context of the application. In some cases, precision may be more critical, while in others, recall may be more important. It is essential to consider these measures as a whole to assess the relevance and effectiveness of our age pre- diction model based on eye phenomenon metrics. In our case, lower recall means that we have some non-identified elderly subjects which is a bit more problematic than if some young drivers are classified as old.
DISCUSSION AND CONCLUSION In our study we investigated eye gaze and pupillometric variables in young and elderly drivers and reported significant differences between the two age groups. Our results showed that young drivers exhibited significantly shorter average and maximum durations of saccades compared to elderly drivers suggesting that they possess greater agility in their eye movements and can rapidly shift their gaze from one point to another, potentially contributing to better visual scanning while driving. Our results also found a significant difference in the minimum duration of fixations between young and older elderly drivers, indicating the ability of younger drivers to process visual information more rapidly and make quick decisions on the road. These find- ings provide valuable insights into the differences in eye behaviour between young and elderly drivers. Understanding these distinctions may aid in devel- oping targeted interventions and improving road safety for drivers in different age groups.
The results of the machine learning approach indicate that the selected decision tree model performed well in both training and validation phases. In the training phase, the model achieved high precision, recall, and F1 score for both classes (young and elderly subjects) with an overall accuracy of 90%. The classification report for the validation phase also showed high preci- sion, recall, and F1 score for both classes, with an overall accuracy of 80%. These results suggest that the model was effective in distinguishing between young and elderly subjects, and it showed promising performance in both the training and validation sets. However, it’s essential to interpret these results
carefully and consider potential biases and generalizability when applying the model to new data.
Nevertheless, this study comes with certain limitations that warrant con- sideration. Firstly, the relatively small sample size used in this research may limit the generalizability of the findings to the broader population. Addition- ally, while we made efforts to tailor the analysis codes to suit the study’s requirements, it is important to acknowledge that inherent limitations may persist in these methods. To enhance and complement the obtained results, future research should consider employing larger sample sizes and conducting comparisons of eye-tracking data analysis algorithms. Doing so will provide a more robust and comprehensive understanding of the topic.
Despite these limitations, the outcomes of this study hold substantial implications across various domains. Cognitive psychology researchers can leverage these findings to gain deeper insights into age-related disparities in visual driving behaviour. Engineers involved in intelligent driving systems can use these results to customize their solutions for different age groups, thereby enhancing overall road safety.
ACKNOWLEDGMENT
This work was financially supported by the “Bourse du Conseil Région Auvergne Rhône Alpes (BRMIE)” and “Bourse à l’aide à la mobilité inter- nationale (AMI) du CROUS”, by the ARRS research program ICT4QL, grant no. P2-0246 and by the European Union’s Horizon 2020 research and innovation program for the project HADRIAN, grant agreement no. 875597.
REFERENCES
Carrasco, M. E. A. (2011). Visual impact and eye fixation of non conventional advertising (NCA) on television among young people and the elderly. Cuadernos del Consejo del Audiovisual de Cataluña (CAC), 14(2), 77–88. Data analytics (2022), https://vitalflux.com/different-types-of-statistical-tests-conce
pts-examples/, accessed 11 May 2023. Decision trees (2023), https://scikit-learn.org/stable/modules/tree.html, accessed 27 June 2023. Jupyter Notebook (2014), https://jupyter.org/, accessed 14 April 2023. Mahanama, B., Jayawardana, Y., Rengarajan, S., Jayawardena, G., Chukoskie,
L., Snider, J., & Jayarathna, S. (2022). Eye movement and pupil measures: A review. Frontiers in Computer Science, 3, 733531. Zargari Marandi, R., Madeleine, P., Omland, Ø., Vuillerme, N., & Samani, A.
(2018). Eye movement characteristics reflected fatigue development in both young and elderly individuals. Scientific reports, 8(1), 13148. PyGaze (2015), http://www.pygaze.org/2015/06/pygaze-analyser/, accessed 10 April
2023. Skaramagkas, V., Giannakakis, G., Ktistakis, E., Manousos, D., Karatzanis, I., Tachos, N. S., ... & Tsiknakis, M. (2021). Review of eye tracking metrics involved in emotional and cognitive processes. IEEE Reviews in Biomedical Engineering, 16, 260-277. Tarnowski, P., Kołodziej, M., Majkowski, A., & Rak, R. J. (2020). Eye-tracking anal-
ysis for emotion recognition. Computational intelligence and neuroscience, 2020.
Can We Distinguish Driver’s Age Based on Their Eye Movements? 403
Tobii Pro Glasses 2 wearable eye tracker. Available online: https://www.tobiipro.com /product-listing/tobii-pro-glasses-2/. Thai, J., Stojmenova Peˇceˇcnik, K., Sodnik, J. (2023) Method for distinguishing
driver’s age based on pupillometry data. Proceedings of the 32nd Interna- tional Electrotechnical and Computer Science Conference ERK 2023: Portorož, Slovenija. Vengust, M., Kaluža, B., Stojmenova, K., & Sodnik, J. (2017, September). NERVteh compact motion based driving simulator. In Proceedings of the 9th International Conference on Automotive User Interfaces and Interactive Vehicular Applications Adjunct (pp. 242–243).
LISTED IN THE AHFE DIGITAL BOOKSTORE CATALOGUE
Explore the complete digital volume
Emerging Technologies in Healthcare and Medicine
Read this individual research paper free through the original publisher, or explore the full digital proceedings book.
ISBN 978-1-958651-92-6
Explore this ISBN in the AHFE Bookstore ↗Listed in the July 2026 bookstore catalogue; search by ISBN to confirm current availability · Digital book purchase optional