Sean Laraway, Susan Snycerski, Sean Pradhan, Bradley Huitema, William Rantz, Geoffrey Whitehurst, Vernol Battiste (2024). An Introduction to Single-Case Experimental Designs for Applied Human Factors and Ergonomics. In: Neuroergonomics and Cognitive Engineering. AHFE Open Access, vol. 126, pp. 97–106. https://doi.org/10.54941/ahfe1004742
Experimental designs help human factors and ergonomics (HFE) scientists and professionals make decisions about the causal effects of interventions on measures of human cognition, emotion, and performance. HFE researchers have typically used traditional between-subjects, within-subjects, and mixed experimental designs to do so. Although these designs will continue to play an important role in HFE research, some research questions and applied problems do not easily lend themselves to the use of these designs. This is particularly true when a study focuses on the performance of single individuals or two or more individuals performing as a single unit, and/or researchers find it difficult or impossible to obtain enough individuals from the population of interest to achieve sufficient statistical power for traditional experimental designs. In these situations, single-case experimental designs (SCEDs), can offer effective and flexible alternatives to traditional experimental designs. In this paper, we describe the general characteristics of SCEDs and the two most common designs, withdrawal and multiple-baseline designs using HFE examples. SCEDs have demonstrated potential to identify effective interventions for individuals in a variety of domains and contexts relevant to HFE.
Researchers in human factors and ergonomics (HFE) and related fields rely on a variety of methods to improve and support human cogni- tion, emotion, and performance in complex sociotechnological systems (Salvendy, 2012; Stanton et al., 2014; Wickens et al., 2022). In the simplest terms, these methods can be described as non-experimental or experimental. Non-experimental methods remain important for the development of the- ory and practical applications and can answer questions that experimental approaches cannot. Despite this, non-experimental designs suffer from an inability to provide strong causal evidence (Shadish, Cook and Campbell, 2002). For research questions that involve causal relationships, we should use experimental designs whenever possible. Regardless of their specifics, all
experimental designs involve: (a) the manipulation of an independent vari- able (IV; treatment, intervention) with at least two separate conditions or levels (e.g., control vs. treatment); (b) the measurement of a dependent vari- able (DV); and (c) the control of nuisance (confounding, extraneous) variables to improve a study’s internal validity. Internal validity refers to the extent to which we can demonstrate that the intervention influenced the DV and rule out plausible alternative or “rival” explanations (i.e., threats to internal validity) for the observed differences in values of the DV across experimental conditions (Shadish et al., 2002).
HFE researchers typically have used traditional between-subjects, within- subjects (repeated-measures), and mixed experimental designs, which com- bine between- and within-subjects IVs. Although these designs will continue to play an important role in HFE research, some research questions and applied problems do not easily lend themselves to the use of these designs. This is particularly true when (a) comparisons across groups are impossible or difficult to obtain (e.g., the population of interest is relatively small, such as pilots of ultra-light or home-built aircraft; Whitehurst, 2013), (b) the perfor- mance of an individual is our primary interest, (c) ethical concerns preclude using group designs (e.g., assigning individuals to a control group that never receives the treatment is dangerous, unfair, or discriminatory; Poling, Methot and LeSage, 1995), and/or (d) researchers lack resources needed to collect enough data to achieve adequate statistical power for traditional experimen- tal designs (Whitehurst, 2013). In these situations, single-case experimental designs (SCEDs), can offer effective and flexible alternatives to traditional experimental designs. In this paper, we describe the basic features of SCEDs in general and then focus on the two most popular SCEDs (withdrawal and multiple-baseline designs) using examples from the HFE literature. Strengths and limitations of SCEDs are discussed.
SINGLE CASE EXPERIMENTAL DESIGNS (SCEDS) SCEDs focus on changes in the DV for the single case, which can be an individual or a group of individuals functioning as a single unit (e.g., popu- lations, communities, organizations; Hawkins et al., 2007). In the different conditions (or phases), cases serve as their own controls (Kazdin, 2011). The SCEDs described in this paper typically start with a baseline (A) phase in which we collect control data but do not deliver the intervention. After col- lecting sufficient baseline data, we implement the intervention (B) phase. If different intervention phases beyond B (additional levels of the IV) are used, they are labeled as C, D, and so on (Kazdin, 2011). Like within-subjects designs, SCEDs expose cases to every experimental condition. They differ in that the former typically obtain one data point per unit under each level of the IV, whereas the latter obtain multiple data points per unit under each level of the IV (Huitema, 2011; Kazdin, 2011). The number of data points we collect depends on a variety of factors, including available resources and statistical power, but as with all experimental designs larger samples of data are preferable. Within-subjects designs and SCEDs have several advantages over group designs, including the ability to track changes in the DV in the same individual across time and the need for fewer participants for ade- quate statistical power (Huitema, 2011). The primary advantage of SCEDs
An Introduction to Single-Case Experimental Designs 99
over within-subjects designs is that the former only requires a single case to make causal statements, allowing for the evaluation of interventions in individual units. In practice, studies using SCEDs typically include more than one case (Shadish and Sullivan, 2011). A downside of SCEDs is that the results that we obtain may not be generalizable to the population of interest. For practitioners, SCEDs provide flexible design options that we can adapt to changing circumstances, allowing us to tailor interventions to an individual’s situation and progress while maintaining experimental rigor (Kinugasa et al., 2004; Kazdin, 2011). SCEDs also allow researchers and practitioners to assess the efficacy of interventions in ecologically valid “real-world” situations (Barker et al., 2013). Consequently, SCEDs can help answer questions about interventions such as “what is effective, for whom, and under what conditions” (Ledford, 2018, p. 72; emphasis in original). Given that SCEDs focus on individuals rather than group comparisons, they can help us avoid “one-size-fits-all” interventions.
Before discussing the two most common SCEDs, we will first describe the most basic single-case design, the quasi-experimental two-phase AB design, which starts with a baseline (A) phase and ends with an intervention (B) phase. The baseline phase serves three purposes by providing: (a) informa- tion about the initial level, variability, trend, and stability (consistency across time) of the DV before introducing the intervention, showing the severity of the problem being addressed; (b) the predicted pattern and values of the DV in the absence of a treatment effect; and (c) control data used to evalu- ate the effectiveness of the intervention (Huitema, 2011; Kazdin, 2011). The causal logic of the AB and related, more complex designs requires that the DV changes from baseline only after we introduce the intervention, thus per- mitting conclusions that the intervention produced those changes. Although straightforward in its logic, the AB design suffers from several threats to inter- nal validity, including history, maturation, and regression to the mean that could be confused with a treatment effect. The AB design does not effectively control these threats to internal validity, and we do not recommend their use if possible. We discuss it to illustrate the causal logic of two SCEDs that bet- ter control threats to internal validity and replicate the observed treatment effect. Historically, SCED researchers have used visual analysis of graphed data, and this practice remains popular among SCED researchers (Kazdin, 2011; Ledford et al., 2019b). In this paper, we primarily rely on visual anal- ysis to demonstrate the logic of SCEDs. Visual analysis remains useful for assessing intervention effects in these designs (Ledford et al., 2017; Led- ford et al., 2019a, 2019b), and data visualization remains an important tool for understanding and describing data (Cumming and Finch, 2005; Tufte, 2009). Our recommendations for researchers seeking to publish their results or obtain external funding differ from those for practitioners seeking to meet the needs of stakeholders in applied settings. Visual analysis has many advan- tages for practitioners: it is easy, quick, inexpensive, and readily understood by clients and consumers (Busse et al., 2015). For researchers, journal and grant reviewers may expect and require statistical analysis. Several statistical analyses for SCED data have been described in the literature, but currently we do not have consensus on the “best” methods. In this paper, we will com- plement visual analysis with Huitema’s (2011) ordinary least squares (OLS)
regression-based methods in which the Y variable is the DV and the X vari- able is time or measurement occasion. In a full analysis using Huitema’s methods, predictor variables are included to test intervention effects between adjacent phases; we do not discuss the details here. For specifics, see Huitema (2011, pp. 367–471); for examples from the HFE literature see Tixier and Albert (2013) and Whitehurst (2014b).
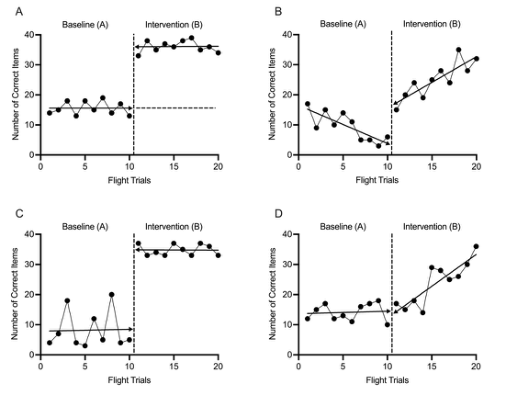
Graphed SCED data show several features that can be used to detect and describe intervention effects: (a) level change between phases, (b) slope (trend) change between phases, (c) variability within phases, (d) immedi- acy (or latency) of the effect between phases, (e) overlap of data points between phases, and (f) consistency of data patterns across similar phases (Barker et al., 2011; Whitehurst, 2014a, 2014b; Ledford, 2018). Interven- tions may change any of these features, but the focus is often on level and slope change across phases (Huitema, 2011). An important feature of SCED data is their within-phase stability, which refers to data that show no clear trend (near-zero slope) and low variability. Trending data can complicate our causal inferences. If the data trend in the direction of the hypothesized treat- ment effect, it is unclear if these changes occurred due to nuisance variables or the intervention (Kazdin, 2011). As Kazdin (2011) noted, however, “…im- provements in baseline are not a reason for doing nothing. An intervention might still be important to accelerate the process” (p. 303; emphasis added). This would be seen if the slope increased markedly from the baseline to inter- vention phase. Conclusions about a potential causal relation between the IV and DV become clearer when the baseline data trend in the opposite direc- tion of the hypothesized treatment effect if we have sufficient data points to determine that the trend reflects the true baseline process (Huitema, 2011). In situations in which we are concerned with improving performance by mak- ing it more consistent, highly variable baseline data help us identify treatment effects if data become less variable after the introduction of the intervention (Barker et al., 2011). In summary, data that provide the strongest evidence for treatment effects show low variability within each phase, large and immedi- ate level (and/or slope) changes between phases, consistency of changes in the DV across intra- and inter-case replications, and low overlap between base- line and intervention data points (Virués-Ortega and Martin, 2010; Kazdin, 2011; Ledford, 2018). Figure 1 depicts important features of SCED data1 based on Rantz et al. (2009), who investigated the effects of graphic postflight feedback and praise on student pilots’ checklist use in simulated flights. The DV is the number of checklist items completed correctly. In Figure 1, arrows at the end of each regression line indicate the predicted value of the DV at the first measure- ment occasion in the intervention phase based on a model of the baseline phase (left arrow) and a model of the intervention phase (right arrow). If the baseline phase has n1 data points and the intervention phase has n2 data points, the predicted value of the DV at the start of the intervention phase occurs at n1 +1 (on flight trial 11 in Figure 1). Level change is the differ- ence between these two predicted data points unexplained by differences in 1All data in Figures 1-3 are hypothetical and are meant to illustrate the designs; they do not necessarily represent the exact findings of the studies cited. In all Figures, the vertical dashed line indicates a change from one phase to another, and solid lines through the data are within-phase OLS best-fit regression lines.
An Introduction to Single-Case Experimental Designs 101
within-phase slopes, assuming that we have chosen an adequate model for each phase (Huitema, 2011). When the slopes in both phases are near-zero, the level change is roughly equal to the mean difference between the two phases. Larger differences in within-phase slopes produce a mean difference that increasingly deviates from level change, providing a misleading measure of treatment effects because it ignores trends in the data. With trends, the mean difference may be large in the absence of an effect or may not reveal a treatment effect when there is one (Huitema, 2011). Adequate statistical anal- yses of SCED data must model both slope change (if any) and level change. In Panel A, the horizontal dashed line in the second phase shows the pre- dicted level of the DV in the absence of a treatment effect. We can see here that the two phases have similar (near-zero) slopes and amounts of variability (SD = ∼2.00). There is a large level change (roughly 20 points), no overlap in data between the two phases, and consistent patterns in each phase, all of which visually suggest a treatment effect. In Panel B, we see both a level change and slope change (negative and positive in the baseline and interven- tion phase, respectively). In addition, only one data point in the intervention phase overlaps with the data in the baseline phase, and the effect of the treat- ment effect shows low latency as the values of the DV start to increase early in the intervention phase. Panel C has similar data as in Panel A, with large level change, close to non-zero slopes, no slope change, and no overlap, but the baseline data show more variability (SD = 6.25) compared to the inter- vention phase (SD = 1.81). This shows that some interventions can reduce unwanted variability by producing more consistent performance. In Panel D, we see no appreciable level change and a substantial slope change from near-zero in the baseline phase to a steep improvement in the intervention phase. These data show longer latency of effect and more overlap compared to Panels A-C. Here, the data overlap until the fifth trial in the intervention phase.
Figure 1: Examples of features of SCED data in AB designs (adapted from Rantz et al., 2009; Huitema, 2011; Whitehurst, 2014a, 2014b).
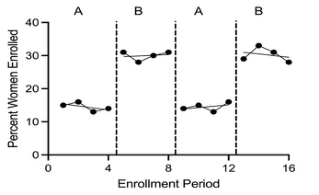
WITHDRAWAL DESIGNS To strengthen causal inferences, we can withdraw the intervention, introduc- ing a second baseline (A) phase thus yielding an experimental ABA design (withdrawal or reversal design). If the DV changes from baseline levels in the intervention phase and changes back to near baseline levels when the intervention is removed, then we can have more confidence that the inter- vention produced the observed changes (Poling et al., 1995). Although a confounding variable could have occurred when we introduced the interven- tion, we would not expect it to stop operating at the exact time we removed the intervention (Kazdin, 2011). We can further strengthen internal validity by adding a second intervention phase, yielding an ABAB design. Huitema (2011) noted that these designs have strong internal validity when the DV (a) shows similar patterns during each baseline and intervention phase and (b) changes rapidly when the intervention is introduced and withdrawn. Each AB cycle that demonstrates the predicted change in the target variable represents a replication of the intervention effect (Kazdin, 2011). Repeated demon- strations of the intervention effect within and between cases helps reduce concerns about the reproducibility of our findings. Of course, additional replications from other researchers adds further credibility to our claims regarding the intervention’s effectiveness and increases the finding’s exter- nal validity (Laraway et al., 2019). Withdrawal designs can provide strong evidence of causal effects of the intervention, but they suffer from three problems: (a) we cannot use them to study interventions with long-lasting or irreversible effects; (b) withdrawing an effective intervention could be impractical, unethical, or impossible; and (c) the need for frequent, repeated measurement may pose practical problems in applied settings (Poling et al., 1995). Although conceptually simple to understand and powerful to detect treatment effects under the proper conditions, the limitations of withdrawal designs might help explain their relatively infrequent use in the SCED liter- ature across different areas (Shadish and Sullivan, 2011). Figure 2 depicts hypothetical data based on Kizilcec and Saltarelli (2019), who examined whether adding psychologically inclusive cues (intervention) on an online probability and statistics course’s enrollment page would increase women’s enrollment in the course compared to a page without inclusive cues (base- line). The DV in the Figure is the percentage of self-identified women who enrolled in the course. We can see that more women enrolled in the course when inclusive design elements were added to the course enrollment page compared to baseline.
Figure 2: Example of an ABAB design (based on Kizilcec and Saltarelli, 2019).
An Introduction to Single-Case Experimental Designs 103
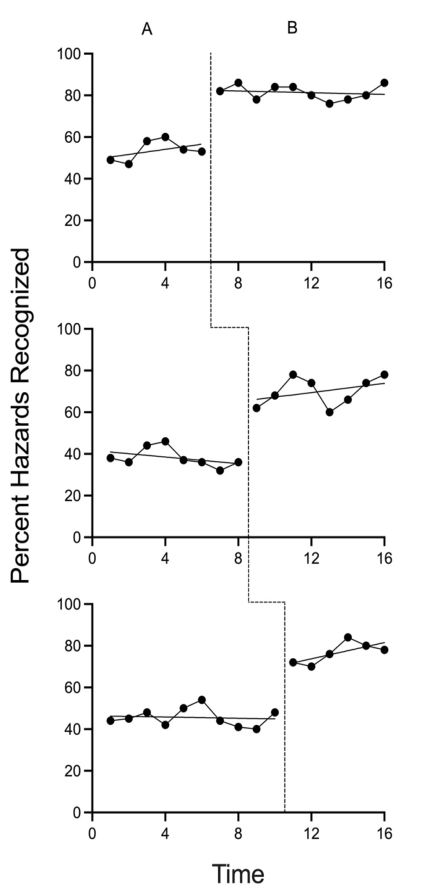
MULTIPLE-BASELINE DESIGNS Unlike withdrawal designs, multiple-baseline designs do not require removal of an effective treatment to identify causal effects so they can be used to assess interventions with irreversible effects (Kazdin, 2011). This might explain their popularity in the SCED literature (Shadish and Sullivan, 2011; Tanious and Onghena, 2021). In multiple-baseline designs, measurement of the DV should occur across at least three separate baseline-intervention (AB) compar- isons (“tiers”) to demonstrate adequate experimental control (Kazdin, 2011). The graphed result is a series of stacked AB designs as seen in Figure 3 (White- hurst, 2013). Measurement occurs under each baseline until they all show stable data. At this point, the first tier moves to the intervention phase while we continue to collect baseline data on the other tiers. When the DV shows stability across all tiers (including the first with the intervention in place), the intervention is introduced to the second baseline; this process contin- ues until all tiers receive the intervention. The logic of this design resembles that of AB designs as depicted in Figure 1: we expect the DV to change only after adding the intervention on each separate tier and not before (Hawkins et al., 2007; Kazdin, 2011). To overcome the threats to internal validity of AB designs (e.g., history and maturation), multiple-baseline designs stag- ger the introduction of the intervention across time in the different tiers (Kazdin, 2011). Three main variations of the multiple-baseline design appear in the SCED literature2: (a) across DVs, in which we measure different DVs for the same case(s); (b) across cases, in which we measure the same DV for different cases; and (c) across contexts, in which we measure the same DV for the same case(s) in different situations. The main limitation of the multiple-baseline design is the requirement for extended baselines to demon- strate causal relationships. In some situations, withholding an intervention for long periods of time to achieve stable baselines might pose ethical and/or practical problems (Barker et al., 2011). Inconsistent effects of the interven- tion across tiers can complicate our conclusions regarding its effectiveness (e.g., the DV changes in the desired direction on some tiers but not oth- ers). Figure 3 presents hypothetical data based on Tixier and Albert (2013), who used a multiple-baseline design across cases to examine the effects of a high-fidelity augmented reality (AR) software tool to increase the situation awareness (hazard recognition) in three construction crews (the cases). The DV was percentage of hazards recognized in the AR environment. This Figure demonstrates that the AR tool increased the percent of hazards recognized and this change only occurred upon introduction of the intervention on each tier.
2Although not discussed here, we can combine withdrawal elements to multiple-baseline designs by remov- ing and reintroducing the intervention. See Kazdin (2011, Chapter 10) for descriptions of combined SCEDs. For empirical HFE examples, see Rantz et al. (2009), Arnold and Van Houten (2011), Rantz and Van Houten (2011), and Whitehurst (2014a).
Figure 3: Example of a multiple-baseline design (based on Tixier and Albert, 2013).
CONCLUSION
SCEDs do not require large numbers of participants for sufficient statistical power to detect the causal effects of interventions. They can be used in real- world settings in which we are concerned with performance of individuals (either persons or groups). Therefore, SCEDs could provide relatively cost- effective and flexible approaches to assessing intervention effectiveness in many HFE contexts. Despite their potential usefulness, SCEDs do not appear to be widely used in HFE research compared to traditional experimental designs (Whitehurst, 2014a). One limitation of SCEDs is that they involve
An Introduction to Single-Case Experimental Designs 105
repeated observations of at least one quantitative DV, with the data showing stability. This may not be possible in some contexts. A second limitation is that they are less well-suited for examining interactions between two or more IVs, unlike traditional experimental designs. A third limitation is that some SCEDs require relatively long baseline phases in which the treatment is with- held. The purposes of this paper were to introduce SCEDs, suggest possible applications of SCEDs in HFE, and encourage researchers to consider using SCEDs as alternatives to traditional experimental designs when warranted by practical circumstances and relevant research questions.
REFERENCES
Barker, J., McCarthy, P., Jones, M., and Moran, A. (2011) Single-case research methods in sport and exercise psychology. New York: Routledge. Barker, J. B., Mellalieu, S. D., McCarthy, P. J., Jones, M. V., and Moran, A. (2013)
‘A review of single-case research in sport psychology 1997–2012: Research trends and future directions’, Journal of Applied Sport Psychology, 25(1), pp. 4–32. Busse, R. T., McGill, R. J., Kennedy, K. S. (2014) ‘Methods for assessing single-case school-based intervention outcomes’, Contemporary School Psychology, 19(3), pp. 136–144. Cumming, G. and Finch, S. (2005) ‘Inference by eye: Confidence intervals and how
to read pictures of data’, American Psychologist, 60(2), pp. 170–180. Hawkins, N. G., Sanson-Fisher, R. W., Shakeshaft, A., D’Este, C., and Green, L. W.
(2007) ‘The multiple baseline design for evaluating population-based research’, American Journal of Preventive Medicine, 33(2), pp. 162–168. Huitema, B. E. (2011) The Analysis of covariance and alternatives: Statistical methods for experiments, quasi-experiments, and single-case studies (2nd Ed). Hoboken, NJ: John Wiley & Sons, Inc. Kazdin, A. E. (2011) Single-case research designs: Methods for clinical and applied
settings (2nd Ed.). New York: Oxford University Press. Kinugasa, T., Cerin, E. and Hooper, S. (2004) ‘Single-subject research designs and data analyses for assessing elite athletes conditioning’, Sports Medicine, 34(15), pp. 1035–1050. Kizilcec, R. F. and Saltarelli, A. J. (2019, May) ‘Psychologically inclusive design: Cues
impact women’s participation in STEM education’, In Proceedings of the 2019 CHI Conference on Human Factors in Computing Systems, pp. 1–10. Laraway, S., Snycerski, S., Pradhan, S. and Huitema, B. E. (2019) ‘An overview of scientific reproducibility: Consideration of relevant issues for behavior science/- analysis’, Perspectives on Behavior Science, 42, pp. 33–57. Ledford, J. R. (2018) ‘No randomization? No problem: Experimental control and
random assignment in single case research’, American Journal of Evaluation, 39(1), pp. 71–90. Ledford, J. R., Lane, J. D. and Severini, K. E. (2017) ‘Systematic use of visual analysis for assessing outcomes in single case design studies’, Brain Impairment, 19(1), pp. 4–17. Ledford, J. R., Barton, E. E., Severini, K. E., and Zimmerman, K. N. (2019a) ‘A
primer on single-case research designs: Contemporary use and analysis’, American Journal on Intellectual and Developmental Disabilities, 124(1), pp. 35–56. Ledford, J. R. Barton, E. E., Severini, K. E., Zimmerman, K. N., and Pokorski (2019b) ‘Visual display of graphic data in single case design studies: Systematic review and expert preference analysis’, Education and Training in Autism and Developmental Disabilities, 54(4), pp. 315–327.
Poling, A., Methot, L. L. LeSage, M. (1995) Fundamentals of behavior analytic research. New York: Springer. Rantz, W. G. and Van Houten, R. (2011) ‘A feedback intervention to increase digi-
tal and paper checklist performance in technically advanced aircraft simulation’, Journal of Applied Behavior Analysis, 44(1), pp. 145–150. Rantz, W. G., Dickinson, A. M., Sinclair, G. A., and Van Houten, R. (2009) ‘The effect of feedback on the accuracy of checklist completion during instrument flight training’, Journal of Applied Behavior Analysis, 42(3), pp. 497–509. Salvendy, G. (ed.) (2012) Handbook of human factors and ergonomics (4th Ed.).
Hoboken, NJ: John Wiley & Sons, Inc. Shadish, W. R., Cook, T. D. and Campbell, D. T. (2001) Experimental and quasiexperimental designs for generalized causal inference. Boston, MA: Houghton Mifflin. Shadish, W. R. and Sullivan, K. J. (2011) ‘Characteristics of single-case designs
used to assess intervention effects in 2008’, Behavior Research Methods, 43(4), pp. 971–980. Stanton, N. A., Salmon, P. M., Rafferty, L. A. and Walker, G. H. (2017). Human factors methods: A practical guide for engineering and design (2nd Ed.). London: CRC Press. Tanious, R. and Onghena, P. (2020) ‘A systematic review of applied single-case
research published between 2016 and 2018: Study designs, randomization, data aspects, and data analysis’, Behavior Research Methods, 53(4), pp. 1371–1384. Tixier, A. J. P. and Albert, A. (2013, June) ‘Teaching construction hazard recognition through high fidelity augmented reality’, In 2013 ASEE Annual Conference & Exposition (pp. 23.1139.1–23.1139.15). Tufte, E. R. (2009) The visual display of quantitative information (2nd Ed). Cheshire
(CT): Graphics Press. Virués-Ortega J. and Martin G. L. (2010) ‘Guidelines for sport psychologists to evaluate their interventions in clinical cases using single-subject designs’, Journal of Behavioral Health and Medicine, 1(3), pp. 158–171. Whitehurst, G. (2013) ‘Dwindling resources: The use of single-case research designs
as an efficient alternative for applied aviation research’, Aviation Psychology and Applied Human Factors, 3(2), pp. 63–72. Whitehurst, G. (2014a) ‘The cost of increased validity: Combining a multiple baseline design with an ABAB design’, GSTF Journal on Aviation Technology, 1(1), pp. 38–53. Whitehurst, G. (2014b) ‘The multiple-baseline design: An answer to small sample
sizes in aviation research’, Aviation Psychology and Applied Human Factors, 4(1), pp. 1–12. Wickens, C. D., Helton, W. S., Hollands, J. G., and Banbury, S. (2022) Engineering Psychology and human performance (5th Ed). New York: Routledge.
LISTED IN THE AHFE DIGITAL BOOKSTORE CATALOGUE
Explore the complete digital volume
Neuroergonomics and Cognitive Engineering
Read this individual research paper free through the original publisher, or explore the full digital proceedings book.
ISBN 978-1-964867-02-1
Explore this ISBN in the AHFE Bookstore ↗Listed in the July 2026 bookstore catalogue; search by ISBN to confirm current availability · Digital book purchase optional