Hiroaki Kosaka, Kiyonao Ikeguchi (2024). Attempt to evaluate pictogram complexity using fractal dimension. In: Ergonomics In Design. AHFE Open Access, vol. 129, pp. 50–56. https://doi.org/10.54941/ahfe1004810
Pictograms are used in a variety of situations, including road signs, public facilities such as train stations and airports, evacuation guidance during disasters, and icons on computer screens. Pictograms can provide guidance and instructions without being affected by language differences. For example, a foreigner who does not understand the script or language of the country may not be able to understand a sign written in the language but may be able to understand a pictogram. Thus, pictograms have the advantages mentioned above. Pictograms must be easy to understand, so that people can understand what they mean immediately, but there are pictograms that are difficult to understand. We assume that there are many factors that contribute to the understandability of a pictogram, one of which is the complexity of the pictures in the pictogram. For example, if there are many picture elements in a pictogram, it becomes more complex, and it may take that much longer to read and may be difficult to understand. Therefore, we would like to investigate the relationship between pictogram picture complexity and reading time. It is first necessary to quantify the pictogram's pictorial complexity to investigate the relationship.In this paper, we attempt to quantify the complexity of pictogram images using fractal dimension. Kosaka et al. conducted an experiment in which 13 participants read 56 pictograms and answered what each pictogram was. The answers and reading time when they read pictograms were recorded. We calculated the fractal dimension of these pictograms and examined the relationship between the calculated fractal dimension values and the reading time, the calculated fractal dimension values and the percentage of correct answers to what the pictogram indicated. The experimental results indicated that the reading time and the percentage of correct answers rate were not correlated with fractal dimension.
A pictogram is a simplified visual symbol that conveys information without words. In Japan, pictograms were first used at the 1964 Tokyo Olympics. At that time, most Japanese people still had difficulty communicating in foreign languages. Therefore, a visual device was needed to help both Japanese and foreign visitors understand the facilities and equipment (Yukio, 1995).
Pictograms are effective in communicating information to foreign tourists who cannot read Japanese. However, if a large amount of information is conveyed in a single pictogram, the pictogram is likely to be complex, mak- ing it difficult or time-consuming to understand it. It would be helpful to quantitatively assess the complexity of a pictogram and determine a thresh- old of pictogram complexity, which is necessary for rapid understanding of pictograms.
A fractal is a measure of random complexity in nature (Benoît, 1982), and a fractal dimension is a quantified measure of fractal self-similarity features and used as a measure of the degree of complexity. The more complex the object being evaluated, the larger the fractal dimension.
There have been many studies that have attempted to quantify image com- plexity in fractal dimension. One study examined the extent to which fractal dimension can explain judgments of perceived beauty (Forsythe, 2011). Mea- sures of fractal dimension explained more of the variance in judgments of
Attempt to Evaluate Pictogram Complexity Using Fractal Dimension 51
perceived beauty in visual art than measures of visual complexity alone, espe- cially in abstract and natural images. Another study attempted to quantify the complexity of leaf shape in fractal dimension (John, 1995). Their experi- mental results indicated that fractal dimension provides a useful quantitative measure of the elaboration of shape complexity during plant development. Ota et al. examined the relationship between line length and stroke length of Chinese characters (Japanese Kanji) (Morihiro, 2019). They used frac- tal dimension to show that the shape of a Chinese character can be said to become plane-fillingly complex as the number of strokes increases. However, few studies have examined pictogram complexity using fractal dimension.
We attempted to examine the relationship between the fractal dimension of a pictogram and time taken to understand that pictogram to determine if it is a valid indicator of pictogram complexity.
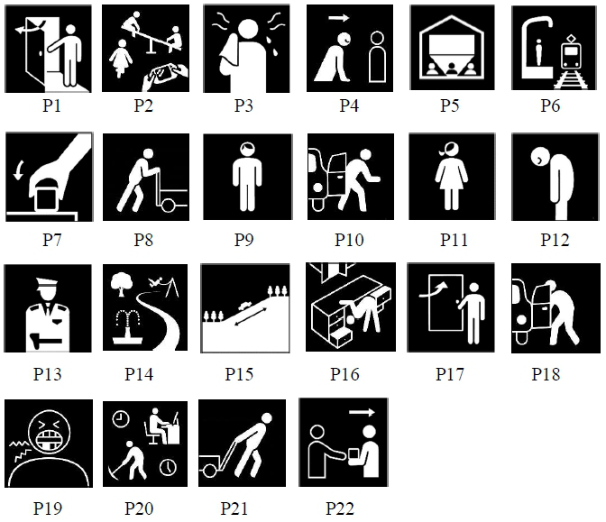
Evaluation Method and Results Kosaka et al. conducted an experiment in which 13 participants read 56 pic- tograms and answered what each pictogram was (Tatsuya, 2023). In this study, we selected 22 of the 56 pictograms for our evaluation. Figure 1 shows the 22 pictograms, and Table 1 shows the time taken to answer each ques- tion, i.e. the time to understand each pictogram. The number of pictograms from P1 to P22 in Table 1 are defined in Figure 1. Table 2 shows the average percentages of correct answers to what the pictogram indicated.
Fractal dimensions were calculated for the 22 pictograms by using box counting. The size of each pictogram was 450 dots square. Table 3 shows the results of the calculation.
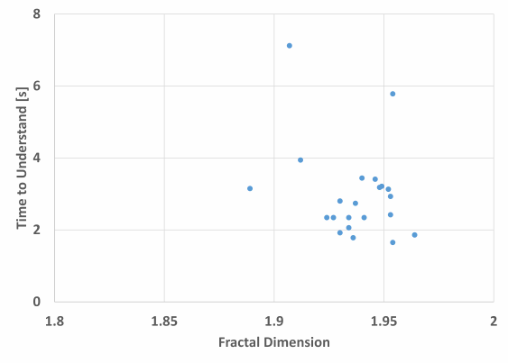
Figure 2 shows the relationship between time to understand shown in Table 1 and fractal dimension shown in Table 3. The correlation coefficient between fractal dimension and time to understand was −0.275. Figure 2 and this correlation coefficient indicate that there is no linear relationship between the fractal dimension and time to understand.
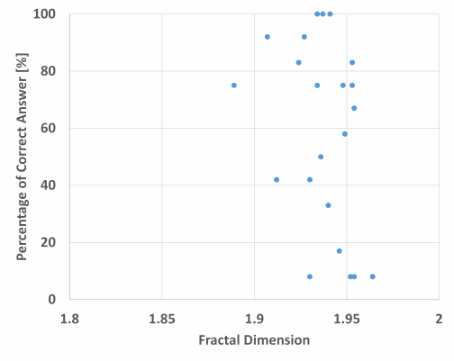
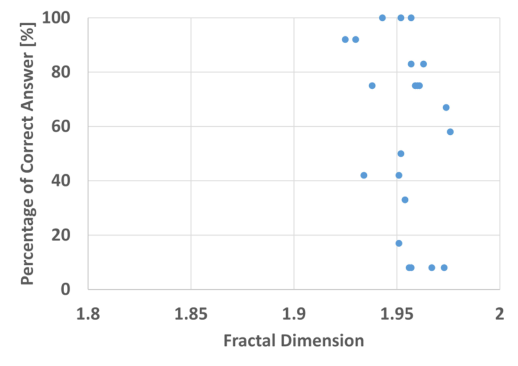
Figure 3 shows the relationship between percentage of correct answers shown in Table 2 and fractal dimension shown in Table 3. The correlation coefficient between fractal dimension and percentage of correct answers was −0.326. Figure 3 and this correlation coefficient indicate that there is no linear relationship between the fractal dimension and percentage of correct answers.
Attempt to Evaluate Pictogram Complexity Using Fractal Dimension 53
Figure 2: Relationship between fractal dimension and time to understand.Figure 3: Relationship between fractal dimension and percentage of correct answer.
54 Kosaka and Ikeguchi
Kazuya et al. proposed a method for accurately calculating the fractal dimension in box counting (Kazuya, 1997). The resolution of the image and size of the box set by box counting are factors that affect the accuracy of fractal-dimension calculation. If these values are too large or too small, the accuracy of the fractal- dimension calculation will be low. Kazuya et al. there- fore proposed setting upper and lower bounds for these values so that they exist in the correct range when calculating the fractal dimension. They called these upper and lower limits the cutoff levels (Kazuya, 1997). The lower cutoff level should be set to a cell value that is at least greater than the reso- lution and observation accuracy of the figure. The upper cutoff level should not depend on the section where all cells contain figures or where the data show variation.
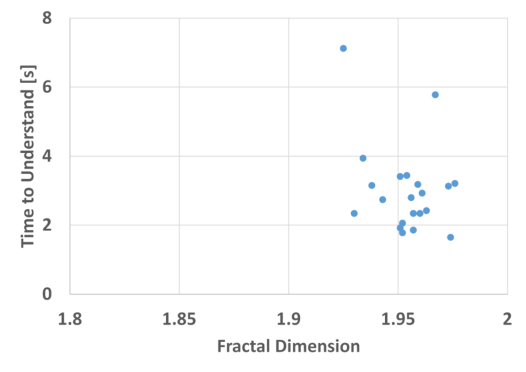
Therefore, we recalculated the fractal dimension shown in Table 3 with set cutoff levels. We set the lower cutoff level to 1/450 and upper cutoff level to 1/30. Table 4 lists the results of the recalculation. Figure 4 shows the relationship between time to understand shown in Table 1 and recalculated fractal dimension shown in Table 4. The correlation coefficient between recalculated fractal dimension and time to understand was −0.316. Figure 4 and this correlation coefficient indicate that there is no linear relationship between recalculated fractal dimension and time to understand.
Figure 5 shows the relationship between percentage of correct answers shown in Table 2 and recalculated fractal dimension shown in Table 4. The correlation coefficient between recalculated fractal dimension and percent- age of correct answers was −0.324. Figure 5 and this correlation coefficient indicate that there is no linear relationship between recalculated fractal dimension and percentage of correct answers.
We could not find any correlation between the fractal dimension of a pictogram and time taken to understand it. We also could not find any corre- lation between the fractal dimension of a pictogram and percentage of correct answers to what the pictogram indicated. We consider this is because that the complexity that humans perceive when looking at a pictogram does not
Attempt to Evaluate Pictogram Complexity Using Fractal Dimension 55
necessarily correspond to the complexity indicated by the fractal dimension. Why this difference occurs should be investigated. We also believe it is nec- essary to investigate the relationship of the fractal dimension of pictograms to other indexes of pictogram-reading time and pictogram correctness.
Figure 4: Relationship between recalculated fractal dimension and time to understand.Figure 5: Relationship between recalculated fractal dimension and percentage of correct answer.
CONCLUSION
We assumed that the fractal dimension of a pictogram is one of indexes that represents the complexity humans perceive when they see a pictogram. We also assumed that the more complex the pictogram, the longer it would take to understand. We assumed a monotonically increasing relationship between the fractal dimension of a pictogram and time it takes to understand the pictogram and investigated the relationship between the two.
56 Kosaka and Ikeguchi
The results indicate no correlation between the fractal dimension of a pictogram and time to understand the pictogram. We then investigated the relationship between the percentage of correct answers regarding the mean- ing of a pictogram and the fractal dimension of that pictogram but found no correlation between the two. Finally, we recalculated the fractal dimension with cutoff levels to increase the accuracy of the calculation and examined the relationship with the time to understand and found no correlation between the two.
We assume that compared to kanji, pictograms are understood much dif- ferently by people, and this difference caused one of the reasons why the correlations mentioned above did not occur. It is required to examine the rela- tionship between the subjective rating of human complexity for pictograms and the value of fractal dimension. We also assume that the value of frac- tal dimension does not necessarily correspond to an assessment of subjective pictogram complexity. In order to create an index of human perceived com- plexity for a pictogram, it is considered necessary to make some correction when calculating the fractal dimension. For example, it is possible to calculate the fractal dimension of an image in which only the contour of the pictogram is extracted.
Future work includes examining the relationship between other indexes and fractal dimension, for example, investigating the relationship between a person’s gazing position when looking at a pictogram and the fractal order of that position. We will also calculate the fractal dimensions of other pictograms to investigate the characteristics of fractal dimension in pictograms.
REFERENCES
Benoît Mandelbrot. (1982). “The Fractal Geometry of Nature”, New York: W. H.
Freeman and Co. Forsythe A., Nadal M., Sheehy N., Cela-Conde C. J. and Sawey M. (2011). Predicting beauty: Fractal Dimension and Visual Complexity in Art, Br. J. Psychol. No. 102. John D. Corbit and David J. Garbary. (1995). Fractal Dimension as a Quantitative
Measure of Complexity in Plant Development, Biological Sciences, Volume 262, Issue 1363. Kazuya Saito, Noriyoshi Tsuchiya and Katsuto Nakatsuka (1997) Development of Computer Software to Calculate Fractal Dimension Using the Box-counting Method and Its Analytical Precision, Geoinformatics, Volume 8, No. 1. (In Japanese). Morihiro Ohta and Ken Yamamoto (2019) Statistical Law Related to Shape of Kanji,
Proceedings of the Language Resource Utilization Workshop, Tokyo, Japan. (In Japanese). Tatsuya Sakabe and Hiroaki Kosaka (2023) Attempt to Develop Analysis Model of Reader’s Pictogram Understanding Process, Proceedings of 14th International Conference on Applied Human Factors and Ergonomics, San Francisco, Vol. 73. Yukio Ohta. (1995). “Story of Pictogram”, Tokyo: Japanese Standards Association.
(In Japanese).
LISTED IN THE AHFE DIGITAL BOOKSTORE CATALOGUE
Explore the complete digital volume
Ergonomics In Design
Read this individual research paper free through the original publisher, or explore the full digital proceedings book.
ISBN 978-1-964867-05-2
Explore this ISBN in the AHFE Bookstore ↗Listed in the July 2026 bookstore catalogue; search by ISBN to confirm current availability · Digital book purchase optional