Gaby Shi, Kit Lun Yick (2024). Evaluating the Impact of Prosthetics on Gait Symmetry in Unilateral Lower Limb Amputees. In: Human Dynamics, Product Evaluation and Quality. AHFE Open Access, vol. 131, pp. 81–89. https://doi.org/10.54941/ahfe1004866
Gait symmetry is a primary criterion for assessing the rehabilitation progress of unilateral transtibial amputees with prostheses. This study aimed to examine the gait symmetry of dynamic kinematic and kinetic functions in unilateral transtibial amputees using prostheses during walking. Methods The study was approved by the University Ethics Committee and involved five (3 females and 2 males) unilateral transtibial amputees (age: (mean ± SD) 63.4 ± 7.7 years, height: 165.6 ± 6.4 cm; body mass: 69.4 ± 4.1 kg; years of using prosthetic foot: 30.8 ± 9.3 years). For collecting the kinematic and kinetic data, thirty-nine passive-reflective markers were placed on the participant according to the landmarks set of the plug-in full body model. An 8-camera motion capturing system (VICON, Nexus 2.0 Inc., Oxford, UK) and 2 force plates (AMTI, Advanced Mechanical Technology, Inc., Watertown, USA) mounted under the walkway were recorded 100 frames per second simultaneously. All the systems were calibrated before the experiment. Participants walked at their self-selected walking speeds. Based on their self-selected walking speed record, ± 10% range were calculated as the references for each participant’s fast and slow walking speed. Each participant repeated walking trials until a minimum of 5 “clean” foot force plate contact with both right and left limbs were acquired. The corresponding data from 5 gait cycles were selected to calculate the lower limb joints angles and vertical ground reaction force (GRF) during walk. Then symmetry index (SI) was calculated to provide a descriptive marker for the degree of symmetry between the intact and residual limbs. A value of SI less than 5% reflects good symmetry between the limbs, whereas increasingly positive values indicate the value for the residual limb was greater than that of the intact limb, while negative values denote that the intact limb value was greater. Results Normalized vertical GRF of two limbs increased with increased walking speeds. The corresponding SI was the largest when heel strike with slow walking speed (6.2 ± 0.8 m/s). Gait imbalance was observed during loading response and midstance (around 30% - 45% stance phase) when the walking speed was increased. While SI values of ankle angles were enlarged with increased walking speed, indicating more asymmetry of ankle angle between two limbs with their traditional prostheses when the walking speed increases. Conclusions The current prostheses can only support the basic daily activities for the unilateral transtibial amputees. The new design of prostheses should therefore focus on kinetic and kinematic parameters such as the symmetry between the residual limb and the intact limb, and energy saving for the amputees during high intensity activities.
Walking is a fundamental aspect of daily life. However, individuals who have undergone unilateral lower extremity amputation experience a significant loss of mobility, leading to inconvenience and hardship. Prosthesis use can disguise the partial or complete loss of a lower limb in appearance, while assisting those with a unilateral lower extremity amputation to walk, engage in daily activities, and maintain a degree of physical movement and self- care (Shi et al., 2023b). Gait symmetry is a primary criterion for evaluating the rehabilitation progress of unilateral transtibial amputees using prosthe- ses (Mattes et al., 2000, Winiarski et al., 2021). The Symmetry Index (SI) is a commonly used parameter and is considered clinically sensitive in the study of spatiotemporal gait parameters (Bła˙zkiewicz and Wit, 2012). Compared to a healthy group, noticeable asymmetry can be observed among amputees with unilateral lower extremity loss (Shi et al., 2023a). Long-term asymme- try can lead to degenerative changes in all joints of the healthy lower limb (Nolan, 2009). Previous studies have used scalar indicators and symbol-based characteristics to assess gait symmetry, including gait parameters and ground reaction force (GRF). However, a single measure cannot provide a compre- hensive understanding of gait symmetry, as the asymmetries in the angle-time characteristics from which these metrics are derived are not well represented by discrete values. There is limited knowledge about gait symmetry in terms of kinematic and kinetic variables in patients’ post-unilateral lower extremity amputation. Therefore, this study aims to use both SI and dynamic symme- try function (SF) parameters to thoroughly assess the symmetric function of unilateral lower limb amputees using their current prosthetics.
Method
To simulate the daily outdoor activities including slow, and fast walking speed for the unilateral residual limb amputees by their own prosthetics, the par- ticipants were invited to visit our laboratory for better understanding the functions of their prosthetics for daily usage. Human subject ethics approval was granted by the University Ethics Committee. Five unilateral transtibial amputees (3 females and 2 males) were recruited in this study. Table 1 shows the information of the recruited amputees.
Table 1. Recruited Amputees’ information.
Table available in the original PDF paper.
Subject No. 1 2 3 4 5 Mean (SD) Gender F F F M M Age (years) 64 62 50 69 67 62.4 (7.4) Body mass (kg) 67.8 50.8 69.8 63.5 75 65.4 (9.1) Height (cm) 160 148 159 165 174 161.2 (9.5) Residual limb side R R R L R Years of using prosthetic foot 40 2 19 40 25 25.2 (15.9) Prosthetic foot level K3 K2 K3 K3 K3 Average daily walking speed (km/h) 3.4 3.5 3.6 3.7 3.8 3.7 (0.4)
Note: F indicates female; M indicates male.
Evaluating the Impact of Prosthetics on Gait Symmetry 83
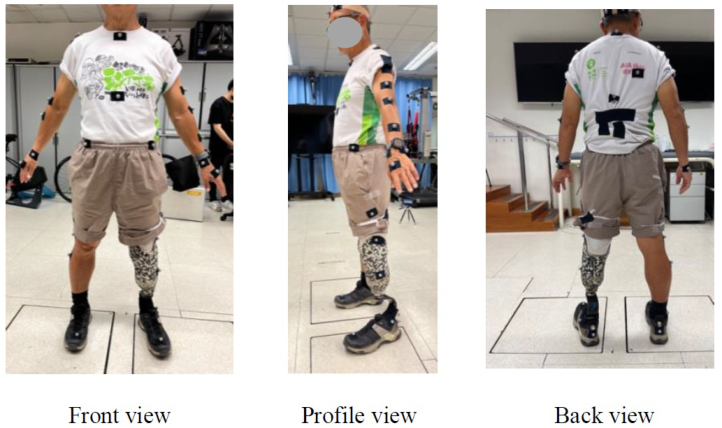
The normalized GRF and kinematic data of lower limb joints were also acquired from motion capturing system (VICON, Nexus 2.0 Inc., Oxford, UK), and 2 force plates (AMTI, Advanced Mechanical Technology, Inc., Watertown, USA) respectively. Thirty-nine passive-reflective markers of 14 mm in diameter were placed on the participant (Figure 1) according to the landmarks set of the plug-in full body model (Haddas et al., 2018). An 8-camera motion capturing system (VICON, Nexus 2.0 Inc., Oxford, UK) and 2 force plates (AMTI, Advanced Mechanical Technology, Inc., Water- town, USA) mounted under the walkway were utilized for gait analysis and recorded 100 frames per second simultaneously. All the systems were calibrated before the experiment.
Figure 1: Land markers attached on the participant.
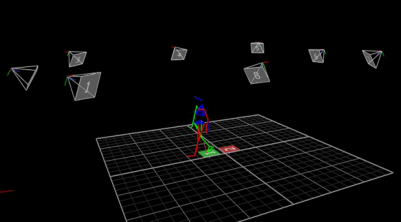
Then the participant walked on the force plate at a self-selected walking speed to perform his/her normal gait (Lu et al., 2015) and the foot would land on the force plate naturally (Sawacha et al., 2009). Their average self-selected walking speed was 3.7 ± 0.4 km/h. Based on their self-selected walking speed record, ± 10% range were calculated as the references for each participant’s fast and slow walking speed. Their averaged fast and slow walking speed were 4.1 ± 0.5 km/h, and 3.4 ± 0.4 km/h respectively. Each participant repeated walking trials until a minimum of 5 “clean” foot force plate contact with both right and left limbs were acquired (Petrovic et al., 2018, Švehlík et al., 2009). The corresponding data from 5 gait cycles were selected to calculate the angles of lower limb joints and generated GRF during (Figure 2).
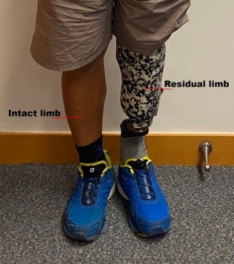
SI was calculated to provide a descriptive marker for the degree of symmetry between the intact (I) and residual (R) limbs (see Figure 3) for normalized GRF by using Equation (1) below (Herzog et al., 1989, Winiarski et al., 2021).
84 Shi and Yick
Figure 2: Amputee’s walking tracked in the Motion capture system.
SI% = (R −I) 0.5 (R + I) ∗100 (1)
Figure 3: Intact limb and residual limb.
However, due to the artificial extreme values occur in the region of zero- crossings, SI% is not suitable for the analysis of joint angles (Siebers et al., 2021, Herzog et al., 1989). To investigate the symmetry of joint angles, the dynamic SF was proposed to provide information on the symmetry in the entire range of motion (t) of lower limb joints by using Equation 2 (Winiarski et al., 2021). All individual gait cycles were averaged first within and then between subjects for the intact and residual limb separately.
SF(t)% = 2 ∗ R(t) −I(t) Range R(t) + Range I(t) ∗100 (2) A value of SI or SF less than 5% reflects good symmetry between the limbs, whereas increasingly positive or negative values indicate increasing asymme- try for a variable in question (Herzog et al., 1989, Forczek and Staszkiewicz, 2012, Sadeghi et al., 2000). In addition, positive values indicate the value for the residual limb was greater than that of the intact limb, while negative values denote that the intact limb value was greater (Winiarski et al., 2019).
Evaluating the Impact of Prosthetics on Gait Symmetry 85
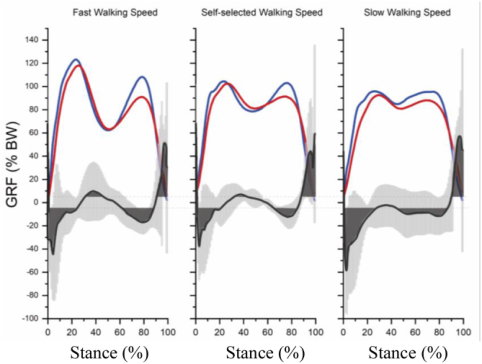
Kinetic symmetry analysis. Figure 4 shows that the normalized GRFs of two limbs were increased with increased walking speeds. The corresponding SI area was the largest during heel strike with slow walking speed (6.2 ± 0.8 m/s). Gait imbalance was observed during loading response and midstance (around 30%–45% stance phase) when the walking speed was increased. Table 2 shows that the maximum values of normalized GRF were higher by the intact limb than the values by the residual limb with three walk- ing speeds. The corresponding negative value of SI reflects the values of intact limb were greater in most of stance phase, while the values of residual limb were greater at toe-off.
Figure 4: The mean of normalized GRF (% body weight (BW)) and the correspond- ing SI (%) (solid dark line) during stance with different walking speeds. Blue and red solid lines indicate the normalized GRF of intact limb and residual limb respectively. Dark solid line indicates SI (%) of two limb sides. Light grey area shows the standard deviations of SI. Dark grey area indicates the SI are more than 5%.Table 2. Mean and ± standard deviation (SD) for the normalized ground reaction force and the corresponding SI%.
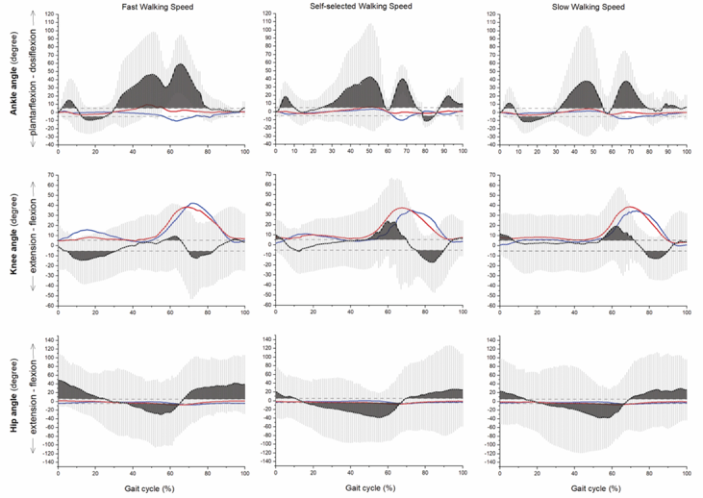
Kinematic symmetry analysis. Figure 5 shows that the SF values and areas of ankle angles were enlarged with increased walking speed, indicating more asymmetry of ankle angle between two limbs with their traditional prostheses while the walking speed increases.
Figure 5: The mean of range of motion and the corresponding SF (%) (solid dark line) in main low extremity joints characterizing hip flexion-extension, knee flexion-extension and ankle dorsi-plantarflexion during different walking speeds. Blue and red solid lines indicate the joint angles of intact limb and residual limb respectively. Dark solid line indicates SF (%) of two limb sides. Light grey area shows the SD of SF. Dark grey area indicates the SF are more than 5%.
For ankle joint, the values of intact limb were greater during maximum plantarflexion, while the values of residual limb were greater during max- imum dorsiflexion with three walking speeds (see Table 3). For knee and hip joints, the values of intact limb were greater during maximum extension, while the values of residual limb were greater during maximum flexion with three walking speeds.
Evaluating the Impact of Prosthetics on Gait Symmetry 87
Table 3. Mean and ± standard deviation (SD) for the parameters characterizing range of motion (ROM) and the corresponding SF%.
From the thorough assessment on kinetic and kinematic symmetries, the cur- rent prostheses (K2 and K3) can only support the basic daily activities for the unilateral transtibial amputees. The new design of prostheses should there- fore focus on kinetic and kinematic parameters such as the symmetry between the residual limb and the intact limb, and energy saving for the amputees during high intensity activities. The results of this study revealed that the current prostheses can only support the basic daily activities for the unilat- eral transtibial amputees. The study found that the normalized vertical GRF of two limbs increased with increased walking speeds. The corresponding SI was the largest when heel strike with slow walking speed. Gait imbalance was observed during loading response and midstance when the walking speed was increased. The SI values of ankle angles were enlarged with increased walk- ing speed, indicating more asymmetry of ankle angle between two limbs with their traditional prostheses when the walking speed increases. These findings suggest that the current prostheses design may not be sufficient to support the dynamic needs of amputees during high-intensity activities. The pros- theses were found to be more effective at slower walking speeds, but as the speed increased, the gait symmetry decreased, indicating a greater difference in function between the prosthetic and intact limb. This could potentially lead to long-term degenerative changes in the joints of the intact limb due to the increased load and asymmetrical gait pattern. Therefore, the study con- cludes that the design of prostheses should focus on kinetic and kinematic parameters such as the symmetry between the residual limb and the intact limb, and energy saving for the amputees during high-intensity activities. This would involve creating prostheses that can adapt to different walking speeds and provide better support during dynamic activities. This could potentially improve the quality of life for amputees, allowing them to engage in a wider range of activities with greater ease and comfort.
In conclusion, this study provides valuable insights into the limitations of current prostheses designs and highlights the need for more dynamic and adaptable prostheses that can better support the needs of amputees. Future research should focus on developing such prostheses, with a par- ticular emphasis on improving gait symmetry and energy efficiency during high-intensity activities.
ACKNOWLEDGMENT
The authors would like to acknowledge the Innovation and Technology Fund (Project Number: ITS/133/21) for this project, and conference attending fund by The Hong Kong Polytechnic University (Project Number: P0048676).
REFERENCES
Bła˙zkiewicz, M. & Wit, A. 2012. Comparison of sensitivity coefficients for joint angle trajectory between normal and pathological gait. Acta Bioeng. Biomech, 14, 83–91. Forczek, W. & Staszkiewicz, R. 2012. Authors submitted their contribution of the
article to the editorial board. Accepted for printing in. J. Hum. Kinet, 35, 47–57.
Evaluating the Impact of Prosthetics on Gait Symmetry 89
Haddas, R., Ju, K. L., Belanger, T. & Lieberman, I. H. 2018. The use of gait analysis in the assessment of patients afflicted with spinal disorders. European Spine Journal, 27, 1712–1723. Herzog, W., Nigg, B. M., Read, L. J. & Olsson, E. 1989. Asymmetries in ground
reaction force patterns in normal human gait. Med Sci Sports Exerc, 21, 110–114. Lu, Y., Mei, Q. & Gu, Y. 2015. Plantar loading reflects ulceration risks of diabetic foot with toe deformation. BioMed Research International, 2015. Mattes, S. J., Martin, P. E. & Royer, T. D. 2000. Walking symmetry and energy
cost in persons with unilateral transtibial amputations: matching prosthetic and intact limb inertial properties. Archives of physical medicine and rehabilitation, 81, 561–568. Nolan, L. 2009. Lower limb strength in sports-active transtibial amputees. Prosthetics and orthotics international, 33, 230–241. Petrovic, M., Maganaris, C. N., Deschamps, K., Verschueren, S. M., Bowling, F. L.,
Boulton, A. J. & Reeves, N. D. 2018. Altered Achilles tendon function during walking in people with diabetic neuropathy: implications for metabolic energy saving. Journal of applied physiology, 124, 1333–1340. Sadeghi, H., Allard, P., Prince, F. & Labelle, H. 2000. Symmetry and limb dominance in able-bodied gait: a review. Gait & posture, 12, 34–45. Sawacha, Z., Gabriella, G., Cristoferi, G., Guiotto, A., Avogaro, A. & Cobelli, C.
2009. Diabetic gait and posture abnormalities: a biomechanical investigation through three dimensional gait analysis. Clinical biomechanics, 24, 722–728. Shi, Q.-Q., Chan, M.-K., Yick, K.-L., LI, P.-L., Yip, J. & Tse, C.-Y. 2023a. Biomechanical Analysis Of Unilateral Transtibial Amputees Using Prosthetic Foot During Treadmill Walking At Varying Slopes. Medicine and science in sports and exercise., 55, 581–581. Shi, Q.-Q., Yick, K.-L., Wu, J., Huang, X., Tse, C.-Y. & Chan, M.-K. 2023b. A
Scientometric Analysis and Visualization of Prosthetic Foot Research Work: 2000 to 2022. Bioengineering, 10, 1138. Siebers, H. L., Alrawashdeh, W., Betsch, M., Migliorini, F., Hildebrand, F. & Eschweiler, J. 2021. Comparison of different symmetry indices for the quantifica- tion of dynamic joint angles. BMC Sports Science, Medicine and Rehabilitation, 13, 1–11. Švehlík, M., Zwick, E. B., Steinwender, G., Linhart, W. E., Schwingenschuh, P.,
Katschnig, P., Ott, E. & Enzinger, C. 2009. Gait analysis in patients with Parkinson’s disease off dopaminergic therapy. Archives of physical medicine and rehabilitation, 90, 1880–1886. Winiarski, S., Rutkowska-Kucharska, A. & Kowal, M. 2021. Symmetry function–An effective tool for evaluating the gait symmetry of trans-femoral amputees. Gait & Posture, 90, 9–15. Winiarski, S., Rutkowska-Kucharska, A., Pozowski, A. & Aleksandrowicz, K. 2019.
A new method of evaluating the symmetry of movement used to assess the gait of patients after unilateral total hip replacement. Applied bionics and biomechanics, 2019.
LISTED IN THE AHFE DIGITAL BOOKSTORE CATALOGUE
Explore the complete digital volume
Human Dynamics, Product Evaluation and Quality
Read this individual research paper free through the original publisher, or explore the full digital proceedings book.
ISBN 978-1-964867-07-6
Explore this ISBN in the AHFE Bookstore ↗Listed in the July 2026 bookstore catalogue; search by ISBN to confirm current availability · Digital book purchase optional