Emilia Visileanu, Elena Perdum, Laurentiu Dinca, Adrian Salistean, Felicia Dondea, Razvan Scarlat (2024). Advanced materials with infrared camouflage properties. In: Human Factors for Apparel and Textile Engineering. AHFE Open Access, vol. 134, pp. 10–20. https://doi.org/10.54941/ahfe1004910
Nowadays, textile materials with a protective role must ensure the body's defence against a multitude of threats and fulfil a variety of functional requirements. In particular, textile products intended for military applications require durability, resistance to ballistic threats and environmental conditions (eg, ultraviolet (UV) light, moisture, fire, heat and wind), comfort, etc. In addition, these materials must provide camouflage in various ambient conditions at a wide range of wavelengths in the electromagnetic spectrum such as the near-infrared (NIR) region (750–1200 nm) and far infrared (FIR) (3–5 and 8–14 μm).For the experiments, 3 types of yarns were used with a length density of 49.35 x 1 (20.26 /1) Tex (Nm) - 100% cotton yarn, 19.64 x 2 (50.92 / 2) Tex (Nm) - 100% PA yarn and 20.38 x 2 (49.07 /2) Tex (Nm) - 100% PES yarn. Textile structures in plain weave and ripstop weave (Rips I and Rips II) characterized by tear and abrasion resistance were designed and produced on the STB 2-212 weaving machine. After the finishing operation, the 100% cotton textile structure was treated by impregnation with 70 g/l ITOBINDER AG or 70 g/l PERMUTEX after alkaline boiling phases (8 ml/l caustic soda 38 0 Be, 3 g/l carbonic soda, 3 g/l trisodium phosphate, 2 g/l Kemapon PC/LF; 1,5 ml/l Seghion PC/LF), 4 washes, acidulation: 1 ml/l acetic acid (15 min), rinsing, free drying. The Rips I and Rips II variants have been film-coated on one side by scraping with acrylate paste. The printing samples were made by screen printing technology using water-based inks of the NEWTEX TRANSPARENT HD 10 type and Chromatex HD-10 pigments on automatic machines - carousel type, multi-colour, intermediate drying, Alfa Plus. Reflectance indices and curves were determined using a Perkin Elmer Lambda 950 UV-VIS-NIR Spectrophotometer in the wavelength ranges 860-1200 nm and 1000-1200 nm.To characterize the variability of the reflectivity index of 100% cotton textile structures, Rips I and Rips II, specific descriptive statistical methods were used. Histogram and box-plot graphs were plotted.Assessment of colour difference was carried out after light fastness, alkaline sweat, acid sweat, water and wash tests for the predominant colours of the camouflage colour printed fabric variants. The lightfastness test was performed after 100 hours of exposure on the XENOTEST APOLLO JAMES HEAL machine and colour differences were identified on the HunterLab machine. K/S and reflectance/transmittance (R/T) remission curves were drawn. L*, a*, b* parameters were calculated and interpreted in comparison with the control variants and the colours were fitted into trigonometric quadrants after each resistance test.The colour combination for the samples was made using Optitex pattern design and 3D simulation software (Gina 1 and Gina 2). The determination of the average reflectance was carried out by applying a specific procedure. The following were identified: colour designator, range of colour reflectance, the proportion of area covered by colour in the investigated area, the area covered by colour in the investigated area. To assess the degree of reflectance of each colour in the whole spectral band (860-1200) the median values were calculated.Regression coefficients have been calculated allowing the calculation of the reflectance index at any wavelength in the measured range. In the wavelength range 860-1200 nm all colours in the Gina 1 and Gina 2 structure show reflectance indices between -2.82% (black colour - Gina 2) and 57.68% (green colour - Gina 2). The exception is the beige colour with 92.36% (Gina 1) and 76.49% (Gina 2). In the wavelength range 1000-1200 nm, only the beige colour shows reflectance values >70%, respectively: 89.98% (Gina 1) and 74.25% (Gina 2).The weighted average values of the total reflectance index as a function of the weight of colours in the structures are very good with values <70%, respectively: 35.62% (Gina 1) and 31.48% (Gina 2) in the wavelength range 860-1200 nm and 35.30% (Gina 1) and 32.70% (Gina 2) in the wavelength range 1000-1200 nm.
Nowadays, textile materials with a protective role must ensure the body’s defence against a multitude of threats and fulfil a variety of functional requirements. In particular, textile products intended for military applications require durability, resistance to ballistic threats and environmental conditions (e.g., ultraviolet (UV) light, moisture, fire, heat and wind), comfort, etc. In addition, these materials must provide camouflage in various ambient con- ditions at a wide range of wavelengths in the electromagnetic spectrum such
Advanced Materials With Infrared Camouflage Properties 11
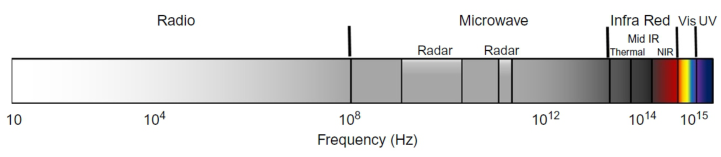
as the near-infrared (NIR) region (750–1200 nm) and far infrared (FIR) (3–5 and 8–14 µm) (Fig. 1) [Degenstein, L.M 2021].
Contemporary camouflage aims to dissipate the outline of the object and reduce the contrast between it and the surrounding environment in the visible spectrum, extending from the near-infrared (NIR) spectrum to the thermal spectrum. In some contexts, a specific type of camouflage is required to ensure proper object concealment [ScienceDirect.com].
Figure 1: The electromagnetic spectrum from radio waves to UV light.
The general requirements for camouflage are presented and can be ensured at certain frequencies or wavelengths [Camouflage Fabric Fabric for Today’s Competitive Era, 2021/12].
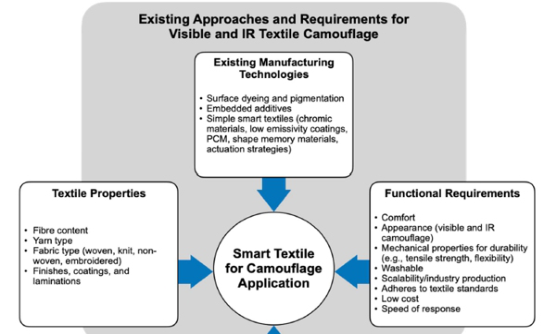
Traditionally, the textiles used in the military field were made from cot- ton fabrics, which would later be mixed with synthetic fibers, such as nylon, in order to reduce weight and speed up drying time. As fiber manufacturing technology has evolved, high-performance fibers such as para-aramids and ultra-high molecular weight polyethene (UHMWPE) have been introduced to provide ballistic protection. Intelligent camouflage textiles are made through technologies that present both advantages and limitations (Figure 2): chromic materials contain various stimuli that produce color change but show low resistance to washing and light [Degenstein, 2021]; phase change materi- als with thermoregulation effect with risk breakage of microcapsules, shape memory materials that have the ability to reconfigure between the original and the deformed shape, have a good shape memory at low temperature, can be processed into fibers, films and membranes but the response is very slow.
Figure 2: Camouflage technologies for smart textiles.
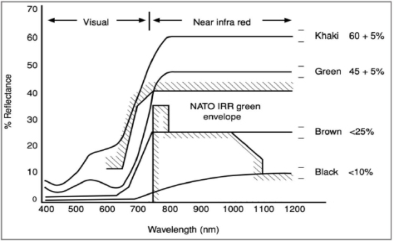
Visible camouflage in military fabrics is generally achieved using col- ors and patterns that resemble the color, intensity, pattern, texture, and appearance of a soldier’s natural or artificial environment through dye- ing or pigmenting techniques. The color parameters of CIE (Commission International de l’Eclairage) dyed or pigmented fabrics are measured using spectrophotometers, which identify colors based on brightness, red/green and yellow/blue values and its reflective properties. Textiles must also be dyed using NIR-reflecting dyes or pigments to match the reflectance curves or “chlorophyll growth” of vegetation in the NIR range. Spectral reflectance curves for colors often associated with camouflage range from <10% (black), <25% (brown), 45±5% (green) and 60±5% for light green/khaki dyes [Gupta, 2001]. While tolerance levels for reflectance values to match the colors of natural objects can be specified by military authorities, the syn- thesis, formulations and specific applications of dyes have remained largely confidential due to the sensitive nature of IR camouflage research [Wake, 1993].
Figure 3: Four-color spectral reflectance curves.
METHODS AND MATERIALS For the experiments, 3 types of yarns were used with a length density of 49.35 × 1 (20.26/1) Tex (Nm) - 100% cotton yarn, 19.64 × 2 (50.92/2) Tex (Nm) - 100% PA yarn and 20.38 × 2 (49.07 /2) Tex (Nm) - 100% PES yarn with main characteristics presented in Tab. 1.
Table 1. Yarn characteristics.
Table available in the original PDF paper.
Characteristics PA Yarn 100% PES Yarn
100% Cotton Yarn Length density Tex (Nm) 49,35x1 (20,26/1) 19,64x2 (50,92/2) 20,38x2 (49,07/2) dtex (den) 493,5x1 (444,15x1) - - Cv% 1,85 5,19 3,25 Maximum force N 29,80 13,51 4,25 Cv% 3,35 6,38 5,52 Elongation at maximum force % 27,05 15,15 6,68 Cv% 6,04 4,76 7,35 Twist t/m The yarn has adhesion points 729 769 Cv% - 6,03 7,92 Twist direction - - Z Z
Advanced Materials With Infrared Camouflage Properties 13
Textile structures in plain weave and ripstop weave (Rips I and Rips II) characterized by tear and abrasion resistance were designed and produced on the STB 2–180 weaving machine.
The raw fabrics were cleaned and washed on the laboratory equipment REDKROME for the preparation and dyeing of textile materials; scarf impregnation module with 2 vertical/ horizontal oscillating waves model BVHP 500/100 (Roaches International LTD); drying/ condensing/ thermoset- ting/ vaporizing module, model TFO/S 500 mm, according to the phases and recipes presented in Tab. 2.
Table 2. Textile finising.
Table available in the original PDF paper.
100% Cotton Woven Structure Rips I (Cotton/Pes) si Rips II (Cotton/Pes/PA) Woven Structures Alkaline boiling Recipe: Boiled and blanched at the same time Recipe: 8ml/l Sodium hydroxyde 38
Be 3g/l Trisodium phosphate 3g/l Sodium carbonate 2ml/l KEMAXIL 20ml/l Hydrogen peroxide Time: 90 min at 98
C Spalari:
Time: 60 min at 95
C 15 min at 95
C 15 min at 70
C 15 min at 50
C 10 min at 30
C
Washes: 10 min at 90
C 10 min at 70
C 10 min at 50
C 10 min cold water Acidulation:1ml/l acetic acid-15min. Rinsing:15min cold water Squeezing on the padding machine Drying at room temperature Drying at room temperature
The Rips I and Rips II variants have been film-coated on one side by scrap- ing with acrylate paste. Tab. 3 shows the physical-mechanical characteristics of the raw and washed 100% cotton, cotton/PES and cotton/PA/PES fabrics variants.
Table 3. Woven characteristics.
Table available in the original PDF paper.
Characteristic/Variant UM 100% Cotton Rips I Cotton/PES
Rips II Cotton/PES/PA Plain Finished Plain Finished Plain Finished
610 610 310 310 320 320
Mass g/m2 207,62 203,92 216,70 214,48 225,40 224,70 Density U No. of yarns /10cm B 360 360 190 180 200 190
(Continued)
Table 3. Continued Characteristic/Variant UM 100% Cotton Rips I Cotton/PES
Table available in the original PDF paper.
Rips II Cotton/PES/PA Plain Finished Plain Finished Plain Finished
U N 1311,15 1306,07 703,87 711,04 584,10 628,95 Max. force
U % 11,40 12,01 20,80 21,06 23,57 25,16
B 539,97 529,03 441,65 420,57 374,96 408,26 Elongation at max. force
% 29,9 30,9 18,0 11,6 33,0 31,6
B 6,69 6,81 7,80 8,58 9,15 10,96 Thickness mm 0,57 0,56 0,64 0,64 0,63 0,62 Pattern weave Cloth Rips I Rips II Water vapour permeability Air permeability l/m2/s 215,5 85,52 0,0 0,0 79,77 80,09
After the finishing operation, the textile structure made of 100% cotton was treated with ITOBINDER-Acrylate and PERMUTEX-EX-RU-Urethane and the Rips I and Rips II variants were treated by scrubbing with acrylate paste on one side.
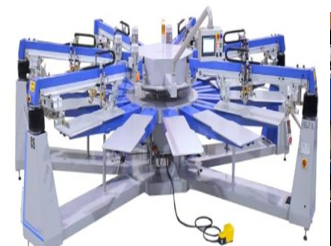
The printing samples were made by screen printing technology using water-based inks of the NEWTEX TRANSPARENT HD 10 type and Chro- matex HD-10 pigments on automatic machines - carousel type, multi-colour, intermediate drying, Alfa Plus (Fig. 5).
Figure 4: a) Carousel machine; b) squeegee.
16 variants of printed textile structures were made, in 6 colours for each of the variants: 100% coton, 100% cotton treated with ITOBINDER AG, 100% cotton treated with PERMUTEX, Filmed Rips I and Filmed Rips II, by using NEWTEX TRANSPARENT HD 10 screen printing inks and Cromatex HD10 pigments in a proportion of 5-8% and applying the following steps:
Equation reproduced from the original PDF.
Dilution: with “C” type ink, for screens with 100–120 mesh.
Reduction: with a binder with specific properties to delay the ink drying process.
Sieve: 120 mesh.
Advanced Materials With Infrared Camouflage Properties 15
Indices and reflection curves were determined using a Perkin Elmer Lambda 950 UV-VIS-NIR Spectrophotometer.
Reflectance indices and curves were determined using a Perkin Elmer Lambda 950 UV-VIS-NIR Spectrophotometer in the wavelength ranges 860–1200 nm and 1000–1200 nm. In Tab. 4 the reflection indices for the 100% cotton variant are presented, the colors red, green, black, and brown at the wavelengths 860–1200 and 100-1200.
Table 4. Reflection indices for the 100% cotton variant.
Table available in the original PDF paper.
Sample Color Weavelength [nm]
Weavelength [nm]
Read Reflection [%]
Read Reflection [%]
100% cotton
860 ÷ 1200 -718.6350 ÷ 495.5013 1000–1200 51-66
Red - 1.1 (sample 1)
-398.2787 ÷ 407.5438 -11-29
Green - 1.2 (sample 2)
-218.3627 ÷ 129.5855 -25-13
Black -1.3 (sample 3)
-260.9640 ÷ 578.5295 -15-24
Brown - 1.4 (sample 4)
In Tab. 5 are presented the reflection indices for the Rips IP version, the colors black, green, black, brown at the wavelengths 860–1200 and 100–1200.
Table 5. Reflection indices for the Rips IP variant.
Table 6 shows the reflection indices for the 100% cotton variant treated with ITOBINDER AG red and green colours at wavelengths 860–1200 and 1000–1200.
Table 6. Reflection indices for the 100% cotton version treated with ITOBINDER AG.
Tab. 7 shows the reflection indices for the 100% cotton variant treated with PERMUTEX, the colors black, green, black, brown at the wavelengths 860–1200 and 100-1200.
Table 7. 100% cotton version treated with PERMUTEX.
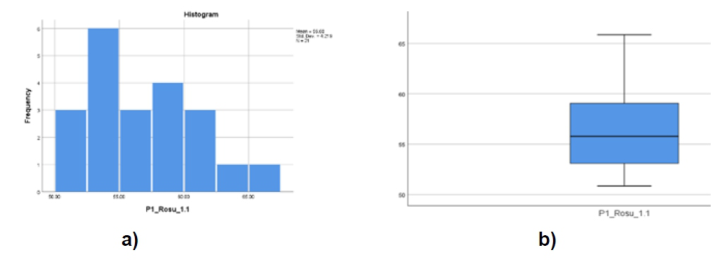
To characterize the variability of the reflectivity index of 100% cotton textile structures, Rips I and Rips II, specific descriptive statistical methods were used. Histogram and box-plot graphs were plotted (Fig. 5-ex.).
Figure 5: a) Histogram b) box-plot.
Assessment of colour difference was carried out after light fastness, alka- line sweat, acid sweat, water and wash tests for the predominant colours of the camouflage colour printed fabric variants. The lightfastness test was per- formed after 100 hours of exposure on the XENOTEST APOLLO JAMES HEAL machine and colour differences were identified on the HunterLab machine.
Advanced Materials With Infrared Camouflage Properties 17
RESULTS AND DISCUSSION
From the analysis of the values of the reflection indices the following aspects result:
Table 4
- for the range of wavelengths 860–1200 nm the values of the reflec- tion index show great variability from 718.6350% red colour to 578.52% brown colour;
- for the 1000–1200 nm range, which is specified in the Product Tech- nical Specifications, the reflection index values are balanced and both the minimum and maximum values are very good, being < 70%.
Table 5
- for the range of wavelengths 860–1200 nm, the values of the reflection index register an aberrant value for the brown colour (-9,999,999 %) and for the rest of the colours they are between -4899% ÷103% (green and brown respectively);
- for the 1000–1200 nm range, which is specified in the Product Tech- nical Specifications, the reflection index values are balanced and both the minimum and maximum values are very good, being < 70%.
Table 6
- for the color red, the reflection read in the range 860–1200 nm is at a proper level, the minimum value being -37.9% and the maximum value being 124.99%; for the range 1000–1200 nm, the reflection values are very good, being between 53-70%;
- for the green color of the reflection read in the range 860–1200 nm, it is within broad limits: 63.3% minimum value and 2818%, maximum value; the minimum value being -37.9%; for the 1000-1200nm range, the reflection values are very good, being between: -18÷22%;
Table 7
- for the color black, the reflection read in the range 860–1200 nm is within the limits of -563.3 nm ÷ 396.5 nm; for the range 1000–1200 nm, the reflection values are very good, being between -33÷16%;
- for the brown color of the reflection read in the range 860-1200nm, it is within wide limits: - 286.7% minimum value and 443.6%, maximum value; for the range 1000–1200 nm, the reflection values are very good, being between -10÷19%.
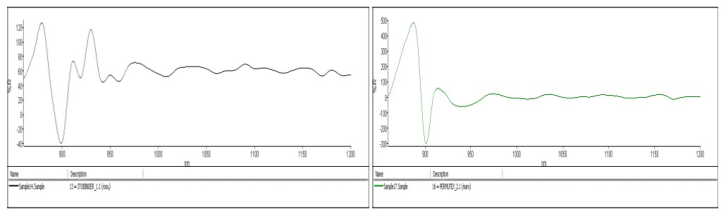
In Fig. 6 examples of reflection curves are presented.
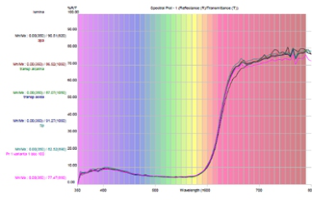
Examples of K/S and reflectance/transmittance (R/T) remission curves are shown in Fig. 7. L*, a*, b* parameters were calculated and interpreted in comparison with the control variants and the colours were fitted into trigonometric quadrants after each resistance test (Tab. 8 and Fig. 7).
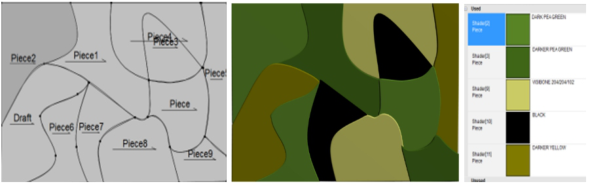
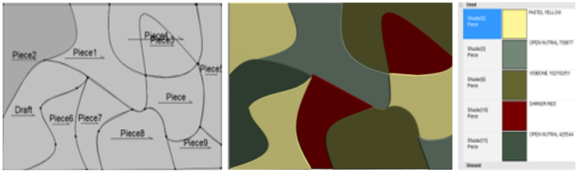
The colour combination for the samples was made using Optitex pattern design and 3D simulation software.
In Fig. 9 and 10 are presented the variants of combinations of designs and colours obtained.
Figure 6: Reflection curves: c. ITOBINDER - Red - 1.1 (sample 13) b) f. Permutex - brown - 2.1 (sample no. 16).Figure 7: K/S and R/T curves - 100% cotton, colour red.Table 8. Colour parameters.
The determination of the average reflectance was carried out by applying a specific procedure. The following were identified: colour designator, range of colour reflectance, proportion of area covered by colour in the investigated area, and area covered by colour in the investigated area. To assess the degree of reflectance of each colour in the whole spectral band (860-1200 nm) the median values were calculated.
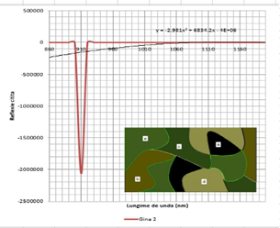
Regression coefficients have been calculated allowing the calculation of the reflectance index at any wavelength in the measured range (Fig. 10). In the wavelength range 860–1200 nm all colours in the G1 and G2 structure show reflectance indices between -2.82% (black colour - G2) and 57.68% (green colour - G2). The exception is the beige colour with 92.36% (G1) and 76.49% (G2). In the wavelength range 1000–1200 nm, only the beige colour shows reflectance values >70%, respectively: 89.98% (G1) and 74.25% (G2).
Advanced Materials With Infrared Camouflage Properties 19
Figure 8: The variant of combinations of designs and colors Gina 1.Figure 9: The variant of combinations of designs and colors Gina 2.Figure 10: Regression curves and equations reflection indices: a. G1 and b. G2.
The weighted average values of the total reflectance index as a func- tion of the weight of colours in the structures are very good with values <70%, respectively: 35.62% (G1) and 31.48% (G2) in the wavelength range 860–1200 nm and 35.30% (G1) and 32.70% (G2) in the wavelength range 1000–1200 nm.
CONCLUSION
The printing of textile samples was carried out by screen printing tech- nology using water-based inks of the NEWTEX TRANSPARENT HD 10 type and Chromatex HD-10 pigments on automatic machines - carousel type, multi-colour, intermediate drying, Alfa Plus.
The colour combination for the samples was made using Optitex pattern design and 3D simulation software (G1 and G2). The determination of the average reflectance was carried out by applying a specific procedure.
In the wavelength range 860–1200 nm all colours in the G1 and G2 struc- ture show reflectance indices between -2.82% (black colour - G1) and 57.68% (green colour - G2).
In the wavelength range 1000–1200 nm, only the beige colour shows reflectance values >70%, respectively: 89.98% (G1) and 74.25% (G2).
The weighted average values of the total reflectance index as a function of the weight of colours in the structures are very good with values <70%, respectively: 35.62% (G1) and 31.48% (G2) in the wavelength range 860–1200 nm and 35.30% (G1) and 32.70% (G2) in the wavelength range 1000–1200 nm.
REFERENCES
Degenstein, L. M.; Sameoto, D.; Hogan, J. D.; Asad, A.; Dolez, P. I. Smart Textiles for Visible and IR Camouflage Application: State-of-the-Art and Microfabrica- tion Path Forward. Micromachines 2021, 12, 773. https://doi.org/10.3390/mi 12070773 Camouflage fabrics – ScienceDirect.com Camouflage Fabric – Fabric for Today’s Competitive Era, 2021/12. Gupta, K. K., et al. (2001). “Camouflage in the Non-Visible Region.” Journal of
Industrial Textiles 31(1): 27–42. Wake, L. V., et al. (1993). Formulating Infrared Coatings for Defence Applications, DSTO Materials Research Laboratory.
LISTED IN THE AHFE DIGITAL BOOKSTORE CATALOGUE
Explore the complete digital volume
Human Factors for Apparel and Textile Engineering
Read this individual research paper free through the original publisher, or explore the full digital proceedings book.
ISBN 978-1-964867-10-6
Explore this ISBN in the AHFE Bookstore ↗Listed in the July 2026 bookstore catalogue; search by ISBN to confirm current availability · Digital book purchase optional