Junya Tatsuno, Iori Hisada, Kazuma Ishimatsu, Hitomi Nakamura, Setsuo Maeda (2024). Considerations of Interior Design in Fully Automated Vehicles: Influence of Front Window Scenery on Ride Comfort and Motion Sickness. In: Advances in Human Factors of Transportation. AHFE Open Access, vol. 148, pp. 234–243. https://doi.org/10.54941/ahfe1005213
This study aims to derive findings applicable to the interior design of fully automated vehicles, focusing on the impact of external scenery information on ride comfort and motion sickness. Experiments were conducted using a driving simulator with three monitors, simulating automatic driving scenarios in two different environments: a suburban road with no buildings (Experiment 1) and an urban setting with buildings along the road (Experiment 2). Participants experienced 60 minutes of travel with moderate whole-body vibration exposure, and reported their perceived discomfort and motion sickness. Two foreground scenery conditions were tested: a three-display condition with all displays turned on, and a two-display condition where participants could not receive visual front window scenery from the center display, which was turned off. The results showed that motion sickness was more induced in the two-display condition in an urban environment. Discomfort results between both conditions were contradictory. Blocking visual scenery from front window during traveling in suburban areas may enhance ride comfort. Meanwhile, in an urban environment surrounded by structures, blocking the visual front window scenery may not only induce motion sickness but also decrease ride comfort.
Conventional human-driven vehicles require a driver with a 360
field of vision to observe the external environment. Meanwhile, fully automated vehi- cles are expected to undergo significant changes in vehicle interior design. Briefly, fully automated vehicles, relying on information from external sen- sors, do not require a wide field of vision. In recent years, illustrations of
Considerations of Interior Design in Fully Automated Vehicles 235
fully automated vehicles have come to be seen, but most seem to be drowned in reproducing old-fashioned fantasies with modern functions. Conversely, what should be considered in the design of a fully-automated vehicle as a transportation has yet to be clarified.
It’s well-known that ride comfort and motion sickness during travel in a vehicle are related to whole-body vibration exposure. The international stan- dard ISO 2631-1 (1997) defines the measurement and evaluation method of whole-body vibration. In addition, occupants’ discomfort varies due to trip duration and the type of activities (e.g., reading, eating, writing, etc.) and many other factors (acoustic noise, temperature, etc.). We reported that par- ticipants’ vibration perception depends on auditory or visual stimuli under the same magnitude of vibration exposure environment, as a result of the driving simulator experiment (Tatsuno et al., 2012).
Therefore, in order to derive findings applied to the interior design of fully automated vehicles, this paper focuses on investigating the effects of external scenery information on ride comfort and motion sickness.
MATERIALS AND METHODS
Experimental Apparatus
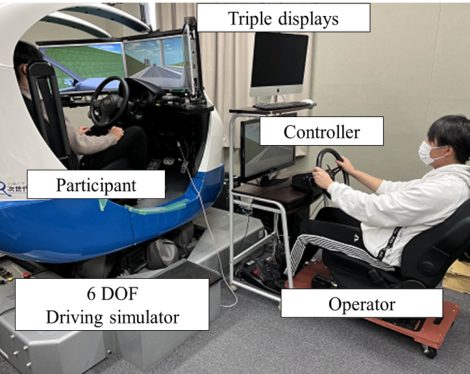
Figure 1 shows the configuration of the experimental apparatus. A six DOF driving simulator (Fuji Heavy Industries, Japan) with three-displays was used for whole-body vibration exposure to participants. Since the participants were exposed to whole-body vibration as passengers in this experiment, the experimenter operated the driving simulator at the speed of 60 km/h with the external controller.
Figure 1: Experimental environment.
Experimental Conditions Two experiments with different course settings were prepared: Experiment 1, where participants drove along a country road with no buildings, and Experiment 2, where participants drove through a town with buildings along the road. The surface design of both experiments was similar. The course is 18 km length and could be utilized as a circuit by virtually connecting the end and the tip of the course. The course has gradual elevation changes and curves and vibration exposure zones approximately every 1 km. Each vibra- tion exposure zone consists of five bumps every 10 meters. The magnitude of the vibration exposure was adjusted by changing the bump height to three different level.
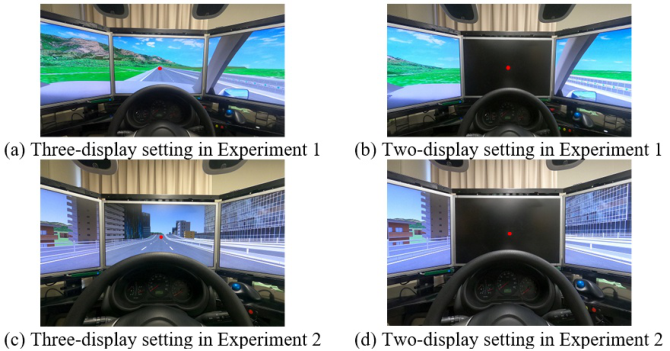
In both experiments, two foreground scenery conditions were established as shown in Figure 2. The first was a three-display condition in which all dis- plays showed images of the outside scenery. This configuration is designed so that participants can view the outside scenery through the front window, sim- ilar to a conventional automobile. The second was a two-display condition in which only the left and right displays supplied images. Some futuristic ren- derings of fully automated vehicles use the front window as an information presenter. This configuration mimics such situations.
Figure 2: Display conditions for each experiment.
Evaluation Methods Participants were asked to participate in both experiments. During about 60 minutes of traveling, the participants were instructed to look at the gaz- ing point on the center display. After passing through each bump section approximately every 1 minute, the participants were asked to answer the subjective discomfort level for whole-body vibration exposure and the illness rating using the scales as shown in Table 1 and 2. In this study, the experiment was terminated if participant’s illness rating became 4 or higher, in order to prevent the worsening of symptoms.
Considerations of Interior Design in Fully Automated Vehicles 237
Table 1. Subjective discomfort level for vibration acceleration, referring to the ISO 2631-1 scale.
Table available in the original PDF paper.
Rating Subjective discomfort 1 Not uncomfortable 2 A little uncomfortable 3 Fairly uncomfortable 4 uncomfortable 5 Very uncomfortable
Table 2. Motion illness rating scale (Griffin et al., 2000).
Table available in the original PDF paper.
Rating Corresponding feelings 0 No symptoms 1 Any symptoms, however slight. 2 Mild symptoms 3 Mild nausea 4 Mild to moderate nausea 5 Moderate nausea but can continue 6 Moderate nausea and want to stop
In the experiment, a second travel session was conducted after the initial one to measure whole-body vibration exposure due to concerns about the potential impact of fixing accelerometers on participants’ comfort. During the second travel, the translation triaxial acceleration on the seat surface was measured using ISO 2631-1.
Participants The trial participants included ten male students with driving licenses for each experiment. So, two experiments were conducted with different partic- ipants. Before the experiment, permission was obtained from the bioethics committee of the Faculty of Engineering, Kindai University. In addition, par- ticipants were instructed that at least one hour should have passed since their last meal, because it was predicted that motion sickness might be induced and symptoms could be aggravated during the experiment.
RESULTS AND DISCUSSIONS Experiment 1
First, let us consider the experimental result when participants drove on a country road with no buildings along the road.
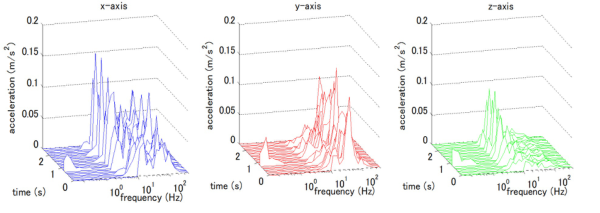
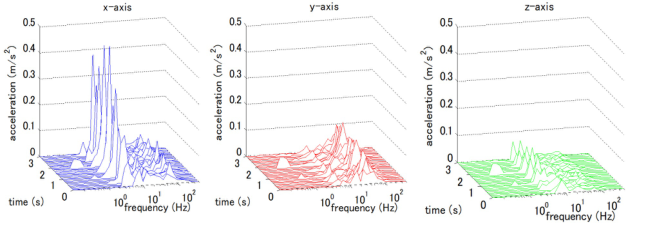
a) Vibration Acceleration Figure 3 illustrates a waterfall graph depicting participant P02 passing bump level 1, serving as a sample of the translational vibration acceleration on the seat surface measured during the second traveling. In the vibration exposure
zone, accelerations from a few hertz to 100 Hz, due to bumps, and accelera- tions of less than 1 Hz, resulting from the longitudinal alignment of the road, were measured.
Figure 3: Waterfall graphs of the translational vibration acceleration on the seat surface measured as participant P02 passed over the level 1 bumps in Experiment 1.
The vibration total values of the translation triaxial acceleration on the seat surface were calculated using the following equation.
1 2 (1)
2awx2 + ky 2awy2 + kz 2awz2)
av = (kx where, awx, awy, awz are the weighted r.m.s. acceleration measured during the passage of bumps, and kx, ky, kz are multiplying factors. When evaluating seating comfort, all kx, ky and kz are set to 1. Table 3 shows the mean of the vibration total value for each bump level. Referring to the results of a previous study where measurements were taken on an automobile manufacturer’s test course (Tatsuno et al., 2012b), it was confirmed that such magnitudes could occur during daily driving.
On the other hand, the Motion Sickness Dose Value (MSDV) is defined in ISO 2631-1. While ISO 2631-1 provides a description for the evaluation of seasickness, its application to other vehicles, such as automobiles or trains, could be challenging (Bando et al., 2021) (Suzuki et al., 2005). Therefore, this study did not address MSDV.
Table 3. Vibration total values in Experiment 1.
Table available in the original PDF paper.
Level av (m/s2) 1 0.076±0.014 2 0.140±0.030 3 0.218±0.044
b) Illness Rating Nine of the ten participants in this experiment responded 0 (no symptoms) from the beginning to the end of the experiment. The remaining partici- pant answered 1(Any symptoms, however slight) or 3 (Mild nausea) several
Considerations of Interior Design in Fully Automated Vehicles 239
times. These results mean that the vibrations exposed to participants during traveling in this experiment induced very little motion sickness.
c) Subjective Discomfort All participants in the experiment responded to the discomfort level 57 times (= 3 levels (bump height) x 19 repetitions) during each traveling. Since there were 10 participants in the experiment, the total responses for each condition was 570 (= 10 participants x 57 times/person). The frequency distribution of discomfort responses for each condition is summarized in Table 4.
Table 4. Frequency distribution matrix in Experiment 1.
Table available in the original PDF paper.
4 Uncomfortable
Condition Level 1 Not uncomfortable
2 A little uncomfortable
3 Fairly uncomfortable
5 Very uncom- fortable
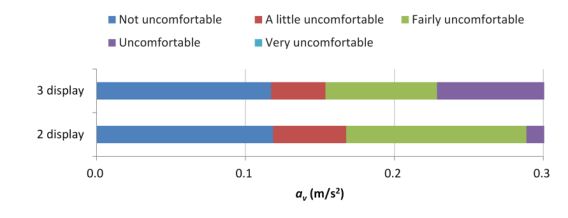
1 124 46 9 10 1 3 display 2 32 91 39 20 8 3 2 32 60 57 39 1 146 26 18 0 0 2 display 2 66 59 53 12 0 3 10 61 50 55 14 Scale construction using the category judgment method (Kaneko et al., 2005) was conducted with the average of the vibration total values shown in Table 3 and the frequency distribution of participants’ discomfort responses. The details of the category judgment method will not be described here. Figure 4 shows the category boundary values calculated for each experimen- tal condition.
Figure 4: Category boundaries in Experiment 1 derived using the category judgment method.
Comparing these results, the boundary values for the three-display condi- tion were lower than those for the two-display condition. In particular, there is a marked difference between the boundary values of ‘A little uncomfort- able’ and ‘Fairly uncomfortable’, as well as between ‘Fairly uncomfortable’ and ‘Uncomfortable’. This suggests that the three-display condition made participants less uncomfortable than the two-display condition. The reason for this result is assumed to be that the visual vibration information from the central display in the three-display condition has a stronger effect on the perception of the vibration.
Experiment 2 Next, let us report the result of Experiment 2 where participants drove through a town with buildings along the road.
a) Vibration Acceleration Figure 5 shows a waterfall graph when participant P05 passed the level 2 of bumps. As in Experiment 1, in the vibration exposure section, participants were exposed to vibrations from a few hertz to 100 Hz and vibrations of less than 1 Hz.
Figure 5: Waterfall graphs of the translational vibration acceleration on the seat surface measured as participant P03 passed over the level 3 bumps in Experiment 2.Table 5. Vibration total values in Experiment 1.
Table available in the original PDF paper.
Level av (m/s2) 1 0.082±0.012 2 0.147±0.025 3 0.268±0.045
Table 5 shows the average of the vibration total values of the translation triaxial acceleration on the seat surface. A minor difference is observed at bump level 3 in comparison to Experiment 1, is attributed to updates in the driving simulator software.
b) Illness Rating While half of the participants in the experiment reported 0 (No symptoms) in both conditions, the illness ratings of the other half of the participants varied between 1 and 4. As mentioned above, when the illness rating reached 4, the experiment was terminated even if the elapsed duration was less than 60 minutes. Actually, the experiments in the two-display condition for two participants were terminated.
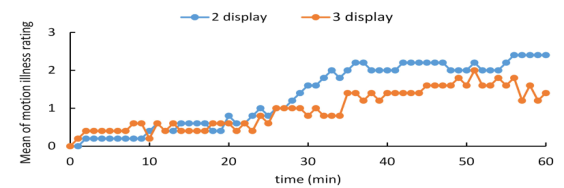
Figure 6 shows the mean change in the illness rating for each condition. The mean values increased with time in each condition. The illness rating in the two-display condition was higher than that in the three-display condition.
Considerations of Interior Design in Fully Automated Vehicles 241
Figure 6: Time-series data depicting the mean change in illness rating.
c) Subjective Discomfort Table 6 shows the frequency distribution of discomfort responses in Exper- iment 2. As mentioned earlier, in Experiment 2, two participants were dis- continued from the experiment according to the results of their responses for motion sickness. Therefore, the total number of responses for the discomfort level in the two-display condition became slightly lower.
Table 6. Frequency distribution matrix in Experiments 2.
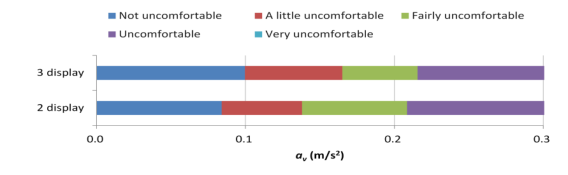
Similar to Experiment 1, scale construction was conducted using the results of vibration acceleration measurements (Table 5) and participants’ discom- fort responses (Table 6). Figure 7 illustrates the category boundary values for both condition in Experiment 2. Comparing these results, the boundary val- ues for the two-display condition are lower than those for the three-display condition. This means that the three-display condition is less uncomfortable than the two-display condition.
Figure 7: Category boundaries in Experiment 2 derived using the category judgment method.
DISCUSSIONS In Experiment 1, where no buildings were placed along the road, the degree of motion sickness kept 0 (No symptoms) for most participants. The category judgment results revealed that the boundary values for the three-display con- dition were lower than those for the two-display condition, indicating that participants in the three-display condition were more likely to perceive the vibration as uncomfortable. In contrast, Experiment 2, in which the buildings were placed along the road, induced motion sickness in half of the partici- pants. Interestingly, symmetrically to Experiment 1, the boundary value for the two-display condition was lower than that for the three-display condition. Since all participants experienced the same physical vibration, the observed differences in results were attributed to differences in visual information.
The general theory of motion sickness (Reason et al., 1975) can be applied to the observed result that the two-display environment in Experiment 2 induced more motion sickness more than the three-display environment. In the two-display environment, participants received lateral image flow from the left and right displays. Consequently, the discrepancy between the ver- tical oscillation perceived by the semicircular canals and the lateral flow perceived by the sense of sight resulted in the generation of motion sickness among participants. Conversely, in the three-display environment, vertical oscillation synchronized with mechanical vibration was stimulated on the central monitor. Thus, it was considered that sensory discrepancies were less likely to occur. Previously, Diels et al. (2013) reported that visual stimuli could influence motion sickness symptoms in experimental participants, and Griffin et al. (2005) found that restricting the field of vision worsened motion sickness symptoms.
As for ride comfort, in Experiment 1, the visual stimuli synchronized with the vibration from the central monitor could increase the perception of vibra- tion. Conversely, in Experiment 2, the visual stimuli from the central monitor weakened the perception of vibration.
As mentioned above, since the participants in Experiment 1 and Exper- iment 2 were different, we cannot deny the possibility that this was due to the characteristics of the participants. In order to conduct a full-scale study of motion sickness in the future, it is necessary to collect experiment participants who are easily intoxicated.
In summary, during traveling in suburban areas such as in Experiment 1, motion sickness does not occur to a great extent, and blocking visual scenery from front window may enhance ride comfort. On the other hand, in an urban environment surrounded by structures, such as in Experiment 2, block- ing the visual front window scenery may not only induce motion sickness but also decrease ride comfort.
When vehicles with automatic driving functions of Level 3 or higher become widely available, the time spent on tasks within vehicles is expected to increase. Some media predictions indicate the front window will serve as an information presentation device. The experimental results from this study suggest that preventing motion sickness and maintaining ride comfort may be achievable by implementing a system that can adapt to the driving envi- ronment. In the next step of the study, we plan to investigate the design of
Considerations of Interior Design in Fully Automated Vehicles 243
the interior of fully automated vehicles to enhance work performance within the vehicle.
CONCLUSION
We aim to establish guidelines for the interior design of a fully automated vehicle. As the first step in this study, experiments were conducted in a driving simulator environment to investigate the effect of front window scenery on subjective responses regarding ride comfort and motion sickness.
The results of the experiment suggested that participants’ subjective responses for evaluating ride comfort and motion sickness were significantly affected by the visual stimuli. During traveling in suburban areas, less motion sickness occurs, and blocking visual scenery from front window may enhance ride comfort. On the other hand, in an urban environment surrounded by structures blocking the visual front window scenery may not only induce motion sickness but also decrease ride comfort.
In the next phase of the study, we plan to explore the interior design of fully automated vehicles to enhance in-vehicle work performance.
ACKNOWLEDGMENT
This work was partially supported by JSPS KAKENHI Grant Number 23K11752.
REFERENCES
Bando, S., Shiogai, Y., Hirao, A. (2021). Development of Evaluating Methods for Passenger’s Motion Sickness in Real Driving Environment, International Journal of Automotive Engineering, Volume 12, Issue 2. Diels, D., Howarth, P. A. (2013). Frequency Characteristics of Visually Induced
Motion Sickness, Human factors, Vol. 55, No. 3, pp. 595–604. Griffin, M. J., Howarth, H. V. C. (2000) Motion sickness history questionnaire, Southampton, England: University of Southampton; ISVR Technical Report No. 283. Griffin, M. J., Newman, M. M. (2004). Visual field effects on motion sickness in cars.
Aviation, Space, and Environmental Medicine, 75(9), pp. 739–748 International Organization for Standardization, (1997) Mechanical vibration and shock – Evaluation of human exposure to whole-body vibration – Part1: General requirements. ISO 2631-1 Kaneko, C., Hagiwara, T., Maeda, S. (2005). Evaluation of Whole-Body Vibration
by the Category Judgment Method, Industrial Health, Vol. 43. Reason, J. T., Brand, J. J. (1975). Motion sickness. Academic Press. Suzuki, H., Shiroto, H., Tezuka, K. (2005). Low frequency vibration influencing motion sickness in trains, Quarterly Report of RTRI, Volume 58, Issue 1. Tatsuno, J., Tsuchiya, K., Nakamura, H., Yonehara, M., Takehara, S., Maeda, S.
(2012). Effect of visual and auditory stimuli on human response to whole- body vibration, Proceedings of the 41st International Congress and Exposition on Noise Control Engineering (inter-noise 2012), Paper No. 415, New York, NY. Tatsuno, J., Tsuchiya, K., Yonehara, M., Nakamura, H., Takehara, S., Maeda, S.
(2012b) Relationship between whole-body vibration exposure and seat location in automobile, Proceedings of 20th Japan Conference on Human Response to Vibration (JCHRV2012), pp. 62–69.
LISTED IN THE AHFE DIGITAL BOOKSTORE CATALOGUE
Explore the complete digital volume
Advances in Human Factors of Transportation
Read this individual research paper free through the original publisher, or explore the full digital proceedings book.
ISBN 978-1-964867-24-3
Explore this ISBN in the AHFE Bookstore ↗Listed in the July 2026 bookstore catalogue; search by ISBN to confirm current availability · Digital book purchase optional