Barbara Metz, Johanna Wörle, Alexandra Neukum (2024). An online-survey on user expectations and mental model of automated driving: The effects of automation description and technology readiness. In: Advances in Human Factors of Transportation. AHFE Open Access, vol. 148, pp. 244–253. https://doi.org/10.54941/ahfe1005214
The European Hi-Drive project (https://www.hi-drive.eu/) is dedicated to overcoming the technological and societal challenges associated with the successful deployment of Automated Driving (AD). Hereby, a key focus is on creating user-friendly AD systems that prioritize driver safety. To better understand user’s mental models of AD as well as their expectations regarding system features, a questionnaire was developed within the project. In this questionnaire, respondents are presented with statements about AD and tasked with determining the accuracy of each statement. Additionally, participants are asked to indicate their confidence level in their judgment. The questionnaire was applied in an online survey including 211 participants. The survey compared two widely used taxonomies of Driving Automation (i.e., by SAE and BASt) as the basic description of AD. Participants were categorized into three groups based on their responses to a technology readiness questionnaire. Participants showing a high level of technology readiness were younger and indicated a higher level of experience with on-market ADAS. Furthermore, they showed a better understanding of AD and an overall more favorable evaluation of AD. There was not difference in the understanding of AD between the group who was instructed with the SAE taxonomy and the BASt taxonomy. While both descriptions effectively conveyed a foundational understanding of automated driving, they fell short in adequately communicating AD handling. Especially, items dealing with activation / deactivation and availability of AD and split of responsibility between AD and driver showed a low proportion of correct answers. If it comes to the expectation towards AD as well as its potentials, the majority of user expected AD to include features like stop and go traffic or automated lane changes. The expectations of participants were ambiguous about the AD being able to handle complex road infrastructure and they did not expect AD to operate in high speeds or adverse weather. The implications of the results are discussed for AD development and especially user training of AD. User expectations and their mental model of AD should be the basis for the development of scientifically sound user education of AD. The results of the present survey can help developers of AD to prioritize the most relevant system features based on actual user expectations.
An Online-Survey on User Expectations and Mental Model of Automated Driving 245
INTRODUCTION
Automated Driving (AD) technology promises to make travelling more effi- cient, more convenient, and safer; and to make mobility more accessible (NHTSA, 2020). The European project Hi-Drive (https://www.hi-drive.eu/) addresses still existing challenges for making AD a success. On the one side, it is necessary to address technical challenges to ensure that AD will work continuously in a wide range of driving environments and situations. On the other hand, AD needs to be implemented such that average drivers can under- stand the system easily, handle it safely and are also willing to use it in their daily live. To achieve that, drivers’ expectations and understanding of system capabilities of AD need to be understood. In the literature, such an under- standing of technical systems is referred to as mental model of the system. The mental model is defined as the “reflection of an operator’s knowledge of a system’s purpose, its form and function, and its observed and future system states” (Gaspar, Carney, Shul & Horrey, 2020).
The driver’s mental model of advanced driver assistance system (ADAS) and AD affect how drivers use and how they evaluate a respective system. A high proportion of users of ADAS were found to have an incorrect mental model of the systems in their cars. In a survey on users of ACC, knowl- edge questions on the basic functions and basic purposes of the system were answered correctly by only about half of the user sample (McDonald, Carney & McGehee, 2018). In a series of test track studies with a partially auto- mated driving system, 28% of participants crashed into a conflict object even though eye-tracking analysis showed that they had their eyes on the conflict object. When questioned afterwards why they did not respond, 13% stated that they did not realize the need to intervene. Some drivers were unsure or assumed that the vehicle was able to handle the situation which reflects an automation expectation mismatch (Victor, Tivesten, Gutavsson, Johansson, Sangberg & Ljung 2018).
Many studies deal with the drivers’ mental model of ADAS (Gaspar, Carney, Shul & Horrey, 2020; McDonald, Carney & McGehee, 2018; Forster, Hergeth, Naujoks, Krems & Keinath, 2019, Beggiato & Krems, 2013). Those studies found that the mode of learning to use the system (Forster, Hergeth, Naujoks, Krems & Keinath, 2019) and the level of infor- mation drivers receive about the system’s behavior (Beggiato & Krems, 2013) affect the development of the mental model. Driver’s expectations of the system capabilities depend also on how the system is advertised and on it brand name (Abraham, Seppelt, Mehler & Reimer, 2017). Drivers may have a general mental model of an automated system that is based on the owner’s manual or an introduction by the car dealer and gain an applied mental model that includes more detailed knowledge of specific operational conditions when they experience concrete situations (Seppelt and Victor, 2020).
The more complex an automated system is, the more difficult it is to obtain a complete and correct mental model and the more difficult it is to assess the driver’s mental model. Seppelt and Victor (2020) give an overview of applica- ble measures for the mental model. They state questionnaires on the purpose, process, and performance as well as behavioural measures like monitoring
behaviour, secondary task use or response time to hazards, among others. To date, research has focused on the driver’s general mental model and lower levels of automation or driver assistance systems.
In order to assess the mental model of a level 3 AD (L3-AD) and drivers’ expectations towards such systems, a questionnaire has been developed in Hi-Drive. This questionnaire is tested in an online-survey and the impact of technology readiness on the mental model is investigated. From previous studies it is known that various driver characteristics influence acceptance and evaluation of AD. In a driving simulator study, Metz and Wörle (2021) showed that technology readiness impacts acceptance and usage of AD. Tech- nology readiness is defined as “people’s propensity to embrace and use new technologies for accomplishing goals in home life and work” (p. 308) and is described as a person’s predisposition to use new technologies (Parasuraman, 2000). Technology readiness is positively related to the actual usage of a tech- nology. It is influenced by the age, education and experience of the user, the type of technology and by the actual usage of a particular technology.
Goal of the Study One aim of this study is to assess a 28-item questionnaire on user’s mental model of automated driving. The questionnaire is implemented as an online survey. Two descriptions of L3-AD are used and compared: one is based on the definition of L3-AD from SAE (SAE 2021), the other on the definition of ‘automated mode’, which is comparable to L3 by BASt (BASt, 2022). The SAE description is a more detailed and technical description while the BASt description is explicitly designed for users. For the survey, the SAE figure was translated to German and for the BASt figure, a German version was available.
With respect to ordinary drivers, it is of interest of how to describe an L3-AD in such a way that a correct mental model of system characteristics and limitations develops.
METHODS
Questionnaire An online-survey was implemented in Limesurvey (https://www.limesurvey.org/) including two parts. In the first part, participants answer questions on basic demographic variables as well as four items on their technology readiness based on Parasuraman (2000) and their experience with driver assistance systems and automated driving.
In the second part, participants read either of two automation descriptions and are then asked a series of statements on Level 3 or the ‘automated mode’. Then, participants indicate for each statement whether the statement is cor- rect and how confident they are that answer is correct on a four-point scale. In that part there are 12 items, that refer to actual AD system characteristics that are either correct or incorrect for a L3-system. For those items, the pro- portion of correct answers is calculated. Then, there are additional 12 items that relate to system capabilities that could be inside or outside system ODD
An Online-Survey on User Expectations and Mental Model of Automated Driving 247
and mostly describe technically challenging driving situations (for the ques- tionnaire, please refer to the annex). For that part, it is analyzed how many drivers expect that the different situations are handled by an L3-system. Then, four specific AD implementations are described and the participants should indicate whether those system are a L3 system (SAE) or an automated driv- ing system (BASt) or not. Two of those four system are actual L3 (“Traffic Jam Pilot” and “City Pilot”), one is L2, “Motorway Pilot” and one is L4, “Robo-Taxi”. Here again, the proportion of correct answers is calculated.
Sample The participants were recruited via the WIVW test-driver panel. The link to the online-survey was sent out to the whole WIVW test-driver panel which includes N = 748 persons, of which 268 started filling in the sur- vey. N = 211 participants filled in the complete questionnaire. The survey was conducted between 30.06.2022 and 13.09.2022. The survey took on average 14 minutes to complete with no significant difference between the automation descriptions.
In the following analyses, only those participants with complete data sets are included. N = 107 received a description of L3-AD based on SAE defini- tion, N = 104 based on the definition by BASt. All participants held a valid driver’s license.
The sample is split into three groups based on the average value of tech- nology readiness items (low <3, medium >=3 & <4; high >=4). There is a tendency, that technology readiness level is not split evenly across the two instructions (Pearsons Chi-Square: 5.56, FG = 2, p=0.062). In the group with SAE instruction there are more participants with high technology readi- ness. In the group with the lowest technology readiness, there are significantly more women and in the one with high technology readiness more men (Pear- sons Chi-Square: 44.0, FG = 2, p<0.001). Furthermore, the group with the highest technology readiness report more active experience with parking chauffeur (Pearsons Chi-Square: 16.4, FG = 6, p<0.05), cruise control (CC, Pearsons Chi-Square: 21.8, FG = 8, p<0.01), and active cruise control (ACC, Pearsons Chi-Square: 22.8, FG = 8, p<0.01). Table 1 shows characteristics of the study sample split by technology readiness.
Table 1. Description of study sample.
Table available in the original PDF paper.
Technology Readiness Total Low Medium High
Age [years]
Equations and mathematical formulas are available in the original paper PDF.
Annual mileage [km]
RESULTS
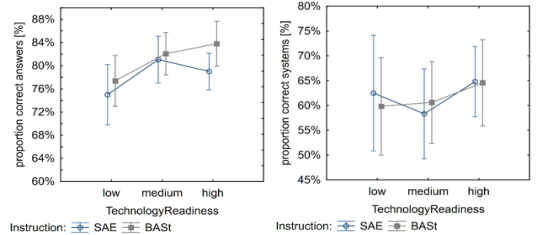
For the proportion of correct answers to mental model questions, there is a significant impact of technology readiness (F(2, 205) = 3.6, p<0.05) but neither an impact of automation description nor a significant interaction. Par- ticipants with high technology readiness have a higher proportion of correct answers (see Figure 1, left). For the items that describe specific implemen- tations of AD, there is neither an impact of automation description nor of technology readiness on the proportion of correct answers (see Figure 1, right). For systems being actual L3-AD, the proportion of correct answers is about 75%, for the two other systems it is close to chance level (Robot-taxi: 57%, L2-highway assist: 42%).
Figure 1: Impact of instruction and technology readiness on proportion of correct answers to mental model questions and to items describing specific systems. The graph shows means and 95%-confidence interval.
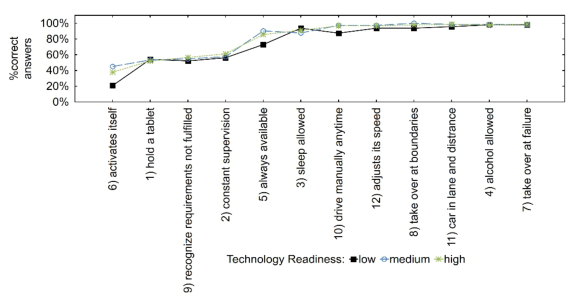
On item level (see Figure 2) it can be shown that there are items with nearly 100% correct answers (“The automated driving system asks me to take over control in case of system failure.” - correct, “While driving in automated mode, I am allowed to have a higher alcohol level (blood alcohol level of 0.5) because the system is taking over the driving task.” – not correct) but also items where the proportion of correct answers is close or even below chance level (e.g. “The automated driving system activates itself as soon as the requirements are met.” – not correct).
Figure 2: Proportion of correct answers on item level, split by technology readiness.
An Online-Survey on User Expectations and Mental Model of Automated Driving 249
Significant differences between levels of technology readiness can be found for “The automated driving system is always available.” – not correct (Pear- sons Chi-Square: 6.9, FG = 2, p<0.05), “The automated driving system activates itself as soon as the requirements are met.” – not correct (Pearsons Chi-Square: 7.5, FG = 2, p<0.05) and “I am able to drive manually anytime even though the requirements for the car to drive in automated mode are ful- filled.”– correct (Pearsons Chi-Square: 6.7, FG = 2, p<0.05). For those items, the proportion of drivers giving the correct answer is significantly lower for drivers with low technology readiness.
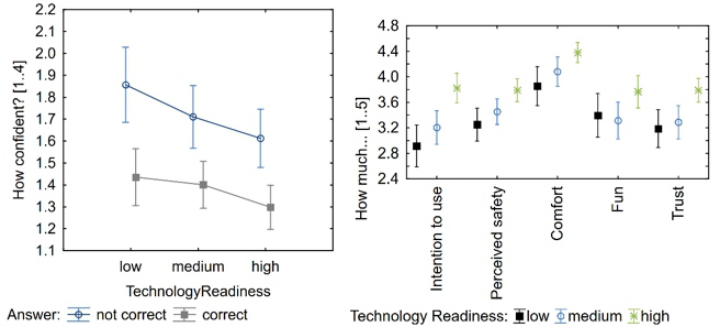
As can be seen in Figure 3 left, participants are more confident that the answer is correct in case they give a correct answer (F(1, 170) = 72.6, p<0.001), and there is a tendency that higher technology readiness is related to a higher confidence in the correctness (F(2, 170) = 2.72, p = 0.068) inde- pendent of whether the answer is actually correct. On item level, differences between levels of technology readiness can be found only for the item “The automated driving system is always available.” (F(2, 208) = 4.4, p<0.05), for all other items the technology readiness does not affect the confidence in the correctness of the answer.
There is a strong impact of technology readiness on the evaluation of L3-AD (see Figure 3 right). Participants with high technology readiness per- ceive L3-AD as safer (F(2, 208)=6.77, p<0.01), more comfortable (F(2, 208)=5.54, p<0.01), more fun (F(2, 208)=3.16, p<0.05) and they express higher trust in the AD (F(2, 208)=7.65, p<0.001) and higher intention to use (F(2, 208)=11.97, p<0.001).
Figure 3: Confidence in the correctness of the answer in the mental model question- naire separate for technology readiness levels and actual correctness of answers (left) and evaluation of AD split by technology readiness level (right). The graph shows means and 95%-confidence interval.
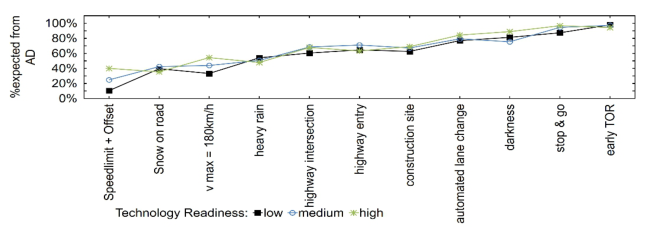
Figure 4 shows the proportion of participants believing that certain situ- ations are handled by an L3-AD. Again, there is a wide range between the different items:
Over 90% of participants believe that the AD will provide early warnings and that it will drive in stop & go situations.
85% of participants expect the AD to do automated lane changes.
About 67% expect the AD to manage challenging infrastructure like highway entries and intersections and construction sites.
About 30% believe that it will be possible to add a certain threshold to the speed limit in order to define the maximum speed of the AD.
For this item there is also a significant impact of technology readiness (Pearsons Chi-Square: 14.2, FG = 2, p<0.001): compared to low technol- ogy readiness drivers with high technology readiness expect more frequently that this feature is implemented in an L3-AD. There are two additional items for which a nearly significant impact of technology readiness can be found: participants with a high technology readiness believe to a larger extent that the AD will drive in darkness (Pearsons Chi-Square: 5.2, FG = 2, p = 0.075) and up to a speed limit of 180 km/h (Pearsons Chi-Square: 5.8, FG = 2, p = 0.054).
Figure 4: Proportion of drivers that believes that a certain feature is included in AD, split by technology readiness.
CONCLUSION
The aim of the presented online survey study was to assess potential users’ mental model and expectations towards L3 automated driving. We did not find any effect of the automation description (SAE vs. BASt) on the mental model even though one description was more technical (SAE) and the other description was designed for user communication (BASt). User characteris- tics, however, affected the mental model: Participants with higher technology readiness have a better mental model for L3-AD and they are more confident in their answers. Furthermore, like described in the literature, younger and male participants describe themselves as being more willing to interact with new technologies and therefore have a higher technology readiness. High technology readiness is related to a higher mileage and a more frequent usage of ADAS.
If we look in more detail on item level, the differences between the groups with varying levels of technology readiness are mainly based on three items that refer to the actual handling of the system. In all other items and in the classification of systems into L3/Automated Driving or not, there is no impact of technology readiness. Taking all that together, it is likely that the better
An Online-Survey on User Expectations and Mental Model of Automated Driving 251
mental model of L3/Automated Driving is not based on a better technolog- ical understanding, but on more experience with ADAS. Users might expect that AD will be similar to ADAS in its handling, meaning, for example, that AD will not always be available, needs to be activated and can be deactivated at all time. Technology readiness impacts the expectation that there will be the option to manually add an offset to the current speed limit and with a ten- dency that the AD will drive in darkness and up to a maximum speed of 180 km/h. These are features that active users of ACC or CC may already know from experience and might therefore expect also from future L3-AD. When it comes to the expectations towards the personal benefits of AD, there is a strong impact of technology readiness. The higher the technology readiness the more positive is the evaluation of L3-AD.
Some of the items on AD capabilities reflect features that are currently not available. The Hi-Drive project aims at enabling certain AD features, for instance snowy roads or merging into traffic on motorway entries. 12 items of the questionnaire aimed at assessing user expectations towards AD. The majority of users do not expect AD to handle speeds higher than the speed limit or high speeds in general. The majority also does not expect AD to be able to operate in adverse weather conditions such as snow or heavy rain. Operating in adverse weather conditions could therefore be regarded as a bonus feature rather than basic AD capability. About half of the sam- ple expects AD to handle special road infrastructure like motorway entries, motorway junctions or construction sites. The majority of the sample expects automated lane changes, driving in darkness and in stop and go traffic to be handled by the AD. Nearly the whole sample expects to be warned early before system limits and system failures.
User expectations should be considered in the design of AD systems: Features that are expected by potential users should be prioritized in the development of AD as they are the basis for user acceptance. Early take- over requests, for example, are expected by almost the whole sample. Even though it was not specified how early an early take-over request occurs, the AD’s HMI should provide an appropriate information and warning strategy. Stop and go traffic is a feature that is actually already included in market- ready AD functions (for example Mercedes’ Drive Pilot) and therefore, it is not surprising that users expect the feature to be included. Complex road infrastructure like motorway entries, motorway junctions or construction sites might be difficult to handle for an AD function. However, about half of the sample expects this feature to be included in the AD capability. If it is not possible for technical reasons to include complex road infrastructures in the ODD, these system boundaries should be carefully communicated to the user. It might be helpful for the building of a correct mental model of the AD function to explain particular system boundaries and how users should react when they face these situations. The user’s technology readiness affects again, which features users expect to be included in the AD function: More users with a high technology readiness expect the AD to work in darkness and at high speeds.
The results from the presented survey can serve as a basis for the design of user education of AD. One key finding is that features of the AD that are related to its handling, how and under what circumstances the AD is activated
and what is expected from the user during the drive, are not understood correctly by potential users. The descriptions by SAE and BASt were not suf- ficient to build a correct mental model on how to use AD. Other forms of user education such as interactive tutorials (Forster, Hergeth, Naujoks, Krems & Keinath, 2019) or videos might be more suitable to transmit knowledge on actual usage. A second key finding is that potential users’ expectations on the capability differ between system features. The third key finding is that users’ expectation towards AD and its features depend on user characteris- tics such as their technology readiness and their experience with ADAS. High technology readiness is related to higher expectations on the AD and these expectations seem to be partly derived from their mental model of ADAS. User education of AD should therefore include graphic material, focus on particular system features that are or are not included in the AD capability and it should be tailored to the expectations and experiences of the user.
ACKNOWLEDGMENT
This project was funded by the European Union’s Horizon 2020 research and innovation program under grant agreement no. 101006664.
ANNEX Item Correct
Y N X 1 While driving in automated mode, I am allowed to hold a tablet in both hands and watch a movie.
X
2 The automated driving system requires my constant supervision. X 3 While driving in automated mode, I am allowed to sleep. X 4 While driving in automated mode, I am allowed to have a higher alcohol level (blood alcohol level of 0.5) because the system is taking over the driving task.
X
5 The automated driving system is always available. X 6 The automated driving system activates itself as soon as the requirements are met. X 7 The automated driving system asks me to take over control in case of system failure. X 8 When the automated driving system detects that the requirements for automated driving are no longer fulfilled, it asks me to take over control.
X 9 I need to be able to recognize myself when the requirements for automated driving mode are no longer fulfilled.
X 10 I am able to drive manually anytime even though the requirements for the car to drive in automated mode are fulfilled.
X 11 The automated driving system keeps the car in the lane and maintains the distance to the car in front.
X 12 The automated driving system can automatically adjust its speed to the current speed limit.
13 I can use the automated driving system in darkness. 14 I can use the automated driving system on roads that are covered with snow. 15 I can ask the automated driving system to exceed the speed limit. 16 The automated driving system can drive up to 180 km/h on roads with no speed limit. 17 The automated driving system is able to navigate constructions on highways with narrow road width. 18 The automated driving system warns the driver ahead of time in case it will reach its limits of its operational design domain. 19 The automated driving system can change the direction of travel at a motorway junction. 20 The automated driving system can perform lane changes automatically on the motorway. 21 The automated driving system is able to operate in stop and go traffic. 22 The automated driving system can enter the motorway and merge into traffic. 23 The automated driving system can operate during heavy rain. 24 The automated driving system is responsible for the drive.
An Online-Survey on User Expectations and Mental Model of Automated Driving 253
REFERENCES
Abraham, H., Seppelt, B., Mehler, B., & Reimer, B. 2017. What’s in a name: Vehicle technology branding & consumer expectations for automation. in Proceedings of the 9th international conference on automotive user interfaces and interactive vehicular applications. BASt. 2022. User communication. What does autonomous driving actually mean?,
Bundesanstalt für Straßenwesen, https://www.bast.de/EN/Automotive_Engineer ing/Subjects/f4-user-communication.html. Beggiato, M. and Krems, J. F. 2013. The evolution of mental model, trust and acceptance of adaptive cruise control in relation to initial information. Transportation research part F: traffic psychology and behaviour, 18, 47–57. Forster, Y., Hergeth, S., Naujoks, F., Krems, J., & Keinath, A. 2019. User Education
in Automated Driving: Owner’s Manual and Interactive Tutorial Support Men- tal Model Formation and Human-Automation Interaction. Information, 10(4), p. 143. Gaspar, J. G., Carney, C., Shul, E., & Horrey, W. 2020. The impact of driver’s mental models of advanced vehicle technologies on safety and performance, AAA Foundation for Traffic Safety, Washington, DC. McDonald, A., Carney, C., and McGehee, D. V. 2018. Vehicle Owners’ Experiences
with and Reactions to Advanced Driver Assistance Systems. AAA Foundation for Traffic Safety: Washington, DC. Metz, B. and Wörle, J. 2021. Technology readiness affects the acceptance of and intention to use an automated driving system after repeated experience. in 13th International Conference on Automotive User Interfaces and Interactive Vehicular Applications. NHTSA, Automated Vehicles for Safety. 2020. https://www.nhtsa.gov/technology-i
nnovation/automated-vehicles-safety Parasuraman, A. 2000. Technology Readiness Index (TRI) a multiple-item scale to measure readiness to embrace new technologies. Journal of service research, 2(4), 307–320. SAE. 2021. J3016: Taxonomy and Definitions for Terms Related to Driving Automa-
tion Systems for On-Road Motor Vehicles. SAE International/ISO: www.sae.org Seppelt, B. and Victor, T. 2020. Driver’s mental model of vehicle automation. Handbook of Human Factors for Automated, Connected, and Intelligent Vehicles, 55–66. Victor, T. W., Tivesten, E., Gutavsson, P., Johansson, J., Sangberg, F., & Ljung Aust,
M. 2018. Automation expectation mismatch: Incorrect prediction despite eyes on threat and hands on wheel. Human factors, 60(8), 1095–1116.
LISTED IN THE AHFE DIGITAL BOOKSTORE CATALOGUE
Explore the complete digital volume
Advances in Human Factors of Transportation
Read this individual research paper free through the original publisher, or explore the full digital proceedings book.
ISBN 978-1-964867-24-3
Explore this ISBN in the AHFE Bookstore ↗Listed in the July 2026 bookstore catalogue; search by ISBN to confirm current availability · Digital book purchase optional