Marianne Karlsson, Mikael Johansson (2024). Understanding drivers' interaction with traffic environments - A traffic semantic approach. In: Advances in Human Factors of Transportation. AHFE Open Access, vol. 148, pp. 460–469. https://doi.org/10.54941/ahfe1005237
The pilot study approached traffic environments as semantic constructions to explore the meaning-making processes that shape road users' perceptions of and interactions with traffic environments. Conducted in a basic driving simulator, the study involved eight participants who viewed a pre-recorded video of a driven route, paused at six pre-defined traffic situations. Throughout the session, participants were encouraged to think aloud, and at each interval, they completed a questionnaire. Three interdependent contextual spheres were identified which influenced the participants’ perception and interpretation of the situations, risks involved, and how they would plan their actions: (a) the broader geographical area; (b) the specific traffic site encompassing dynamic traffic elements (i.e. other road users) and non-dynamic infrastructural elements (road layout, speed bumps, signage, etc.), and (c) the individual and their attributes (e.g. driving experience) as well as their earlier familiarity with the type of - or the specific - traffic site.
Research on driver behaviour has been a focal point for several decades, with a primary goal of enhancing traffic safety. Numerous studies have delved into the aspects of driver attention, inattention and distraction, exploring sources and proposing countermeasures (e.g., Engström & Victor, 2011; Gordon & Regan, 2017; Regan & Strayer, 2014; Regan & Oviedo-Trespalacios, 2022; Victor, 2011).
A related line of research has focused on drivers’ perception of hazards on the road and how they estimate risks. Studies have e.g., explored variations in risk perception among different drivers, among drivers with varying expe- riences of driving (McKenna & Crick, 1997; Crundall, 2016; Jackson et al., 2009) and compared how drivers react to visible hazards and those concealed by elements like bushes and parked vehicles (Vlakveld, 2014).
Another approach to ensuring safe traffic has focused on the design of road infrastructure (e.g., Bíl et al., 2019; Milton & Mannering, 1998). The concept of ‘self-explaining roads’ (Theeuwes, 2021; Theeuwes & Godthelp, 1995)
Understanding Drivers’ Interaction With Traffic Environments 461
describes predictable road environments that match driver expectations and trigger safer driver behaviour. The design principles include, e.g. that roads should be consistently designed so that road users know how to act and can predict how other road users will use the space.
This pilot study took another design approach with traffic environments as design artefacts but more specifically as semantic constructions. According to product semantics (e.g., Monö, 1997), a product gestalt communicates a message that a user perceives and interprets, impacting their assessment of and interactions with the product. Similarly, road users can be assumed to react to and act on different cues communicated by the design of the traffic environment. Applying the four product semantic functions (ibid.), a traffic environment can describe its purpose, identify what category of environments it belongs to (e.g. roundabout), express its properties (e.g. visibility, complex- ity), and exhort reactions (e.g., attention) resulting in, e.g. recognition and emotional reactions.
Purpose The purpose of the pilot study was to investigate the meaning-making pro- cesses that influence road users’ perceptions and understanding of, and (inter)actions with, different traffic environments.
METHODOLOGY
Participants The pilot study involved eight participants (six men and two women) aged between 28 and 63. All held a valid driving license for between 8 and 44 years (mean = 28.4). Five participants used their car more or less every day, and the remaining three used them several times a week. Most participants (n = 7/8) drove a mix of different types of roads, and one drove primarily in the city. Driving exposure varied from less than 10,000 km/year to more than 15,000 km/year. The participants characterised their own driving, with most (n = 5/8) stating adapting their driving to the prevailing traffic rhythm, two driving ‘fast and safe’ and another two driving ‘slow and safe’.
Procedure and Data Collection The study took place in a facility dedicated to user studies at a university cam- pus. On arrival, the participants were placed in a basic, non-moving driving simulator and received verbal information on the study’s purpose and proce- dure. They were also informed that the sessions would be audio-recorded for later analysis with their consent. Finally, they were informed that they could terminate at any time if they desired to do so.
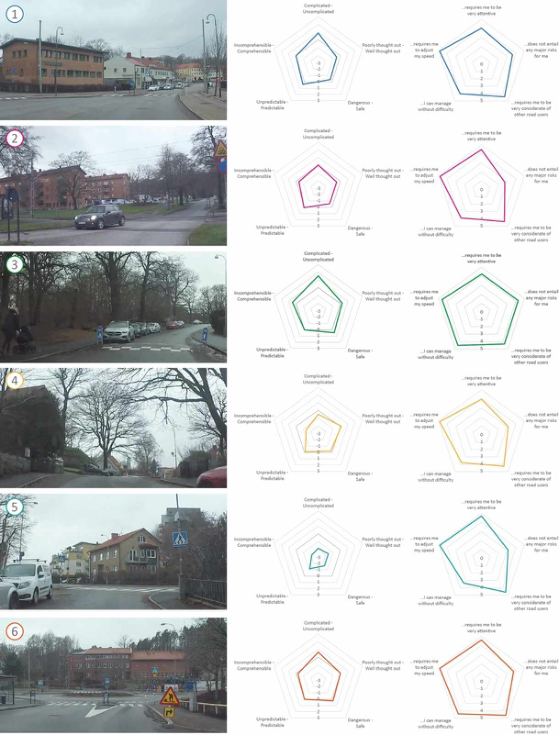
Next, a pre-recorded video capturing a driver driving a predefined route was played on a large screen before them. The footage, captured from the driver’s perspective, authentically documented the driving and the route, i.e. there was no manipulation of the video. The video was paused at six pre- defined sites (see also Figure 2) representing different degrees of ‘order’ and ‘visibility’: (i) when approaching a zebra crossing at an intersection in a city centre, (ii) a tram crossing, (iii) speed bumps in a residential area, (iv) the
462 Karlsson and Johansson
brow of a hill, (v) a t-crossing, and (vi) a roundabout after passing a school opposite a bus stop.
At each interval, the participants filled in a questionnaire consisting of three parts: (a) a semantic differential scale (+3 to −3 with a neutral 0) con- sisting of five bi-polar adjectives addressing the participants’ characterisation of the respective locations and situations; (b) a 5-point Likert scale with five statements describing driving behavioural responses or perception of risk, to which the participants were asked for their degree of agreement and (c) a 5-point emotional scale (not reported on here). The participants were encouraged to think aloud throughout the entire session, including commenting and explaining their responses to the ques- tions. The study was conducted in Swedish. For this paper, questionnaire and think-aloud protocols have been translated into English.
Analysis The data was analysed using quantitative and (primarily) qualitative meth- ods. The questionnaire data was compiled and analysed using descriptive, non-parametric statistics. The recordings of the think-aloud comments were transcribed and analysed from a product semantics perspective to find pat- terns in how the participants talked about the different sites or explained their ratings.
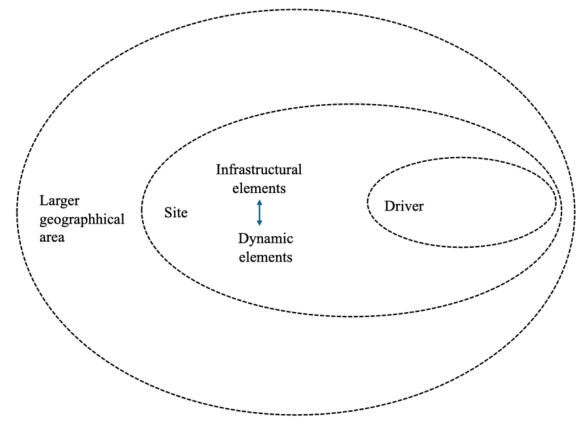
FINDINGS The analyses revealed a complex interplay of factors shaping drivers’ per- ceptions of and responses to diverse traffic scenarios. These factors belong to three different contextual spheres: the geographical area, the site, and the individual driver him-/herself, as illustrated in Figure 1.
Figure 1: The three contextual spheres.
Understanding Drivers’ Interaction With Traffic Environments 463
Contextual Sphere: Geographical Area The geographical area constitutes the first, outermost contextual sphere. The specific site’s location within the broader type of geographical area (in the study city centre and residential area) appeared to play a role in ‘preparing’ the participants by communicating meanings of varying complex- ity, predictability and demands for attention. For example, when entering the residential area, participants commented on the need to become more attentive:
“I am very attentive. I basically agree with that you always do that when you drive in residential areas.”
The residential area (in this case) was associated with specific ‘hidden’ latent hazards: “... it feels like we are in a residential area, and someone can run out (into the street) or a car can come out, and you have to pay a little extra attention...//.... Yes, there can be some distraction or some anxiety, and if something appears a little quickly, it can become a difficult situation.”
These contextual characteristics meant that a particular site was perceived as more unpredictable and dangerous than others.
“And then, I think that from that perspective, it (the site) can be a little more dangerous than what I experienced the others to be. And maybe a little more unpredictable.”
Contextual Sphere: Traffic Site The second contextual sphere refers to the specific sites and situations. Even though there were significant differences, the participants’ responses to the questionnaire characterised the different sites as, e.g., more or less compli- cated, understandable and predictable (see Figure 2 for an overview). The think-aloud protocols provided more in-depth information and some expla- nations, indicating that the characterisation of the respective sites was based on an interplay between (a) infrastructural elements, such as road stretch, road surface markings, signs, speed bumps, etc., as well as trees, plantations, and similar, and (b) dynamic traffic elements, i.e. the type, volume, and speed of other road users at the traffic site.
The presence and organisation of physical infrastructural elements resulted in different degrees of visual and organisational clarity, which influenced not only the participants’ ability to see the infrastructural elements and notice the dynamic elements (i.e. other road users) but also cued the participants as to where they thought they should direct their attention.
A high degree of visibility and order appeared to communicate less risk and more control, as expressed by one participant (Figure 2, #2): “It (the site) is easy to read, and in that I feel safe, it gives me the feeling that I still know what is going to happen, and it still gives me a feeling of control over the situation.”
464 Karlsson and Johansson
The tram crossing (Figure 2, #2), although characterised as a site which would require a driver’s attention, did not result in higher ratings of perceived risks due to the combination of familiar signs (tram line), the way the tram stops were placed at each side of the crossing, and overall good overview.
Figure 2: Traffic sites #1-6 and participants’ responses to questionnaires (mean values, n = 8). Left diagrams show participants’ characterisation of the respective sites. The larger the area covered by the pentagrams, the more positive the associated mean- ings. Right diagrams show driving behavioural responses or perception of risk. The larger the area covered by the pentagrams, the higher the agreement with respective statements.
“I imagine that it requires me to be quite attentive because we have the tram just after the crossing, but I don’t really see that there are any major risks because I also think that you can see it (the tram), so to speak.”
Conversely, lower visibility communicated higher risk and less control. This was in particular true for the participants’ characterisation of the brow of the hill (see Figure 2, #4):
Understanding Drivers’ Interaction With Traffic Environments 465
“I experience this as a bit more complicated, but it’s really based on the fact that you don’t quite see, and then there are cars, there are large driveways from the houses that also have cars, and they might reverse out (into the street)....//.. It requires some attention, at least. A bit unpre- dictable, but I attribute that to this hillcrest because you can’t see it, and there’s no place to meet up there because the cars are parked. It’s quite unmanageable, really.”
The t-crossing (see Figure 2, #5) communicated similar latent hazards as the line of sight was obscured: “Here at the crossing, you can’t see if someone approaches from the right because we have fences and plants and things like that, and quite a lot is happening at the same time.”
Sites #4 and #5 (Figure 2) also stand out in the participants’ responses to the questionnaire.
Another aspect that appeared to influence how the participants interpreted the site was whether the site was recognised, came with clear traffic rules, and whether participants expected other road users to comply with these rules. The spatial configuration and priority rules that apply to roundabouts (Figure 2, #6) resulted in participants characterising the site as ‘predictable’.
“The roundabout...//..., it’s quite straightforward, after all, because it’s a roundabout. A roundabout is essentially always predictable....”
However, the expression of predictability changed when the configuration changed, priority rules became more unclear, and attention had to be divided between cars, bicyclists, and pedestrians: “... The issue arises when you decide to place crosswalks and bike lanes right at the intersections, especially in a case like this, where it’s located next to a school. That’s when it gets quite messy, especially considering the dynamic elements, like the school children crossing.”
Sites with unfamiliar road signs or infrastructural elements resulted in uncertainty as to what traffic rules should apply and, therefore, how other road users would behave. The speed bump in Figure 2, #3 communicated “slow down”, but the road signs, in combination with the white road mark- ings, caused confusion. The participants became uncertain if this was - or not - a pedestrian crossing where cars should give way: “I don’t really understand what those signs mean except that it’s a street where people can walk and cycle too. It’s very tricky here, people may think they can cross the street there.”
This resulted in the site and the situation being characterised as unpredictable, making the participants more attentive and anxious.
“I think of the person walking there with the pram. I don’t know if she will want to cross the road even though it might not be a pedestrian crossing. So, you’re more attentive and want to know what’s going on. The unpredictable is what usually makes you anxious.”
466 Karlsson and Johansson
Another design that resulted in similar uncertainty was site #1, see Figure 2, which includes a pedestrian crossing, but it is also where a cycle path ends and ‘disappears’ into the street. Although expressing visibility, the message communicated was confusing, not only for drivers but for all road users: “I don’t think it (the site) is clear, especially since there are pedestrians who are supposed to cross the street. They have to cross both the street and the bike lanes, and the bike lane goes right out into the traffic there, so how do cyclists think? They prepare to move out among the cars, but at the same time, they have to keep an eye on those who are crossing at the pedestrian crossing, making it unclear for everyone, in my opinion.”
Again other traffic environments were designed so that the participants expe- rienced conflicts between traffic rules and how one should behave from a traffic safety perspective. The earlier mentioned t-crossing (Figure 2, #5) is an example of such a site.
“But you have to let people pass and then we have to get out there and check in the direction where we’re going and you don’t want to stand at the crosswalk, but you still have to stand there up front. So there is a lot to keep track of here. Bicycles in particular can come at high speed. This is how I feel... that you have a lot going on at the same time, which can make you a little stressed and require your attention.”
Contextual Sphere: The Individual The third contextual sphere comprises the individual him-/herself. The par- ticipants’ driving experience, perceived competence and ability to handle various traffic situations influenced their perception of the sites and situa- tions. However, participants’ familiarity with the specific site or similar traffic sites and situations influenced their characterisation of the site as well as their intended behaviour. Driving experience and familiarity with the surroundings resulted in participants’ expressing confidence and ability:
“This is my old hunting grounds so to speak; it’s tough to feel stressed. I don’t feel stressed by driving.”
Independent of the type of site, unfamiliarity appeared to increase partici- pants’ mental workload: “I find this environment quite challenging to drive in if I haven’t been there before and don’t know where I’m going.”
However, familiarity could result in the same - given the specific site in terms of infrastructural elements, their constellation, and other road users. In this case, familiarity influenced the participants’ preparedness - or ‘bias’ - for interpreting the site and the situation and how to interact, as well as their expectations regarding the behaviour of other road users, which, in turn, affected their anticipation of possible hazards. The roundabout earlier men- tioned (Figure 2, #6) was preceded by a constellation of elements: ‘school’, ‘bus stops’, ‘pedestrian crossings’ and, at times, ‘young children’ that, given the participant’s earlier experience with the site, communicated ‘dangerous’:
Understanding Drivers’ Interaction With Traffic Environments 467
“What I think is a bit awkward...//... I experience this as a bit dangerous. Because there is a big bus stop and there are usually a lot of children, they come from the school across there and they cross (the street) at all the pedestrian crossing; ten-year old children.”
DISCUSSION AND CONCLUSION The pilot study was planned and analysed with a design perspective, specif- ically focusing on product semantics. The underlying principle is that a designed artefact communicates a message that users perceive and interpret, influencing their assessment of and interactions with the artefact. Intentional design of the artefact, using, e.g., the semantic functions, is crucial to achiev- ing desired outcomes in terms of, e.g. user behaviour and emotional reactions. The idea behind self-explaining roads, or SER (e.g., Theeuwes & Godthelp, 1995; Theeuwes, 2021), is fundamentally the same, although theoretical bases and taxonomy differ.
Based on the notion of SER, Theeuwes (2021) suggests, e.g. that “... con- fusing, inconsistent, and violating the expectancies of road users...” may lead to road user error (even road crashes). The pilot study identified sites the participants found confusing - or incomprehensible - due to their design, which potentially could lead to road user errors if the participants had driven themselves. However, there were other site characteristics that influenced participants’ perceptions, such as the site expressing visibility (positive), complexity (negative), predictability (positive) or the semantic antonyms. However, the design of the site (or road) could not fully explain the partici- pants’ characterisations or their behaviour. The participants’ perceptions and interpretation of the situations, risks involved, and how they would plan their actions were influenced by interdependencies between broader geographical area, the specific traffic site including dynamic traffic elements and infras- tructural elements, and the individual, their individual attributes, including driving experience. However, the participants’ familiarity with the respective sites also played a significant role in how they interpreted the situations and, e.g., to what or where they would direct their attention, findings that in part comply with studies on the influence of experience on driver behaviour and allocation of attention (e.g., Borowsky et al., 2007) and studies the influence of habit and expectancy on behaviour and attention allocation in familiar and unfamiliar traffic contexts (Thomson & Sabik, 2018). Repeated exposure to sites and situations will allow the road user to anticipate likely events and engage in appropriate responses (Charlton et al., 2010) - “We learn to read the road and traffic and learn where the dangers usually lurk” (Summala & Räsänen, 2000).
The findings could also be discussed in terms of top-down and bottom- up information processing (e.g. Theeuwes, 2010); top-down processes guide attention and expectations, and bottom-up processes provide the raw data for perception. With reference to Awh et al. (2012), Theeuwes (2021) proposes a third category, ‘selection history’, eliciting selection biases, which is argued to be even more important.
468 Karlsson and Johansson
All studies come with limitations which impact the findings. In the present study, the participants did not drive the route themselves; they observed and commented on a video of someone else’s driving that did not necessarily com- ply with their own driving. The video was recorded in daylight, and traffic intensity was low, and the participants’ perception of the traffic environments would most probably differ if the recording had been done in the evening or in rush hours. Another factor to consider is that the interval allowed the par- ticipants time to analyse the respective situations more in depth than would have been the case in real traffic. On the other hand, previous to the pilot, trial runs with participants driving the same route concluded that think-aloud data was very difficult to elicit from drivers driving themselves; data that was essential for the purpose of pilot study and the paper.
Finally, although recognizing the significance of the prior work on SER by, e.g. Theeuwes and Godthelp (1995), the pilot study advocates for a more holistic approach, beyond consideration of endemic road features or categori- sations of roads, in particular considering the interplay with moving objects, i.e. other road users (cf. Summala & Räsänen, 2000). Utilising the four prod- uct semantic functions (Monö, 1997), a traffic environment can be designed and analysed based on the four semantic functions: describe purpose, iden- tify what category of environments it belongs to (e.g. roundabout), express properties (e.g. visibility, complexity), and exhort reactions (e.g., attention). Such an approach can provide valuable insights into factors that should be taken into consideration when studying drivers’ behaviour in normal driving as well as formulating design principles for future traffic environments.
REFERENCES
Awh, E., Belopolsky, A. & Theeuwes, J. (2012). Top-down versus bottom-up attentional control: A failed theoretical dichotomy. Trends in Cognitive Science, 16(8): 437–443 Bíl, M., Andrásik, R., Sedoník, J. (2019). Which curves are dangerous? A network-
wide analysis of traffic crash and infrastructural data. Transportation Research A: Policy and Practive, 120: 252–260. Charlton, S. G., Mackie, H. W., Haas, P. H., Hay, K., Menezes, M. & Dixon C.
(2010). Using endemic road features to create self-explaining roads and reduce vehicle speeds. Accident Analysis and Prevention, 42:1989–1998. Crundall, D. (2016). Hazard prediction discriminates between novice and experienced drivers. Accident Analysis and Prevention, 86:47–58 Engström, J. & Victor, T. (2009). Real-time distraction countermeasures. In: Regan,
M. A., Lee, J. D. & Young, K. L. (eds.), Driver distraction, Theory, effects, and mitigation. CRC Press, Boca Raton, FL, 465–484. Gordon, C. P & Regan, M. A. (2017). Driver distraction and inattention and their role in crashes and safety-critical events. In: Regan M. A., Lee, J. D. & Victor, T. W. (eds.) Driver Distraction and Attention, Advances in Research and countermeasures, Volume 1, CRC Press, 157–170. Jackson L., Chapman P. & Crundall D. (2009). What happens next? Predicting
other road users’ behaviour as a function of driving experience and processing time. Ergonomics, 52(2):154–64.
Understanding Drivers’ Interaction With Traffic Environments 469
Milton, J. & Mannering, F. (1998). The relationship among highway geometrics, traffic related elements and motor-vehicle accident frequencies. Transportation, 25(4): 395–413. Monö, R. (1997). Design for product understanding. Liber, Stockholm. McKenna, F. P. & Crick, J. (1997). Developments in hazard perception. TRL report
297, 10.13140/RG.2.1.1014.7680. Regan, M. A. & Oviedo-Trespalacios, O. (2022). Driver distraction: Mechanisms, evidence, prevention and mitigation. In: Edvardsson Björnberg, K., Belin, MÅ., Hansson, S. O., Tingvall, C. (eds.) The Vision Zero Handbook. Springer, Cham., 1–62. Regan, M. R. & Strayer, D. L. (2014). Towards an understanding of driver inatten-
tion: Taxonomy and theory. Annals of Advancement of Automotive Medicine, 58:5–14. Summala, H. & Räsänen, M. (2000). Tor-Down and Bottom-up processes in driver behavior at roundabouts and crossroads. Transporation Human Factors, 2(1):29–37. Theeuwes, J. (2010). Top-down and bottom-up control of visual selection. Acta
Psychologica, 135(2): 77–99. Theeuwes, J. (2021). Self-explaining roads: What does visual cognition tell us about designing safer roads? Cognitive Research: Principles and Implications, 6:15. Theeuwes, J & Godthelp, H. (1995). Self-explaining roads. Safety Sci- ence, 19, 217–225. Thompson, C. & Sabik, M. (2018). Allocation of attention in familiar and unfa-
miliar traffic scenarios. Transportation Research Part F: Traffic Psychology and Behaviour, 55:188–198. Victor, T. (2011). Distraction and inattention countermeasure technologies. Ergonomics in Design, 19(4): 20–22. Vlakveld, W. P. (2014). A comparative study of two desktop hazard perception tasks suitable for mass testing in which scores are not based on response latencies. Transportation Research Part F: Traffic Psychology and Behaviour, 22:218–231.
LISTED IN THE AHFE DIGITAL BOOKSTORE CATALOGUE
Explore the complete digital volume
Advances in Human Factors of Transportation
Read this individual research paper free through the original publisher, or explore the full digital proceedings book.
ISBN 978-1-964867-24-3
Explore this ISBN in the AHFE Bookstore ↗Listed in the July 2026 bookstore catalogue; search by ISBN to confirm current availability · Digital book purchase optional