Kylian Looten, Camille Gillet, Samuel Aupetit (2024). Experimentation of an innovative device for pedestrian safety: an eye tracking study in real traffic conditions. In: Usability and User Experience. AHFE Open Access, vol. 156, pp. 163–169. https://doi.org/10.54941/ahfe1005426
In a context where the number of cars is constantly increasing, pedestrian safety appears more necessary than ever. In certain high-risk urban areas, pedestrian safety depends on the driver's ability to see the pedestrian and the crosswalk (Lantieri, 2021). To improve pedestrian detection by the driver, Colas (a French civil engineering company) has developed an innovative technology for crosswalks. This solution is called Flowell and consists of colored light strips on the ground, which indicate when the pedestrian should cross. The objective of this study is to test if the Flowell technology improves driver’s visual strategies in crosswalk areas. In order to study these visual strategies in conditions as close as possible to those encountered by drivers, a natural study in real traffic conditions was chosen. Twenty-eight participants were recruited and were asked to drive for 30 minutes in urban areas close to Paris in a crosswalk area where the Flowell technology was installed. Participants were divided in two groups: 1) day driving and 2) night driving. Each group did a driving session before (T0) and after (T1) the installation of the Flowell system. Objective and subjective data were collected in order to assess drivers’ perception, understanding and usefulness of the Flowell system. Perception was measured in terms of the time taken to detect the crosswalk (seconds), the number of fixations in the various zones and the duration of fixations for each crossing (seconds) using Tobii's eye-tracker : glasses pro 3. Visibility and glare levels were also collected via interviews at the end of the survey. The level of understanding of the device was collected from participants' interviews and completed by eye tracking data such as eye path and patterns. Finally levels of usefulness and perceived effectiveness were documented by verbal data.The results showed that there is a main effect of day/night driving on the overall number of fixations (F(1,12) = 12.8, p=0.004, n²=0.308). It was higher during the day at T0 (M = 2.17, SD = 0,37) than at night (M = 1.21, SD = 0,25). The duration of fixation on the zones of interest is greater at T1 (48%) than at T0 (22%). In other words, night-time drivers spend more time looking at crosswalk zones when the device is switched on. Analysis of the participants' verbal data showed that 60% understood how the system worked at night, compared with only 30% during the day. On average, the level of system efficiency was 4.60 (SD = 0.55) for night-time participants, compared with 3.47 (SD = 1.46) for daytime participants.To conclude, at night, the Flowell device is really well perceived and understood. Its perceived usefulness is therefore high, and it is relevant to pedestrian safety on this site. During the day, however, a lower level of perception and understanding leads to a reduction in its usefulness.
In a context where the number of cars is constantly increasing, pedestrian safety appears more necessary than ever. In certain high-risk urban areas, pedestrian safety depends on the driver’s ability to see the pedestrian and the crosswalk (Lantieri, 2021). To improve pedestrian detection by the driver, Colas (a French civil engineering company) has developed an innovative tech- nology for crosswalks. This solution is called Flowell and consists of colored
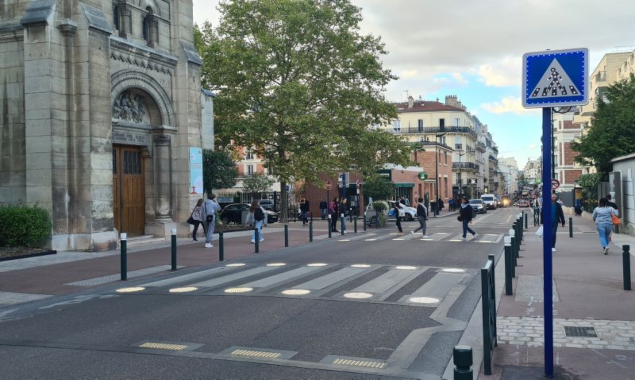
light strips on the ground, which indicate when the pedestrian should cross (Figure 1).
Figure 1: Picture of Flowell in Saint-Mandé.
This study is part of a general effort to assess the acceptability of the Flow- ell system to users. Various studies not yet published have been carried out with pedestrians and cyclists, with the aim of collecting the opinions of pedes- trians directly where the system has been installed. Participants gave their impressions of the understanding and usefulness of the new system : pedes- trians said that they found the system useful for being seen by vehicles. They also said that they would not change their crossing habits. However, the opin- ions of drivers, who were more difficult to access in these conditions, were not collected in sufficient depth to provide interpretable results. As well as sub- jective data, it would seem necessary, for safety reasons, to study the effects of the addition of the device on drivers’ visual behavior.
The aim of the study is to measure the impact of the Flowell device on the visual behavior of car drivers. More specifically, the aim is to use a quasi- experimental study to assess drivers’(1) degree of perception of the device in the day and night environment, (2) level of understanding of the device when crossing a pedestrian, and (3) behavioral intention towards the device through its perceived usefulness.
METHODS
Population The sample included 29 participants. Nine participants withdrew between the first and second study sessions due to a report of several months, caused by a change in the inauguration dates and consequently the start-up dates of the system. A total of 20 participants (10 women and 10 men) were included with a mean age of 47 years (SD = 15) with a range of 50 years.
Experimentation of an Innovative Device for Pedestrian Safety 165
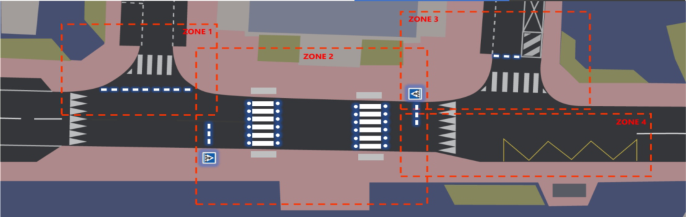
Procedure The study took place on the Saint-Mandé site. The site was divided into 4 zones, as shown in the diagram below. Our study focuses on the most dan- gerous zone of this site: zone 2. These two successive crosswalks are on an extremely busy road, between a high school and a church (Figure 2). The pedestrian traffic is therefore also very high.
Figure 2: Diagram of study areas.
Two measurements were carried out for the Saint-Mandé site: T0 (mea- surement of the reference state without the introduction of the device) and T1 (measurement after the installation of the device).
Data Collection The data collected can be divided into three main categories: perception, understanding and usefulness.
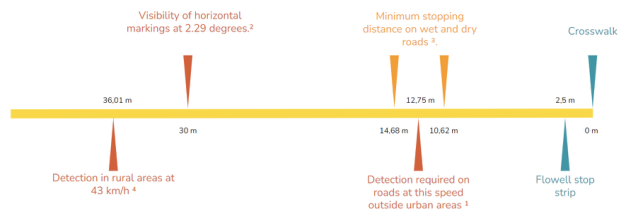
Perception Tobii’s glasses pro 3 were used in this study to measure drivers’ visual behav- ior. Numerous standards govern the detection of vertical signs in rural areas. A study of these standards led us to carry out our analysis from 35 meters before the crosswalk to 2.5 meters before it, the latter corresponding to Flowell’s stop strip. In fact, the aim was to cover almost all the distances mentioned in the diagram above (Figure 3), in order to take into account all the standards, regulations and studies relating to them.
Figure 3: Diagram of distances governing road signs.
The first piece of data collected was the detection delay. This corresponds to the difference between the first moment when the crosswalk enters the driver’s field of vision and the first fixation on an area of interest. The shorter the delay, the quicker the driver detected the crosswalk, and the better he was able to adapt his driving behavior.
The number of fixations on the device was also collected and corresponds to the sum of gazes with a duration of at least 100 ms on the zones of interest.
The number of fixations on the device was determined using zones of interest established a priori on 8 reference images. These were used for dif- ferent distances and passage conditions (night/day, traffic direction). There were three distinct zones: the crosswalk (“Flowell”), the pedestrian crossing (“Pedestrians”) and the pre- and post-crossing zones to the left and right of the device. They were grouped together because the pedestrian could come from the left as well as the right in real-life situations (“High School” and “Church”). Directly related to this, fixation duration corresponds to the time spent per participant looking at each zone.
The level of perceived visibility of the device was collected on a Likert scale from 1 to 5 (1 being not at all visible, 5 being completely visible). The glare felt was also collected.
Understanding Comprehension of the message transmitted by the device was determined using a 5-point Likert scale from 1 to 5 (1 being not at all comprehensible and 5 being completely comprehensible).
The eye paths were collected using Tobii Pro Lab software and reference images established. These were then analyzed to determine which pattern each image follows for each participant.
Usefulness The level of perceived usefulness was collected using the questions asked dur- ing the interview. Participants were asked whether or not the Flowell device helped them to see the pedestrian. And, a 5-point Likert scale was designed into the questionnaire to determine the perceived usefulness of the device (1 being useless, 5 totally useful).
Similarly, participants were asked about the effectiveness of the system, using a 5-point Likert scale from 1 to 5 (1 being ineffective and 5 totally effective).
Statistical Analysis In order to verify the homogeneity of variances, Levene’s tests were carried out. Repeated-measures Anova tests for T0 and T1, with day and night as cross-subject factors, were then performed. Post hoc tests were made for multiple comparisons. Tukey correlations (ρ) were used to study the links between context (Day, Night) and time (T0, T1). All statistical studies were performed on Jamovi version 2.3.28.
Experimentation of an Innovative Device for Pedestrian Safety 167
RESULTS
Perception Overall, no significant difference was observed between crosswalk detection time (s) and device activation (p > 0.05). Detection time remained simi- lar when the device was switched off (M = 5.67, SD = 2.09) or activated (M = 5.51, SD = 2.82).
There was a significant difference between the average number of fixa- tions across all zones of interest and the driving context (F = 12.8; p < 0.01; η2 = 0.31). The overall number of fixations was higher during the day at T0 (M = 1.11, SD = 0.34) and T1 (M = 1.06, SD = 0.41) than at night (respectively M = 0.51, SD = 0.26 and M = 0.70, SD = 0.23).
Significant difference between day and night can also be observed in the number of fixations exclusively in the pedestrian zone (F = 12.5; p < 0.01; η2 = 0.26) at T0 (respectively M = 0.48, SD = 0.14 and M = 0.14, SD = 0.12) and T1 (respectively M = 0.30, SD = 0.21 and M = 0.15, SD = 0.20), as well as on the right and left zones of the crosswalk (F = 6.35; p < 0.05; η2 = 0.22) at T0 (respectively M = 0.29, SD = 0.15 and M = 0.18, SD = 0.08) and T1 (respectively M = 0.39, SD = 0.14 and M = 0.21, SD = 0.09).
However, no significant difference was observed between the number of fixations during the day and at night, in the Flowell zone (p > 0.05). And there was a trend at night, when the number of Flowell fixations tended to increase when the device was switched on (M = 0.34, SD = 0.20) rather than off (M = 0.19, SD = 0.13). Similarly, the average number of fixations across all areas of interest tends to increase at night when the device is switched on (M = 0.70, SD = 0.23) rather than off (M = 0.51, SD = 0.26).
No significant difference was observed between the average fixation time for all the areas of interest and either device activation (p > 0.05) or driving context (p > 0.05).
In contrast, a trend can be observed at night, depending on the activation of the device. The amount of time spent looking at zones of interest (48%) is proportionately greater when the system is switched on than when it is switched off (22%). In other words, night-time drivers spend more time look- ing at crosswalk zones when the device is switched on. On average, 60% of daytime participants said they had identified the Flowell system while driving, compared with 100% at night.
Whether by day or night, the pedestrian pathway, described by several participants as “luminous circles”, is the element best perceived by drivers. By night, this element is systematically observed, and by day, nearly 60% say they can identify it. The effect line is also better perceived at night than during the day, but by only 25% of participants. The effect line is still very poorly perceived, as are the C20A LED illuminated signs.
No glare was reported during the day. At night, only 1 participant (20%) reported being dazzled by the device.
Understanding On average, the subjective level of understanding of the system was M = 4.20 (SD = 1.79) for night-time participants, compared with M = 3.73 (SD = 1.49) for daytime participants (on a scale of 1 to 5).
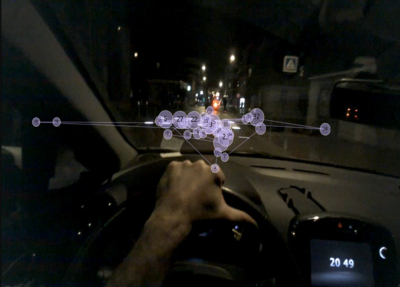
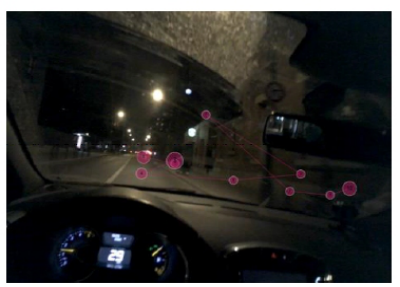
Two ocular patterns were observed. A “focused” pattern and a “dis- tributed” pattern (Figure 4 and 5). The major difference between T0 and T1 lies in the night-focused pattern. Indeed, only one third (33%) of the eye paths observed at T0 correspond to this pattern, compared with two thirds (65%) at T1. The trend inculcated by the Flowell device therefore doubles the number of eyepaths focusing on the crosswalk and its ancillary areas at night.
Figure 4: Example of an eye track from a night participant with a “focused” pattern.Figure 5: Example of an eye track from a night participant with a “distributed” pattern.
Usefulness On average, the perceived usefulness of the system was M = 5.00 (SD = 0.00) for night-time participants, compared with M = 4.40 (SD = 1.00) for daytime participants. On average, the system’s level of effectiveness was M = 4.60 (SD = 0.55) for night-time participants, versus M = 3.47 (SD = 1.46) for daytime participants (both on a scale of 1 to 5).
Experimentation of an Innovative Device for Pedestrian Safety 169
DISCUSSION
The aim of the study is to measure the impact of the Flowell device on the visual behavior of car drivers. Results showed that the crosswalk is better perceived at night with the device than without it, while still not dazzling the driver. At night, it is also well understood and perceived as useful. During the day, it’s hard to say whether drivers’ visual strategies change in the presence of Flowell.
Our study of the Flowell system on the Saint-Mandé site has also shown that switching on the device does not result in earlier perception of the pedes- trian. But also that the frequency of fixations on the Flowell zone increases sharply when the device is in place. This suggests that it is easier to fix the device and the reflective strips when they are illuminated. The time spent looking at the Flowell zone also increases sharply when the device is switched on. This increase in night-time perception correlates with drivers’ perception of visibility: they have a perfect perception of the device and consider it to be perfectly visible. Drivers do not feel dazzled by the device.
At night, the system’s operation is understood twice as often as during the day. However, a large number of participants still assume that the system is fixed, and do not realize that the system lights up when pedestrians are detected. This better understanding at night is achieved through a more com- plete analysis of the device, with the help of eye patterns: there is twice as frequent a focused analysis of the crosswalk at night by participants with the device than without it.
Perceived usefulness was also slightly higher at night than during the day. The same applies to observed utility.
Limitations As traffic conditions weren’t controllable, this may have led to some variance in the participant’s mindset.
Not everyone was equally at ease with the vehicle. The mental load required to use it was therefore different for everyone.
The loss of participants between T0 and T1 resulted in a significant loss of data.
REFERENCES
Articles L412-2 and R412-2, French Highway Code. European Commission, DG VII – Transport, (2000). COST 331: Requirements for horizontal road marking (CD-Rom): Volume I, Publications Office. Lantieri, C., Costa, M., Vignali, V., Acerra, E. M., Marchetti, P., & Simone, A. (2021).
Flashing in-curb LEDs and beacons at unsignalized crosswalks and driver’s visual attention to pedestrians during nighttime. NF EN 1436 standard, January 2018.
LISTED IN THE AHFE DIGITAL BOOKSTORE CATALOGUE
Explore the complete digital volume
Usability and User Experience
Read this individual research paper free through the original publisher, or explore the full digital proceedings book.
ISBN 978-1-964867-32-8
Explore this ISBN in the AHFE Bookstore ↗Listed in the July 2026 bookstore catalogue; search by ISBN to confirm current availability · Digital book purchase optional