Hsiao Ching Chu, Chien-Hsiung Chen (2024). The User Experience of App Interface Design in Hospitals: An Empirical Study. In: Usability and User Experience. AHFE Open Access, vol. 156, pp. 272–279. https://doi.org/10.54941/ahfe1005438
Amidst the pandemic's catalyzation, numerous hospitals rapidly invested in enhancing their mobile service systems. Medical appointment scheduling and outpatient information retrieval are fundamental functionalities of healthcare systems. Poor design in these basic functionalities can lead to negative user experiences, eventually resulting in user abandonment. This study employs a 2 (time selection) x 2 (information layout) factorial experimental design to investigate its impact on user performance, workload, and subjective perceptions. A between-subjects experimental design was utilized, and data were analyzed using a two-way ANOVA. Convenience sampling was used to recruit 32 participants for the experiment. The results revealed that: (1) Calendar date picker widgets are more suited for searching appointments further in the future. (2) Tabular information presentation enhances search efficiency but may require necessary learning and lead to higher cognitive load. (3) In more complex comparative tasks, there could be a transfer of information to the perceptual system, accelerating information absorption and retrieval.
During the severe pandemic years, hospitals made every effort to record patient footprints, striving to reduce their stay time within the hospital premises. Thus, the mobile information service systems (apps) of hospitals played a pivotal role. The goal was to offer multiple integrated functions, facilitating patients to use the app at home for outpatient registration and to check consultation progress before or during their appointment time, thereby minimizing waiting time in clinics and reducing the risk of infection due to prolonged waiting and crowded conditions. Now, as the pandemic subsides, the usability of these hospital mobile information service systems (apps) may be compromised due to unfriendly interface designs or integration of imprac- tical features, leading to user abandonment. With the widespread adoption of technology and user experience concepts, demands for interfaces have height- ened, encompassing aspects of functionality, usability, and pleasure (Jordan, 2000). Research on user experience in medical digital products has become ubiquitous. However, the impact of date pickers and information presenta- tion types on user experience has seldom been addressed. Moreover, Hund
The User Experience of App Interface Design in Hospitals: An Empirical Study 273
et al. (2014) suggested that the choice of time selection tools could yield different outcomes based on varying needs and task types.
Calendar pickers, as a type of widget, showcase a full calendar month at once, placing the days of the week at the top, which intuitively facilitates the confirmation of relationships and intervals between dates. In addition, the calendar pickers can provide a clear choice of dates, suitable for events occurring within a year Li (2017). Research by Hund et al. (2014) indicates that most participants who are satisfied with the calendar mode believe that the calendar format offers a more comprehensive overview for searching.
In the field of human-computer interaction, previous literature has explored various relative to time such as time selectors and date-pickers. Bargas-Avila et al. (2011) investigated time input types in websites. Subse- quently, Türkcan & Durdu (2018) extended Bargas-Avila et al.’s research to touch-based smart devices as a study medium. Later, Romikaityte et al. (2022) built upon these prior studies, examining additional types of date mode input methods. They compared the differences between drop-down menus, radio buttons, and spinner modes. Radio buttons, commonly used in calendar-style pickers, offer the advantage of displaying all options simulta- neously but suffer from occupying excessive space. In contrast, drop-down or hidden formats, often found in week-type components, save screen space and rely on users moving their finger rapidly over the surface to locate and select a specific date.
In this study, a review of current hospital appointment mobile apps revealed that essential registration information such as consulting doctors, clinic details, and consultation periods are most commonly presented in two information presentation types: tables and lists. The table type, primarily evolve from traditional physical appointment charts, has been adapted from medical websites to mobile applications, with the pros and cons. Tables, with their multi-row layouts, allow for denser information presentation, reducing screen whitespace. Furthermore, tables displayed high accuracy and moder- ate timing for response, especially for numerically oriented questions (Prasad & Ojha, 2012). Powers et al. (1984) also demonstrated the high efficiency of tables in presenting data. Overall, tables offer scalability and support for comparison tasks (Li, 2017). On the other hand, the list type, another com- mon presentation type, clearly displays clinic numbers and doctor names from left to right, segmented into three consultation periods (morning, after- noon, evening). This multi-row information presentation is intuitive and does not significantly affect searchability when the information volume is moderate.
METHODS
Participants and Materials A total of 32 participants were invited to take part in the experiment, com- prising 15 males and 17 females. The majority of the participants were 21–39 years old (84.38%). A convenience sampling method was used, and 53.13% of the participants reported having experience using hospital mobile applications.
274 Chu and Chen
In this study, Figma was used as the interface design tool. The experimental prototypes were connected between the Figma mobile and desktop applica- tions by utilizing the mirroring mode in, the interface design to be projected onto an iPhone 13 smartphone (screen size of 6.06 inches) for participant interaction.
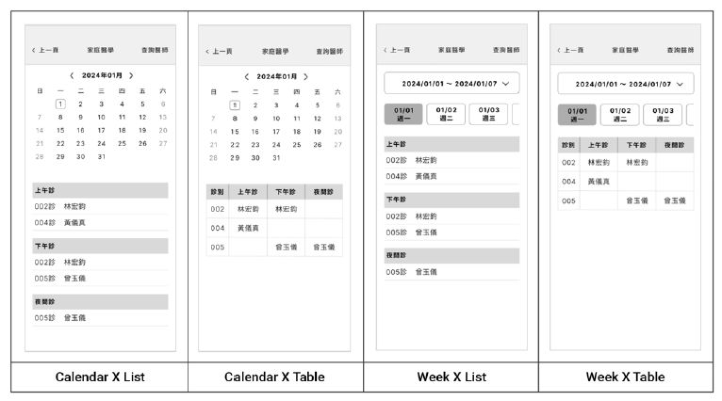
Experimental Design and Procedure The experiment was conducted with a 2×2 two-factor design, with the vari- ables being types of date widgets (calendar, week) and information layout (list, table). A between-subjects experimental design was used. Participants were randomly assigned to one of four groups, where each group of sub- jects was required to complete four operational tasks in one app prototype (n = 8). Following the operations, participants filled out the System Usabil- ity Scale (SUS) and the NASA Task Load Index (NASA-TLX). Figure 1 below presents the four prototype designs used in this study.
Figure 1: The prototype of this experiment.
RESULTS
HSI experts contribute by ensuring that human capabilities and limitations are considered. It has become clear that treating the system as separate from the users results in poor performance and potential failure in the operational setting. Continued growth in technology has not delivered desired results. Systems engineers and others are beginning to understand the role humans play in technology systems. The core challenge is to balance successful hard- ware and software solutions with human friendly implementations. To define the requirements of humans as a fundamental system component, it is essen- tial to understand the inherent capacity of user populations and their typical operational environment (Booher, 2003). A description of a population’s
The User Experience of App Interface Design in Hospitals: An Empirical Study 275
capacity incorporates more than the basic anthropometrics or the cognitive capability of the average member of the user population (Chapanis, 1996).
Task Completion Time In the experimental context, participants were initially guided to assume the date of the experiment as December 4, 2023, to align with the temporal con- text and complement the task. The first task, “Please confirm which day Dr. Wu has consultations, December 5 or December 6?” was a comparison task with a shorter time span. The results showed no significant main effect on the date picker widgets (F = 2.15, p = 0.154 > 0.05; η2 = 0.07) or the informa- tion presentation types (F = 3.03, p = 0.093 > 0.05; η2 = 0.10). Additionally, there was no significant interaction effect between the date picker widgets and the information presentation types (F = 0.26, p = 0.615 > 0.05; η2 = 0.01).
The second task, “Check how many doctors are available for the morn- ing clinic on December 13,” was a week-spanning retrieval and recognition task. Results indicated a significant main effect on the date picker widgets (F = 31.40, p = 0.000 < 0.05; η2 = 0.53), with the calendar widget (M = 4.55, SD = 1.19) being significantly faster than the week widget (M = 10.91, SD = 4.22). In contrast, there was no significant main effect of the infor- mation presentation types (F = 0.00, p = 0.985 > 0.05; η2 = 0.00) and no interaction effect between the date picker widgets and the information presentation types (F = 0.08, p = 0.784 > 0.05; η2 = 0.00).
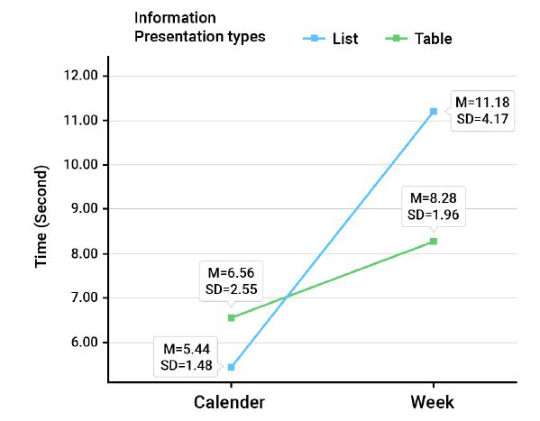
The third task, “Identify the doctor for the night clinic on January 1,”was a 3weeks-spanning retrieval and recognition task. It showed a significant main effect on the date picker widgets (F = 14.85, p = 0.001 < 0.05; η2 = 0.35), with the calendar widget (M = 6.00, SD = 2.09) being significantly faster than the week widget (M = 9.73, SD = 3.50). However, there was no signif- icant main effect of the information presentation types (F = 0.86, p = 0.362 > 0.05; η2 = 0.03). Nevertheless, a significant interaction effect was observed between the date picker widgets and the information presentation types (F = 4.32, p = 0.047 < 0.05; η2 = 0.13), as shown in Figure 2. In calen- dar mode, the list type information layout (M = 5.44, SD = 1.48) was faster than the table type (M = 6.56, SD = 2.55) for task three; conversely, in week picker mode, the table information layout (M = 8.28, SD = 1.96) was faster than the list type (M = 11.18, SD = 4.17).
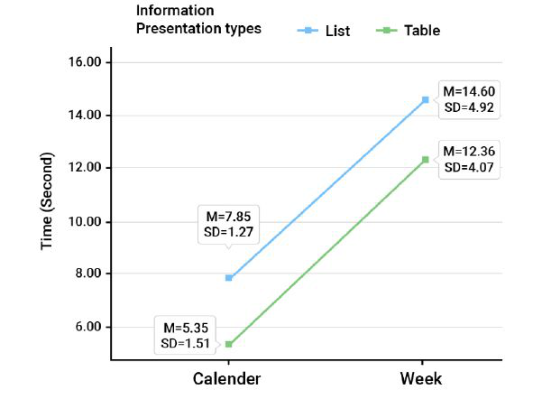
Task four, “Which day has more doctors available for the night clinic, January 4 or 11? (Answer which day),” was a comparison task with a longer time span. Data results showed a significant main effect on the date picker widgets (F = 33.86, p = 0.000 < 0.05; η2 = 0.55), with the cal- endar widget (M = 6.60, SD = 1.86) being significantly faster than the week widget (M = 13.48, SD = 4.52). Interestingly, the main effect on the information presentation types showed marginal significance (F = 4.02, p = 0.055 > 0.05; η2 = 0.13), with the list information type (M = 11.23, SD = 4.92) being slower than the table type (M = 8.86, SD = 4.68), resembling a synergistic interaction as illustrated in Figure 3. Moreover, no significant interaction effect was found between the date picker widgets and the information presentation types (F = 0.01, p = 0.914 > 0.05; η2 = 0.00).
276 Chu and Chen
Figure 2: The interaction effect between the date picker widgets and the information presentation types in Task 3 (completion time).Figure 3: The main interaction effect of Task 4 (completion time).
The System Usability Scale Questionnaire The data analysis revealed that the SUS mean scores for prototypes A, B, C, and D were M = 82.19, SD = 11.68; M = 69.69, SD = 23.01; M = 80.31, SD = 12.78; and M = 81.88, SD = 16.41, respectively. Furthermore, the main effects of the date picker widgets (F = 0.76, p = 0.386, η2 = 0.03) and the information presentation types (F = 0.87, p = 0.359, η2 = 0.03) were not significant. Similarly, the interaction effect between the date picker widgets and the information presentation types was also not significant (F = 1.44, p = 0.240, η2 = 0.05).
The User Experience of App Interface Design in Hospitals: An Empirical Study 277
The NASA Task Load Index analysis The analysis of the NASA Task Load Index (NASA-TLX) was conducted on four prototype interfaces. The NASA-TLX utilizes a Likert 7-point scale, with raw workload scores ranging from a minimum of 1 to a maximum of 7. Upon data analysis, the mean scores for the dimensions were identified as Mental Demand (M = 2.69, SD = 1.71), Physical Demand (M = 2.43, SD = 1.46), Temporal Demand (M = 2.88, SD = 1.95), Effort (M=2.06, SD=1.37), and Frustration (M = 2.22, SD = 1.34), where higher scores indi- cate greater workload. The Performance dimension (M = 5.66, SD = 1.21) inversely indicates the perceived success in accomplishing task goals. Signifi- cant main effects for the information presentation types were observed only in the Mental Demand and Frustration, detailed as follows:
Mental Demand, the two-way ANOVA revealed no significant main effect for the date picker widgets (F = 1.25, p = 0.272 > 0.05; η2 = 0.43), but a significant effect for the information presentation types (F = 7.23, p = 0.012 < 0.05; η2 = 0.21). The Mental Demand for the list information type (M = 1.94, SD = 1.18) was significantly lower than that for the table information type (M = 3.44, SD=1.86). No significant interaction effect was found between the date picker widgets and the information presentation types (F = 1.44, p = 0.240 > 0.05; η2 = 0.05).
Frustration, the two-way ANOVA indicated no significant main effect for the date picker widgets (F = .92, p = 0.347 > 0.05; η2 = 0.03). However, a sig- nificant effect was observed for the information presentation types (F = 4.20, p = 0.05 < 0.05; η2 = 0.13), with the list information type (M = 1.75, SD = 0.68) experiencing significantly less frustration than the table infor- mation type (M = 2.69, SD=1.66). The interaction effect between the date picker widgets and the information presentation types was not significant (F = 0.02, p = 0.892 > 0.05; η2 = 0.00).
DISCUSSIONS The experimental results revealed three significant main effects on task per- formance associated with the use of date picker widgets for Tasks 2, 3, and 4. This indicates that in tasks with longer time spans, participants who were assigned to use the calendar widgets were able to complete Tasks 2, 3, and 4 more efficiently than those using the week widgets. The short time span in Task 1 is the reason it cannot identify significant differences between the calendar and week widgets, it can be interpreted that calendar widgets are more efficient for planning over longer time spans, but show negligi- ble effects for next-day or near-term time spans. This might be associated with the overview effect of calendars as suggested by Hund et al. (2014). Additionally, a significant interaction was observed between the date picker widgets and information presentation types in Task 3. The longer time taken by participants to complete task 3 with prototype B (calendar widgets X table information) compared to prototype A, in contrast to the results of the prototype with the week mode widgets.
278 Chu and Chen
Currently, there is no suitable literature to support the argument for these results; however, several speculations can be made: (1) Task 3, being of mod- erate difficulty, may facilitate interaction (2) The week widgets, requiring more time to select the target date for a task, could lead to increased cognitive load, thereby transferring information to the perceptual system to accelerate information absorption and retrieval, as suggested by (Lohse, 1997). This process views table information as a graph, avoiding the time spent on top- down visual searching, thus, when the week widget is paired with table information type, efficiency is higher compared to list information type. It is also possible that (3) table information type carries a learning function (learning how to interpret), as Figure 3 shows the main effect on the infor- mation presentation types trending toward significance (p = 0.055). When conducting the more complex Task 4, the table information type exhibits better efficiency with both date picker widgets.
The results of Load Index analysis, has two main effect significant. The Mental Demand data indicated that, within the information presentation type, the table type had a higher mental demand compared to the list. This finding aligns with the inference that tables, being more learnable, impose a lesser cognitive load on participants than lists. Concurrently, the Frustration also revealed a higher level of frustration with tables compared to lists, which can be easily correlated with the Mental Demand (Romikaityte et al., 2022). Additionally, while Romikaityte et al. (2022) found that participants’ subjec- tive preference for the picker corresponded with task completion speed, this trend was not observed in the overall SUS scores in our study, even though the week picker required more time than the calendar picker. All four prototypes scored well overall, with Prototype A rated at the higher end of the accep- tance scale, and the other three falling between the ‘good’ and ‘excellent’ range, based on the scoring criteria by Bangor et al. (2008).
CONCLUSION
This study focuses on the differences in user experience caused by various date picker widgets and information presentation types. Through the assess- ment using objective data (task completion time) and subjective tools (System Usability Scale [SUS], NASA Task Load Index [NASA-TLX]), the generated results indicate: (1) Calendar date picker widgets are more suited for search- ing appointments further in the future. (2) Tabular information presentation enhances search efficiency but may require necessary learning and lead to higher cognitive load. (3) In more complex comparative tasks, there could be a transfer of information to the perceptual system, accelerating informa- tion absorption and retrieval. However, this study has limitations. It only focuses on a few design elements from existing medical apps, which might not be universally applicable in other domains. Future research could focus on: (1) Further investigating the impact of list and table information types on retrieval recognition task and compare tasks, as no differences were found in this study, necessitating more distinct task levels to validate the effect of infor- mation presentation types on different tasks. (2) Incorporating eye-tracking
The User Experience of App Interface Design in Hospitals: An Empirical Study 279
and physiological data to understand the visual search pathways in different information types.
ACKNOWLEDGMENT
Financial support of this research study by National Science and Technol- ogy Council under the grant MOST 111-2410-H-011-031-MY3 is gratefully acknowledged.
REFERENCES
Bangor, A., Kortum, P. T., & Miller, J. T. (2008). An Empirical Evaluation of the System Usability Scale. International Journal of Human–Computer Interaction, 24(6), 574–594. Bargas-Avila, J. A., Brenzikofer, O., Tuch, A. N., Roth, S. P., & Opwis, K. (2011).
Working towards Usable Forms on the World Wide Web: Optimizing Date Entry Input Fields. Advances in Human-Computer Interaction, 2011, e202701. Hund, P. M., Dowell, J., & Mueller, K. (2014). Representation of time in digital calendars: An argument for a unified, continuous and multi-granular calendar view. International journal of human-computer studies, 72(1), 1–11. Jordan, P. W. (2000). Designing pleasurable products: An introduction to the new
human factors. CRC press. Laubheimer, P. (2022, April 3). Data Tables: Four Major User Tasks. Nielsen Norman Group. https://www.nngroup.com/articles/data-tables/ Li, A. (2017, January 22). Date-Input Form Fields: UX Design Guidelines. Nielsen
Norman Group. https://www.nngroup.com/articles/date-input/ Lohse, G. L. (1997). The role of working memory on graphical information processing. Behaviour & Information Technology, 16(6), 297–308. Powers, M., Lashley, C., Sanchez, P., & Shneiderman, B. (1984). An experimental
comparison of tabular and graphic data presentation. International Journal of Man-Machine Studies, 20(6), 545–566. Prasad, G. V. S., & Ojha, A. (2012, July). Text, table and graph--which is faster and more accurate to understand?. In 2012 IEEE Fourth International Conference on Technology for Education (pp. 126–131). IEEE. Romikaityte, A., Stanci, S. A., De Andrés, J., Fernández-Lanvi, D., & González-
Rodrígue, M. (2022). A comparison of date selection elements on mobile touch devices in eCommerce sites. In CHIRA 2022: Proceedings of the 6th international conference on computer-human interaction research and applications, October 27–28, 2022, Valletta, Malta (pp. 217–224). SciTePress. Türkcan, A. K., & Onay Durdu, P. (2018). Entry and selection methods for specifying dates in mobile context. In Human-Computer Interaction. Interaction Technologies: 20th International Conference, HCI International 2018, Las Vegas, NV, USA, July 15–20, 2018, Proceedings, Part III 20 (pp. 92–100). Springer International Publishing.
LISTED IN THE AHFE DIGITAL BOOKSTORE CATALOGUE
Explore the complete digital volume
Usability and User Experience
Read this individual research paper free through the original publisher, or explore the full digital proceedings book.
ISBN 978-1-964867-32-8
Explore this ISBN in the AHFE Bookstore ↗Listed in the July 2026 bookstore catalogue; search by ISBN to confirm current availability · Digital book purchase optional