[Methods] In this study, interview survey and analysis were conducted with the aim of detecting accident risk from subjective health data of drivers. For interview survey, we observed time-series changes in VAS for 1956 individuals over a year and selected 11 drivers who showed a significant worsening of subjective health. The 11 drivers were asked two types of questions. The first was, "Are there any factors that you are aware of about the period of time during which you showed significant worsening?" The second was, "What factors do you think are present that could have a dangerous effect on your driving?" The Analysis phase of the study examined whether the use of subjective health information and additional information would be useful in detecting accident risk. From the first question, we defined four patterns of VAS worsening trends and analyzed the relationships between these patterns and accident risk. From the second question, the index "change in the time of work start" was derived as a factor that many drivers consider dangerous. We then analyzed the correlation between this new index and the near-miss rate. [Results] for the relationship between VAS and accident risk, it was found that two of the four VAS risk patterns had a significant negative correlation with the rate of near-misses. Furthermore, analysis of the relationship between “change in the time of work start” and the accident risk revealed a significant negative correlation when the absolute value of “change in the time of work start” was within ±6 hours. This means that the rate of near-misses increases when the workday starts earlier than the previous day. [Conclusion] To detect a hazard leading to a driving near-miss with the VAS data alone, the worsening would have to continue for long time over 4 or 8 weeks. However, the newly discovered convince indicator "change in the time of work start" is a feature with a short span, and its addition to the VAS and accident risk analysis may improve the accuracy of health risk detection.
In the transportation industry, employee health management is considered important as well as compliance with safe operation. Truck drivers, in particular, are subject to a high-load working environment with
Analysis and Interview Survey to Detect Subjective Fatigue and Accident Risk 69
irregular working hours, and the Japan Trucking Association is actively promoting health management initiatives. In addition to basic physical condition checks such as temperature and blood pressure at roll call, many transportation companies have recently introduced technology to objectively and subjectively assess drivers’ health conditions such as daily fatigue and stress. For objective evaluation, ANF (Autonomic Nerve Function) indices using pulse data obtained from wearable devices are mainly used. From previous studies, we have found an association between ANF and the incidence of near-misses while driving among truck drivers (Mizuno et al., 2020, Minusa et al., 2021 and Ito et al., 2023). ANF has been shown to be related to accident risk, but may differ from the driver’s subjective health status. The use of subjective health information is also essential in terms of creating alerts that are acceptable to the drivers. Subjective health assessment may be conducted using a VAS (Visual Analogue Scale) via smartphones, etc. VAS is intuitive and easy to interpret in assessing health status. A previous study examined the relationship between driver’s subjective health condition and driving performance and showed a significant correlation between VAS of fatigue and standard deviation of the bus lateral position (Gharagozlou et al., 2015). However, compared to objective assessments, changes in VAS vary widely among individuals. Especially for long-term changes across days, some people’s values do not change at all, while others increase or decrease significantly. It is difficult for managers of drivers to identify which trends to monitor and when. In this study, interview surveys and analysis were conducted with the aim of detecting driver’s accident risk from the changes of driver’s daily VAS.
MEASUREMENT DATA In this study, we used “SSCV-Safety,” a safe operation support system provided by LOGISTEED, Ltd., and collected data of 1956 drivers from January 2021 to June 2023. This system obtains driver’s subjective health data in VAS format before driving with smartphone and measures near-miss event data during driving with sensors mounted on the truck. As VAS data, we obtained the values of responses to two types of questionnaires. The first type is the response to the “Are you tired?” questionnaire, which we named Fatigue VAS. The second type is the response to the “Did you sleep well last night?” questionnaire, which we named Sleep VAS. In addition to VAS data, we also obtained information on near-misses that occurred during driving as accident risk. A near-miss is an event such as a “sudden stop” that is automatically detected by acceleration and other sensors installed in the vehicle. Table 1 shows the types of near-miss scenes that were targeted for detection in this study. These near-miss scenes were defined on the SSCV system, and were automatically detected by the system’s own logic based on acceleration and other onboard sensor data.
Table 1. Details of type of measured incident data during driving.
Table available in the original PDF paper.
Near-miss no. Name of near-miss scene 1 Temporary non-stop 2 Sudden steering 3 Sudden Deceleration 4 Distance warning 5 Insufficient distance 6 Impact 7 Forward collision warning 8 Overspeed
OVERALL VIEW OF THE PROPOSAL METHOD
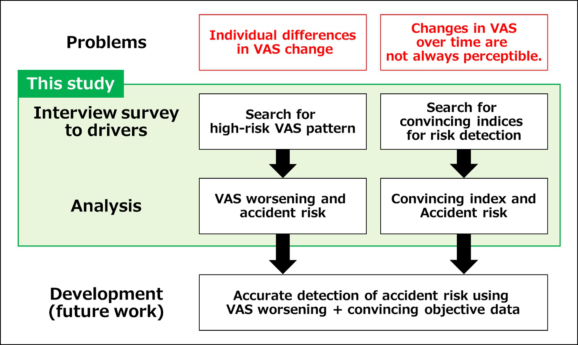
Figure 1 shows the overview of this study’s proposal method. We aimed to detect accident risk of drivers using subjective health data, but there are two challenges. The first is to achieve highly accurate detection, and the second is to ensure that users are satisfied with the detection results. The first challenge is due to individual differences in changes in VAS input data; the second challenge is because changes in subjective health over time are not always perceptible to the driver. To solve these issues, we decided to begin our research with an interview survey of drivers. The interview survey asked the drivers two different questions, and from the responses obtained, two analyses were conducted. To address the first challenge of individual differences in changes in VAS, we searched for high-risk VAS patterns common to many drivers and then analyzed relationship between the patterns and accident risk. To address the second challenge of satisfying drivers with the detection results, we also searched for and analyzed convincing index for drivers that can be used as a supplement to accident risk detection by VAS.
Figure 1: Overview of this study’s proposal method.
Analysis and Interview Survey to Detect Subjective Fatigue and Accident Risk 71
METHOD 1: INTERVIEW SURVEY TO SEARCH FOR SUBJECTIVE HEALTH RISK AND OBJECTIVE INDEX FOR ACCIDENT RISK DETECTION For interview survey, we comprehensively observed cases of VAS worsening over time from 1956 drivers and selected 11 drivers who showed a significant worsening. Some of them had significant VAS worsening in a short period of time, others slowly worsened over time, and still others had increasing and decreasing input values. The 11 drivers were asked two types of questions. The first was, “Are there any factors that you are aware of about the period of time during which you showed significant worsening?” and we examined what patterns of worsening are perceived by the drivers. As a result, four drivers answered “Yes” to the question. Table 2 shows the VAS worsening types of the four subjects and the factors answered by each of them. Clear factors and their background such as characteristics of work shift and physical condition changes were answered. The second question was, “What factors do you think are present that could have a dangerous effect on your driving?” and we checked what risk factors were considered by drivers whose subjective fatigue was worse. Several drivers answered that a sudden change in the timing of work start disrupts their sleep cycle and make drivers nervous about the driving.
Table 2. Types and factors for four drivers who were aware of worsening of VAS.
Table available in the original PDF paper.
VAS worsening type Comments on factors behind the worsening of VAS Fatigue and Sleep VAS decreased in 2 weeks “It was the end of a long holiday weekend. I always feel tired after a holiday weekend.” Fatigue and Sleep VAS decreased in 4 weeks
“It was the week of the early shift. During the early shift week, the closer it gets to the weekend, the more tired I get.” Fatigue VAS decreased and standard deviation increased in 4 weeks “The fatigue worsened on the day when I had to go to work suddenly earlier. I felt strongly fatigued.”
“In the latter half of the detection period, I was not feeling well. I had a fever while driving and visited a hospital after the work.” Fatigue VAS decreased and standard deviation increased in 8 weeks
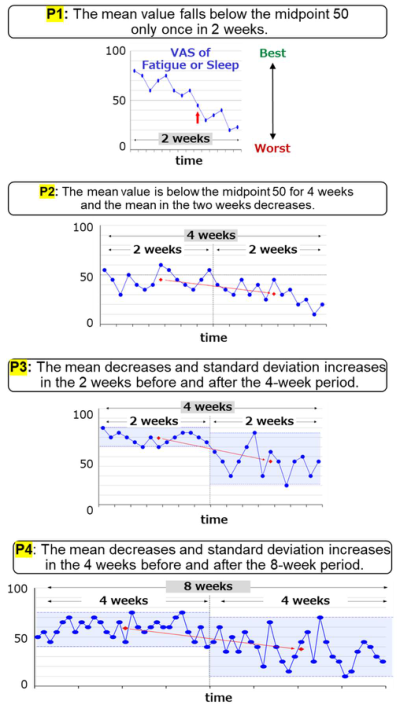
METHOD 2-1: ANALYSIS OF VAS WORSENING AND NEAR-MISS OCCURRENCE Because four drivers of different types answered there were factors during the VAS worsening from the interview survey, four patterns of VAS worsening trends were defined as subjective health risks (Figure 2). Patterns 1 to 4 are denoted as P1 to P4, respectively; P1 represents that the mean value falls below the midpoint 50 only once in 2 weeks; P2 represents that the mean value is below the midpoint 50 for 4 weeks; P3 represents that the mean decreases and standard deviation increases in the 2 weeks before and after the 4-week period; P4 represents that the mean decreases and standard
deviation increases in the 4 weeks before and after the 8-week period. These patterns were applied to obtained Fatigue and Sleep VAS data to detect subjective health risk. To examine the relationship between subjective health risk and accident risk, near-miss rates were calculated. Near-miss rates refer to the probability of one or more near-misses occurring in a day. Data were extracted only for drivers for whom VAS risk was detected at least once. The data for each driver was divided into sections where VAS risk was detected and not detected, and the median near-miss rate for the two sections was calculated. The near-miss rates of the detected and non-detected data were then compared with a confidence interval of P < 0.05.
Figure 2: Examples of four defined patterns of VAS worsening trends.
METHOD 2-2: SEARCH FOR NEW INDICATORS AND ANALYSIS About the second question in interview survey, several drivers answered that a sudden change in the timing of work start disrupts their sleep cycle, making them more likely to feel at risk for driving. We then calculated a new index,
Analysis and Interview Survey to Detect Subjective Fatigue and Accident Risk 73
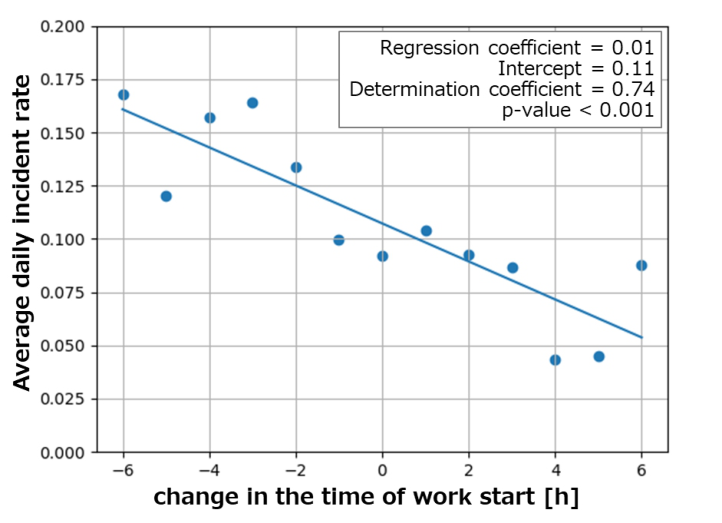
“change in the time of work start,” and analyzed its correlation with the accident risk. The following procedure was used to calculate the “change in the time of work start.” First, since drivers input VAS information every morning when they arrive at work, the time of VAS input was used as the time of arrival at work. Next, the time of arrival at work (0:00-23:59) was converted to the elapsed time [minutes] from 0:00 of the day, and then divided by 1440, which is minutes of one day, to obtain a “time of work start” with a minimum value of 0 and a maximum value of 24. Furthermore, the difference of “time of work start” between one day and previous workday was calculated as “change in the time of work start.” The minimum of the index is -12 and the maximum is +12. For example, if a driver’s work time one day was 7:00 a.m. and the previous day’s work time was 8:00 a.m., the “change in the time of work start” would be -1 [hour]. If the previous workday fell on more than one holiday, such as a Saturday, Sunday, or consecutive holidays, it was excluded from the analysis. At this point, we checked the data distribution and found that the larger the absolute value of “change in the time of work start,” the smaller the number of data. Therefore, to ensure the reliability of the statistical analysis, we decided to analyze the data within ±6 hours, which included at least about 100 data. Even within ±6 hours, there was a bias in the number of data depending on the value of “change in the time of work start.” Therefore, we calculated the mean rate of near-misses for each hour of the “change in the time of work start” interval. Finally, a single regression analysis using the least-squares method was conducted for the “change in the time of work start” and the near-miss rate, with a confidence interval of 95%.
RESULT
First, we present the results of the analysis on the correlation between subjective health risk and accident risk for the four defined VAS patterns. Table 2 shows the number of data in which VAS risk was detected in each pattern. Sleep VAS of P3 and P4 were barely detected. Table 3 shows the results of the correlation between VAS worsening trends and near-miss rates for each of the four patterns. A significant correlation was found for P3 and P4 worsening trend of the Fatigue VAS. Furthermore, as shown in Figure 2, the correlation between “change in the time of work start” and accident risk was confirmed, showing a significant negative correlation (P < 0.001).
Table 3. Number of VAS risk detections for 4 patterns.
Table available in the original PDF paper.
Pattern (Length) Number of target data
Number and rate of detection with fatigue VAS
Number and rate of detection with sleep VAS P1 (2 weeks) 6054 237 (3.9%) 244 (4.0%) P2 (4 weeks) 6767 993 (14.7%) 885 (13.1%) P3 (4 weeks) 6609 269 (4.1%) 3 (0.0%) P4 (8 weeks) 1633 70 (4.3%) 0 (0.0%)
Table 4. Results of VAS risk detection and significance different test of near-miss rate.
Table available in the original PDF paper.
P value
Pattern (Length) VAS type Near-miss rate in detected (mean±SD)
Figure 3: Result of regression analysis of “change in the time of work start” and near- miss rate.
DISCUSSION
The analysis on the presence or absence of detectable VAS worsening trends and near-miss rates showed that P3 and P4 VAS worsening pattern for Fatigue VAS was significantly related to accident risk. The two patterns have one thing in common: the standard deviation increased at the same time as the mean of the VAS decreased. Truck drivers who travel long distances have irregular work conditions such as destinations, routes, and work hours may vary. The repetition of short periods of intense fatigue and its recovery may have led to the accumulation of chronic fatigue, which in turn led to accident risk. We could not verify the Sleep VAS for P3 and P4 due to lack of detection
Analysis and Interview Survey to Detect Subjective Fatigue and Accident Risk 75
drivers. However, with additional data in the future, we may be able to confirm the relationship with accident risk for sleep as well. It has been shown in previous studies that subjective sleep quality has a significant relationship with near-misses while driving (Malish et al., 2016 and Alshareef, 2020). This study is not limited to non-time series data as in previous studies, but indicate that changes in subjective health status over time may also affect the increased risk of accidents. In addition, we found a new indicator, the “change in the time of work start.” The relationship between the new index and the accident risk was shown to have a negative correlation at P < 0.001. This indicates that the earlier the start of work than the previous day, the higher near-miss rate. Nurses in Japan work in shifts, and there are three types of work schedules: day shift, semi-night shift, and deep night shift. Counterclockwise changes in work schedules, such as deep night to semi-night, are deprecated because they violate the human circadian rhythm (Kubo et al., 2013). Truck drivers often have more irregular work hours than nurses, but they may share the same risk of coming to work earlier than the previous time.
CONCLUSION
In this study, we conducted an interview survey and analyzed the relationships between subjective health risk, a newly discovered index of “change in the time of work start,” and accident risk. Our findings indicate that the relationship between subjective health risk and accident risk is confirmed in two of the four patterns. Furthermore, the detection of accident risk using VAS was shown to be potentially highly accurate by “change in the time of work start,” which was newly discovered from the interview survey. The findings of this study may inform the health management of occupational drivers, including truck drivers.
ACKNOWLEDGMENT
The authors would like to acknowledge helpful discussions with Dr. Hirohiko Kuratsune, Inviting Professor at the Osaka Metropolitan University School of Medicine and Dr. Shigeru Haga, Professor Emeritus at Rikkyo University.
REFERENCES
Alshareef, S. (2020). Excessive daytime sleepiness and associations with sleep-related motor vehicle accidents: results from a nationwide survey, Sleep and Breathing Volume 25. Gharagozlou, F. Mazloumi, A. Saraji, N. G. Nahvi, A. Ashouri, M. Mozaffari H.
(2015). Correlation between Driver Subjective Fatigue and Bus Lateral Position in a Driving Simulator, Electronic Physician Volume 7, No. 4. Ito, N. Minusa, S. Tanaka, T. Li, Y. Kuriyama, H. (2023). Prediction of Future Collision Risk for Truck Drivers Using the Time-Series Autonomic Nerve Function, IEEE Access Volume 11. Kubo, T. Takahashi, M. Sallinen, M. Kubo, Y. Suzumura, H. (2013). How are leisure
activity and shiftwork schedule associated with recovery from fatigue in shiftwork nurses? Sangyo Eiseigaku Zasshi Volume 55, No. 3. LOGISTEED, Ltd. SSCV-Safety. https://www.logisteed.com/jp/sscv/safety/
Malish S, Arastu F, O’Brien LM. (2016). A Preliminary Study of New Parents, Sleep Disruption, and Driving: A Population at Risk?, Matern Child Health Journal Volume 20, No. 2. Minusa, S. Mizuno, K. Ojiro, D. Tanaka, T. Kuriyama, H. Yamano, E. et al. (2021).
Increase in rear-end collision risk by acute stress-induced fatigue in on-road truck driving. PLoS One Volume 16, No. 10. Mizuno, K. Ojiro, D. Tanaka, T. Minusa, S. Kuriyama, H. Yamano, E. et al. (2020).
Relationship between truck driver fatigue and rear-end collision risk. PLoS One Volume 15, No. 9.
LISTED IN THE AHFE DIGITAL BOOKSTORE CATALOGUE
Explore the complete digital volume
Human Interaction and Emerging Technologies (IHIET 2024)
Read this individual research paper free through the original publisher, or explore the full digital proceedings book.
ISBN 978-1-964867-33-5
Explore this ISBN in the AHFE Bookstore ↗Listed in the July 2026 bookstore catalogue; search by ISBN to confirm current availability · Digital book purchase optional