Steven Tolbert, Mehrdad Nojoumian (2025). Cross-Cultural Expectations from Self-Driving Cars. In: Human Factors in Design, Engineering, and Computing. AHFE Open Access, vol. 199, pp. 137–146. https://doi.org/10.54941/ahfe1006826
While the international adoption of Autonomous Vehicles (AVs) is imminent, cross-cultural user expectations remain poorly understood. In this study we utilized a survey with 57 questions prepared in English, German, and Spanish languages, distributed in the United States (n=52), Germany (n=64), and Panama (n=41), that asked 157 participants about their personal driving behaviors as well as their expectations from Self-Driving Cars (SDC). Several novel behavior and AI trust metrics are generated from the responses that show clear differences in expectations of autonomous technologies depending on the demographic sampled.
In the last decade, it has become apparent that the technologies powering self-driving cars are maturing at a rate that makes them a technological inevitability. The current standard for levels of driving automation is defined by SAE International’s SAE J3016 Levels of Driving Automation. The first three levels, 0, 1, and 2, vary from no driving automation to partial driving automation where the human driver monitors the road all the way to level 5 the vehicle is fully capable of automation in all scenarios. While self-driving cars are a certainty, the large-scale adoption of self-driving cars isn’t so clear. Current research accordingly points to a grim outlook on people’s perception of the technology. In 2021, Morning Consult surveyed 2200 adults in the United States and found that 47% of those surveyed believe autonomous vehicles are less safe than their human driven counterparts and that only 22% of those surveyed believe that autonomous vehicles are safer than a human driver (Teale, 2021). With nearly half of the survey population having serious doubts about the technology on the precipice of its arrival, it becomes clear that research must be conducted in improving consumer trust in self-driving cars (Shahrdar et al., 2018).
LITERATURE REVIEW
Research conducted by Lee et al. suggests that there are several factors affecting the adoption of self-driving cars. These factors include the perceived usefulness, self-efficacy, perceived risk, and psychological ownership to the
vehicle (Lee et al., 2019). Underlying most of these factors is the inherent trust a user has with the self-driving technology. It has been found that trust is a key factor in the person’s willingness to accept the technology and is largely shaped by their prior experiences (Gangadharaiah et al., 2023).
Additional survey studies have shown that people want utilitarian autonomous vehicles (Bonnefon, Shariff and Rahwan, 2016) that maximize the global safety of all members of society. The issue of course arises that any utilitarian framework puts the owner of the self-driving car at risk under certain conditions which comes at odds with the trust demands users have with autonomous vehicle technologies. Shariff et al. (2017) proposes that the discussion of risk needs to be posed in terms of “absolute risk” rather than relative risk as by driving a self-driving car your total risk of injury is diminished therefore one should not worry about edge cases where your safety may not be prioritized. When considering things from an absolute perspective users may be more likely to buy into a self-driving car as their chances of survival on any given drive are overall maximized by doing so.
One method of cultivating trust for self-driving cars is to improve on human-machine interaction, by designing self-driving cars in a way that communicates to passengers and have them play a more active role in the experience one can deliver a more trustful system for users, e.g., adaptive mood control (Nojoumian, 2021) and adaptive driving mode (Nojoumian, 2022). This is supported by research conducted by Hartwich et al. where evidence suggests that even given a SAE Level 4–5 system where no human interaction is required, the introduction of monitoring tools significantly improves passenger trust (Hartwich et al., 2021). Further research conducted by Hartwich et al. shows that the significance of the first experience with self-driving cars greatly impacts the trust one associates with the technology (Hartwich et al., 2019).
In addition to the first experience being significantly impactful to users’ perception of the technology, research from Shahrdar et al. shows how trust is greatly affected by the driving style used and that defensive driving builds more trust than aggressive driving in virtual reality simulated tests (Shahrdar et al., 2019). These tests also showed that while initial experiences were important, trust in the system can be rebuilt following faulty behavior given enough time experiencing safer and more defensive driving from the self-driving car.
Furthermore, the amount of control a user has seems to play strongly into a user’s ability to trust a given system. In the classical scenario of a person being chauffeured passengers often report that there is an increased level of discomfort while being a passenger as compared to an active driver (Ittner et al., 2020) and it appears that this analogue translates very well to the self- driving car scenario; yet, there is still a decreased amount of trust for robotic drivers versus a human driver given equivalent driving behaviors as shown by Mühl et al. (2020). This posits that not only do self-driving cars have to match human driving performance but exceed it in order to earn similar levels of trust. One must then consider methods of increasing trust in the system. Beyond increasing the interactions passengers can experience with a self-driving car, one can also modify the driving style to increase trust in
Cross-Cultural Expectations From Self-Driving Cars 139
the system. Research conducted by Basu et al. showed that a more defensive driving style led to higher trust in autonomous driving scenarios.
Interestingly, when participants were surveyed on their driving preferences for self-driving cars, they responded that they would want an experience similar to their own driving style. However, when passengers were placed in a simulated driving scenario it was found that they preferred a driving style that they believed was their own but instead was a much more conservative driving style (Basu et al., 2017). This coincides with research conducted by Hajiseyedjavadi et al. which showed that in a simulator drivers preferred their own driving styles over a faster one but still provided negative feedback when replaying their own driving style on urban roads versus rural roads suggesting that environmental condition plays a significant part in preferred driving style (Hajiseyedjavadi et al., 2022). These results are partly supported by Dettmann et al. which showed that younger drivers preferred autonomous driving styles that are similar to their own; however, older drivers preferred a more aggressive driving style to their own. Dettmann also concludes by stating the main factors in driving style preference depend on “speed, acceleration and deceleration behavior as well as distance control” (Dettmann et al., 2021).
In another study done by Schlüter et al. it is found that technological affinity and skepticism to the technology should also be considered when designing adaptive driving style autonomous vehicle technologies (Schlüter et al., 2021). Further research conducted by Bellem et al. showed how participants in a simulation study preferred driving styles that minimized acceleration and jerk when performing driving actions such as lane changing. Bellem et al. also reported that personality traits associated with participants did not have any significant observable effects on autonomous driving preferences (Bellem et al., 2018).
Similar results were observed by Craig et al. where surveyed participants showed that they expect a self-driving car to behave in a slightly less aggressive manner than their own driving style (Craig and Nojoumian, 2021). Methods proposed by Park et al. suggest adapting the driving behavior based on EEG feedback to establish and maintain trust in the system (Park and Nojoumian, 2022; Park et al., 2018).
With these questions in mind, we must further consider how users will respond with these technologies outside of the demographics in which research is collected. There is a great question as to how research participants are biased by the infrastructure and cultural norms of the country in which research takes place. There are some surveys that provide an international view such as research conducted by Deloitte in 2020 which provided responses by country (South Korea, Japan, United States, Germany, India, China) detailing the percentage of consumers who believe SDCs will not be safe. The results provided by Deloitte in 2022 for most countries follow United States sentiments (50% belief they will not be safe) with some outliers, such as China whose survey data suggests a more trusting sentiment and India whose survey data suggests a less trusting sentiment.
With most of the self-driving car research being conducted and tested domestically within the United States from many Silicon Valley startups,
140 Tolbert and Nojoumian
it becomes challenging to understand the global needs of this technology when so much of this research is based on the experiences of US drivers on American roads. Throughout this paper we establish new scales through surveys that allow measurement of various driving behaviors and expected behaviors from self-driving cars. Using these scales, we provide evidence to suggest that self-driving car behaviors should be tailored to region expectations to create a self-driving car experience more consistent with a driver’s own driving expectations.
QUANTITATIVE MEASUREMENT We surveyed 157 people across the United States, Germany, and Panama that were recruited through local-networking and through PollPool.com. These regions were chosen as the U.S. and Germany represent two global hubs of automotive manufacturing and are leading the charge in self-driving technologies at scale. In contrast, Panama was chosen as an emerging market due to its high number of consumer sales across Central America where in 2019 it had the highest number of vehicles registered or sold in the region (Carlier, 2021). Each question asked can be related to a quantitative value to define a Driving Behavior Aggressiveness (DBA), Self-Driving Car Aggressiveness (SDCA), AI Driving Mechanics Trust (AIDMT), general AI Trust (AIT), and Driver Safety Score (DSS) metrics. Each question’s encoded score can be valued between 0 and 1, where a score of 0 represents a cautious/- conservative action, a score of 0.5 represents a moderate action, and a score of 1 represents a more aggressive action. Responses from highway based and non-highway-based questions are averaged together to provide a more general scoring of the driver’s aggressiveness in all situations. The same method was applied to questions related to SDCA questions across highway and non-highway questions. For DBA scores, a score of 0 represents a conservative driver and a score of 1 represents an aggressive driver. For SDCA scores, a score of 0 represents a conservative SDC and a score of 1 represents an aggressive SDC. These scores can then be used to contrast expectations of a SDC to their own driving behaviors. As a prerequisite to most consistency and reliability tests as it relates to new scales the assumption of unidimensionality of the scale must be proven. In this survey, we introduce 5 new scales to measure various driving behaviors based on survey responses. These scales are constructed from a subset of questions we believe to relate to a larger given metric. To prove that these questions are unidimensional, i.e., they measure a single larger factor we consider a confirmatory factor analysis (CFA) of these questions. The CFA analysis considered how each item in a scale related to a single variable fitted to polychoric correlations to account for the categorical nature of Likert-type scales (Flora, 2020). Of interest to our study is the Chi-Square, Comparative Fit Index (CFI) and Tucker-Lewis index (TLI). Root mean square error of approximation (RMSEA) is also provided but should only lightly be considered for this study due to known issues which underestimate the model fit when the number of degrees of freedom of the model and the sample size is small which is the case with our analysis (Kenny et al., 2015). The fit parameters for each
Cross-Cultural Expectations From Self-Driving Cars 141 scale can be seen in Table 1. These results show that the χ2 for each scale is greater than .05 and thus non-significant and the values for the CFI and TLI are greater than 0.9 indicating a strongly fitting unidimensional model constructed from the items in each scale, finally the RMSEA metrics show a moderate fit on the given data. To provide validity to our analysis, the consistency and reliability of each test must be validated. While Cronbach’s Alpha is often used for this purpose in literature, it rarely is applicable to real data as it assumes tau-equivalence of the items within each set (Sijtsma, 2009; Ten Berge and Soˇcan, 2004). Further, if this requirement is not met, the reported Cronbach’s alpha value will underestimate the reliability of the test. To get around these issues we will consider the more modern measure of reliability known as McDonald’s Omega (ωu) (McDonald, 2013) which takes a factor analysis approach to deriving correlations between items. McDonald’s Omega maintains the same range and threshold of accepted consistency as Cronbach’s Alpha where values greater than 0.7 are considered acceptable. Our results shown in Table 1 for McDonald’s Omega exceed 0.7 confirming good reliability for all five scales.
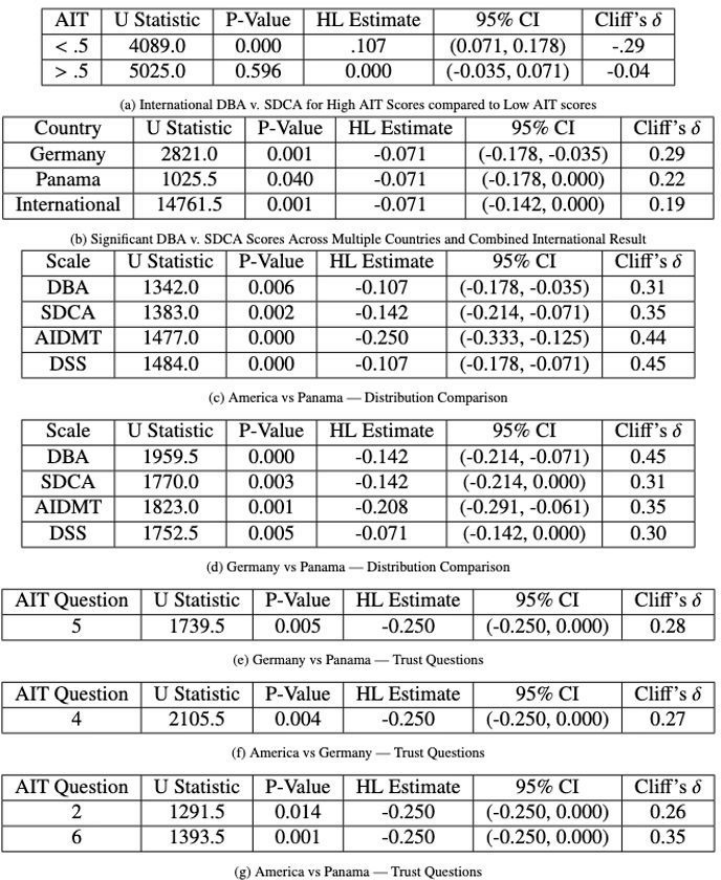
RESULTS: STATISTICALLY SIGNIFICANT MEASURES We compared the scores from our defined quantitative metrics (DBA, SDCA, AIDMT, AIT, and DSS) against the collected demographic data to identify statistically observable differences, both within national populations and from an international perspective. We compared distributions using single-sided and two-sided Mann-Whitney U tests. For analyses within a single country, results were considered significant if the p-value was less than 0.05. In comparisons involving multiple countries, we applied a Bonferroni-corrected alpha (Dunn, 1961), requiring a p-value of less than 0.016 to control for Type I error. For significant findings, we employed additional statistical tools to provide more context. Confidence intervals describing the estimated locational shift between distributions were produced using the Hodges-Lehmann (HL) estimator (Hodges & Lehmann, 1963), bootstrapped with 10,000 iterations. We also report Cliff’s δ (Cliff, 1993) to measure the effect size, which describes the tendency for scores in one group to be higher than another. Cliff’s δ is measured on a scale of −1 to +1, where 0 represents perfect overlap between groups. Select results are summarized in the following list and described in statistical detail in Figure 1 (a)-(g).
142 Tolbert and Nojoumian
Figure 1: Statistical results.
International DBA and SDCA Metrics: Drivers preferred more conservative self-driving cars than their own style (p = 0.001). Higher AIT scores are correlated with a more aggressive SDC driving style more similar to their own, while low AIT scores maintain preference for conservative SDCs (p<0.001).
United States: Higher trust in AI driving mechanics (AIDMT) but lower overall technology trust (AIT) (p = 0.03).
Germany: Preference for conservative SDCs over own behaviors (p = 0.001); higher trust in AI driving mechanics (AIDMT) but lower overall technology trust (AIT) (p = 0.007).
Cross-Cultural Expectations From Self-Driving Cars 143
Equation reproduced from the original PDF.
US vs Germany: The US showed higher trust for navigation through crowded pedestrian areas compared to German respondents (AIT question 4) (p = 0.004). US vs Panama: The US scored higher on DBA (p = 0.006), SDCA (p = 0.002), AIDMT (p<0.001), and DSS (p<0.001). The US showed higher trust for safety prioritization (AIT question 2) (p = 0.014) and unmanned vehicle navigation (AIT question 6) (p = 0.001).
Germany vs Panama: Germany scored higher on DBA (p<0.001), SDCA (p = 0.003), AIDMT (p = 0.001), and DSS (p = 0.005), with similar AIT scores. Germany showed higher trust for exact destination navigation (AIT question 5) (p = 0.005).
The potential causes for the observed differences could be a result of several factors. One factor could be the difference in road quality. According to the road quality indicator provided by the World Economic Forum (Schwab, 2022) US and German roads score significantly higher than all Central American roads and US and German roads share a similar score of 5.5 and 5.3 respectively. One may also consider the digital adoption index (DAI) provided by the World Bank which shows the US and Germany having a higher DAI than most Central American countries (World Development Report 2016: Digital Dividends, 2016). The low adoption rate of digital technologies could be one cause of the lower trust observed in AI metrics measured. Overall understanding the proper context driving these differences will be key in delivering autonomous vehicles and AI technology internationally.
CONCLUDING REMARKS Our research concludes that there exist observable differences in the quantitative metrics defined across the United States, Germany and Panama. At an international level, comparing the three countries survey results combined, this analysis found that drivers were more willing to engage with a self-driving car that had a more aggressive driving style similar to their own if they had a higher trust towards AI technologies, based on their AIT scores, while drivers who were distrustful of AI technologies preferred a self-driving car that was more conservative than their own driving style. When comparing individual countries further observations are made.
Of note, Panama had the lowest average SDCA score that deems a much more conservative SDC experience is requested in that part of the world as compared to both the United States and Germany, which measured a much higher average SDCA score. Furthermore, when comparing Panamanian respondents to German respondents, statistical differences were found in almost all quantitative measurements suggesting either a vastly different technology should be developed for Panamanians, or a completely different strategy should be employed for social acceptability of SDCs in that region.
144 Tolbert and Nojoumian
Further work on this study can be conducted by expanding the sample size of the nations surveyed as well as increasing the number of nations surveyed to get a better understanding of the global needs of the SDC technology. Autonomous vehicles are being deployed on the roads rapidly with potentially new features, such as safety reasoning (Nojoumian, 2025a), risk awareness and avoidance (Nojoumian and Skaug, 2025b, 2025a), vulnerable occupant detection (Nojoumian, 2025b) and speed management (Nojoumian, 2024). These technological advancements will certainly affect the whole trust-in-AV landscape in the new future, especially when it comes to mixed traffic situations involving self-driving cars and human-driving vehicles. Therefore, new studies must be conducted to better understand how human trust in AVs will be evolved over time.
ACKNOWLEDGMENT
We thank the anonymous reviewers for their inspiring and constructive feedback.
CODE AVAILABILITY All code used to generate the results of this analysis are freely available at: https://github.com/stevenwtolbert/self-driving-car-subjective-sampling-d ata-analysis.
REFERENCES
Basu C., Yang Q., Hungerman D., Singhal M. and Dragan A. D. (2017). Do you want your autonomous car to drive like you? ACM/IEEE International Conference on Human-Robot Interaction, pp. 417–425. Bellem H., Thiel B., Schrauf M. and Krems J. F. (2018). Comfort in automated
driving: An analysis of preferences for different automated driving styles and their dependence on personality traits, Transportation Research Part F: Traffic Psychology and Behavior 55, pp. 90–100. Bonnefon J.-F., Shariff A. and Rahwan I. (2016). The social dilemma of autonomous vehicles, Science 352 (6293), pp. 1573–1576. Carlier M. (2021). New vehicle sales in Central America by country https://www.
statista.com/statistics/892278/central-america-new-vehicle-salesregistration- number/#statisticContainer. Cliff, N. (1993). Dominance statistics: Ordinal analyses to answer ordinal questions, Psychological Bulletin 114 (3), pp. 494–509. Craig J. and Nojoumian M. (2021). Should self-driving cars mimic human driving
behaviors? 3rd International Conference on HCI in Mobility, Transport and Automotive Systems, LNCS 12791, Springer, pp. 213–225. Dettmann A., Hartwich F., Rossner P., Beggiato M., Felbel K., Krems J. and Bullinger-Hoffmann A. (2021). Comfort or not? Automated driving style and user characteristics causing human discomfort in automated driving, International Journal of Human-Computer Interaction 37, pp. 1–9. Dunn, O. J. (1961). Multiple Comparisons among Means, Journal of the American
Statistical Association 56 (293), pp. 52–64.
Cross-Cultural Expectations From Self-Driving Cars 145
Flora D. B. (2020). Your coefficient alpha is probably wrong, but which coefficient omega is right? A tutorial on using r to obtain better reliability estimates, Advances in Methods and Practices in Psychological Science 3 (4), pp. 484–501. Hajiseyedjavadi F., Boer E. R., Romano R., Paschalidis E., Wei C., Solernou A.,
Forster D. and Merat N. (2022). Effect of environmental factors and individual differences on subjective evaluation of human-like and conventional automated vehicle controllers, Transportation Research Part F: Traffic Psychology and Behavior 90, pp. 1–14. Hartwich F., Hollander C., Johannmeyer D. and Krems J. F. (2021). Improving passenger experience and trust in automated vehicles through user-adaptive HMIs: “The more the better”Does not apply to everyone, Frontiers in Human Dynamics, Vol. 3. Hartwich F., Witzlack C., Beggiato M. and Krems J. F. (2019). The first impression
counts–a combined driving simulator and test track study on the development of trust and acceptance of highly automated driving, Transportation research part F: traffic psychology and behavior 65, pp. 522–535. Hodges, J. L. and Lehmann E. L. (1963). Estimates of Location Based on Rank Tests, The Annals of Mathematical Statistics 34 (2), pp. 598–611. Ittner S., Mühlbacher D. and Weisswange T. H. (2020). The discomfort of riding
shotgun–why many people don’t like to be co-driver, Frontiers in Psychology 1, 584309. Kenny D. A., Kaniskan B. and McCoach D. B. (2015). The performance of RMSEA in models with small degrees of freedom, Sociological Methods and Research 44 (3), pp. 486–507. Lee J., Lee D., Park Y., Lee S. and Ha T. (2019) Autonomous vehicles can be shared,
but a feeling of ownership is important: Examination of the influential factors for intention to use autonomous vehicles, Transportation Research Part C: Emerging Technologies 107, pp. 411–422. Mühl K., Strauch C., Grabmaier C., Reithinger S., Huckauf A. and Baumann M.
(2020). Get ready for being chauffeured: Passenger’s preferences and trust while being driven by human and automation, Human factors 62 (8), pp. 1322–1338. McDonald R. P. (2013). Test theory: A unified treatment, psychology press, 2013. Nojoumian M. (2021). Adaptive mood control in semi or fully autonomous vehicles, US Patent 10, 981, 563. Nojoumian M. (2022). Adaptive driving mode in semi or fully autonomous vehicles,
US Patent 11, 221, 623. Nojoumian M. (2024). Adaptive Speed-limit Measurement (ASM) based on the traffic flow in semi or fully autonomous vehicles, US Patent 63/631, 090. Nojoumian M. (2025a). Safety Self-Talks (SST) by large language models in semi or
fully autonomous vehicles, US Patent 63/747, 463. Nojoumian M. (2025b). Active occupant status and vehicle operational status warning system and methods, US Patent 17/542, 807. Nojoumian M. and Skaug L. (2025a). Sun Glare Avoidance System (SAS) in semi or
fully autonomous vehicles, US Patent 19/016, 240. Nojoumian M. and Skaug L. (2025b). Road-Risk Awareness System (RAS) in semi or fully autonomous vehicles, US Patent 19/016, 485. Park C. and Nojoumian M. (2022). Social acceptability of autonomous vehicles:
Unveiling correlation of passenger trust and emotional response, 4th Int. Conference on HCI in Mobility, Transport and Automotive Systems, LNCS 13335, Springer, pp. 402–415.
146 Tolbert and Nojoumian
Park C., Shahrdar S. and Nojoumian M. (2018). EEG-based classification of emotional state using an autonomous vehicle simulator, 10th Sensor Array and Multichannel Signal Processing Workshop, IEEE, pp. 297–300. R. Gangadharaiah R., Mims L. W., Jia Y. and Brooks J. O. (2023). Opinions from
users across the lifespan about fully autonomous and rideshare vehicles with associated features, SAE Technical Paper Series. Schlüter J., Hellmann M. and Weyer J., Identifikation von fahrertypen im kontext des automatisierten fahrens, Forschung im Inge-nieurwesen 85, pp. 1–11. Schwab K. (2022). The global competitiveness report 2019: http://www3.weforum.
org/docs/WEF_TheGlobalCompetitivenessReport2019.pdf. Shahrdar S., Menezes L. and Nojoumian M. (2018). A survey on trust in autonomous systems, Computing Conference, Springer, pp. 368–386. Shahrdar S., Park C. and Nojoumian M. (2019). Human trust measurement using
an immersive virtual reality autonomous vehicle simulator, 2nd AAAI/ACM Conference on Artificial Intelligence, Ethics, and Society, ACM, pp. 515–520. Shariff A., Bonnefon J.-F. and I. Rahwan I. (2017). Psychological roadblocks to the adoption of self-driving vehicles, Nature Human Behavior 1. Sijtsma K. (2009). On the use, the misuse, and the very limited usefulness of
cronbach’s alpha, Psychometrika 74 (1). Teale, C. (2021). Amid Tesla’s autopilot probe, nearly half the public thinks autonomous vehicles are less safe than normal cars: https://morningconsult.com/ 2021/09/02/autonomous-vehicles-safety-consumerinterest-polling/. Ten Berge J. M. F. and Soˇcan G. (2004). The greatest lower bound to the reliability of a
test and the hypothesis of unidimensionality, Psychometrika 69 (4), pp. 613–625. World Development Report (2016). International Bank for Reconstruction and Development: Digital Dividends, World Bank.
LISTED IN THE AHFE DIGITAL BOOKSTORE CATALOGUE
Explore the complete digital volume
Human Factors in Design, Engineering, and Computing
Read this individual research paper free through the original publisher, or explore the full digital proceedings book.
ISBN 978-1-964867-75-5
Explore this ISBN in the AHFE Bookstore ↗Listed in the July 2026 bookstore catalogue; search by ISBN to confirm current availability · Digital book purchase optional